In this article we examine a growing divergence in Russia inflation outlook using the Global Macro Sentiment Indices. The Bank of Russia has cut its key rate substantially since 2025 as price pressures eased. Yet the latest GMSI signals across monetary policy, supply chains and inflation are now moving the other way, pointing to renewed pressure beneath the official disinflation.
For most of the past eighteen months Russia inflation outlook has been running a disinflation story that looked, until recently, close to completion. Annual inflation fell from above 10% in early 2025 to roughly 5.3% by the beginning of this summer, allowing the central bank to lower its key rate from 21% to 14%.By June, however, inflation was back at 6%. The tide had begun to turn. The four sentiment panels below show how that reversal was already taking shape across monetary policy, supply chains, prices and political tension, leaving the earlier disinflation story looking increasingly fragile.

On the policy-outlook chart, the run of rate cuts appears as a long descending staircase. Yet directional sentiment focused on macroeconomic implication shows that coverage has pivoted the other way, shifting through the first half of 2026 towards the hawkish side of neutral to stand at +0.6z, even as the Bank of Russia has continued to ease. The signal tracks the direction of policy commentary rather than a market instrument, so it is best read as evidence that the expected policy path is becoming tighter while the current rate still falls.
The July decision brought that tension into the open. The central bank lowered the key rate, but raised its inflation forecast, lifted the projected rate path and said further cuts would proceed more slowly, citing inflation expectations, impaired production capacity and a more expansionary fiscal outlook. It also warned that a wider structural deficit could keep policy tighter than its baseline assumes. That matters, because it means the pressure on rates is not only a temporary supply story: fiscal demand is reducing the room to look through the shock.
The pressure runs in the other direction as well. In the run-up to the meeting, businesses squeezed by high borrowing costs pushed for relief, and calls from Moscow had called for further cuts. The Bank is therefore not simply weighing inflation against growth. It is trying to slow its own easing cycle while much of the corporate sector presses for cheaper credit.

The pressure now sits in supply. The supply-chain risk panel has climbed to +1.9z, close to the top of its two-year range, after rising sharply since June. At first, the move reflected attacks on refineries, oil depots and transport routes, alongside fuel shortages and tighter diesel supply. What has changed is where the disruption bites. For much of the war, the economic strain was concentrated in the oil complex. It has now moved closer to the infrastructure of everyday consumption.
Since 18 July, Ukrainian drones have struck warehouse facilities operated by Wildberries, Russia’s largest online retailer. The first attacks hit logistics hubs in Kotovsk and Elektrostal, killing workers and injuring dozens. Further sites were later affected in southern Russia and near St Petersburg. By late July, warehouses representing roughly 10% of the company’s logistics capacity had reportedly been attacked, while separate estimates placed the share potentially out of service nearer 8%.
These are not peripheral targets. Russia’s leading online marketplaces handle goods and services worth the equivalent of roughly 8.5% of GDP and support about four million jobs. They have become part of the country’s consumer infrastructure, particularly in regions where physical retail is thinner. Strikes on refineries raise costs upstream; strikes on warehouses bring the disruption closer to the shelf.
The attacks have also landed on a retail system with limited spare capacity. Russia’s number of physical shops fell over the past year, the first nationwide decline reported in a quarter of a century, with thousands of outlets disappearing from Moscow and St Petersburg. That does not imply national shortages. It does leave fewer alternatives when a major distribution hub is disrupted, particularly outside the largest cities.
The same imbalance is visible in fuel distribution. Supplies have been redirected from Siberia and supplemented with imports from Belarus to stabilise the Moscow region, while shortages have persisted elsewhere. The result is a more uneven geography of disruption-and a growing sense that the economic burden is no longer confined to refineries, ports or the front.

Bottlenecks and constraints on the domestic supply chains are beginning to coincide with renewed price pressure. The headline-inflation sentiment has risen to +0.7z after spending much of the disinflation below neutral, turning before the published series. Annual inflation, having fallen to around 5.5% earlier in the summer, stood closer to 6% by late June.
Much of the pressure predates the warehouse attacks. Inflation was already firming through fuel as repeated strikes on refining infrastructure soured the availability of supply. Reports of shortages and queues at petrol stations became more common palace in parts of the country. Petrol prices rose by 6.88% m-o-m in June, while diesel costs also increased during the agricultural season, with farmers being particularly worse off and having limited scope to reduce consumption.
The Bank of Russia has acknowledged that higher fuel costs are spreading into a broader range of goods and services, prompting it to raise its 2026 inflation forecast to 6–7%. Its assessment remains measured: much of the increase is considered temporary, underlying inflation is put at 4-5%, and weaker demand is expected to limit further pass-through. Fuel, fruit and vegetables have accounted for much of the recent volatility, reflecting both seasonal supply conditions and the higher cost of transporting perishable goods quickly through the distribution network. The inflation outlook is becoming increasingly uneven as the pressure is no longer confined to a single category.

The attacks on warehouses form one part of a wider rise in the domestic economic cost of the war. The political-tension panel remains close to the top of its two-year range, although the recent increase is not driven by logistics alone. The underlying coverage extends to mobilisation and preparations for possible unrest, disputes over wage arrears and staff shortages, public dissatisfaction and reported friction within the political system.
The panel is shown as a rolling sentiment sum rather than a standardised score because the signal has remained elevated for so long that z-scoring compresses the change that matters. At around 2,640, it remains well above the levels recorded in early 2025, even after easing from its June peak.
The reading comes with one caveat: much of the late-July coverage is international reporting on these themes rather than a direct measure of Russian public reaction. Its political significance lies less in any single headline than in the growing visibility of the war’s social cost. Fuel shortages, transport disruption, delayed wages and the prospect of further mobilisation are becoming harder to contain within the economic sphere alone.
The Central Bank had good reason to continue cutting. Inflation had fallen materially, domestic demand was weakening and business expectations for output had softened. Lending growth had slowed to a crawl, consumer-facing firms were under pressure and high borrowing costs were suppressing discretionary spending.
The forces now pushing in the opposite direction are largely supply-driven: damaged refining capacity, more expensive transport and disruption to the distribution of consumer goods. Interest rates cannot repair a refinery or replace a warehouse. But cutting too quickly while those shocks feed into expectations risks turning a temporary rise in prices into persistent inflationary pressure. Households’ own expectations tell the story, perceived inflation rose to 14.7% in July from 12.4% in June, far above the Bank’s revised forecast of 6-7%.
Keeping policy restrictive carries costs of its own. Credit conditions remain tight, businesses are pressing for cheaper borrowing and consumer-facing activity is weakening. At the same time, a more expansionary budget as the conflict persists would leave monetary policy carrying a greater share of the burden.
Where the government and central bank go next will depend in part on whether strikes against refineries and warehouses continue. Damaged capacity creates immediate disruption, but much of it can eventually be rebuilt. The greater risk is that a prolonged deterioration in supply chains pushes costs further into services and hardens wage demands. That would be far more difficult to reverse. The first signs of renewed price pressure have therefore left the Bank in an increasingly precarious position, with its tolerance for further inflation likely to be tested at the next meeting.
Read through the official data alone, Russia in mid-2026 appears to be an economy in which disinflation has progressed far enough to permit lower interest rates. The point in time sentiment from the GMSI offers a less settled reading. The decline in inflation was genuine, but it is meeting a fresh round of supply pressure just as the central bank has begun to ease. The first shock came through fuel and refining capacity and has spread into freight, food and services, while the attacks on major warehouses have exposed the vulnerability of the consumer-distribution network. None of this yet amounts to a return to the inflation regime of 2024 or early 2025. It does make the final stage of disinflation harder, and the next rate cut less straightforward.
This analysis powered by Permutable’s Global Macro Sentiment Indices examines where energy inflation pressure is intensifying as oil disruption, currency weakness and higher import costs move into domestic economies. It compares Saudi Arabia, Chile, Indonesia, Mexico and Japan, while explaining why no confirmed declines were published. It is aimed at investors, economists, policymakers, risk teams and commodity or macro strategists tracking inflation transmission across markets.
Energy inflation sentiment rose most sharply in Saudi Arabia, Chile and Indonesia as disruption around Saudi oil routes pushed crude prices higher and began feeding into fuel, import and fiscal pressures elsewhere. Mexico and Japan completed the five confirmed rises. No country passed the full evidence test for a weekly fall: although several numerical averages declined, their dominant headlines continued to describe rising energy costs.
Permutable’s latest Global Macro Sentiment Indices rankings capture the point at which higher oil prices began to move beyond global commodity markets and into country-level inflation concerns.
Saudi Arabia recorded the largest weekly increase. The signal was driven by threats to Red Sea ports, attacks on Saudi-linked tankers and the risk that shipping disruption could constrain global supply. This is primarily a Saudi-associated oil-market signal rather than evidence of an equivalent increase in Saudi household energy prices.
The transmission was more direct elsewhere. Chilean coverage moved towards imminent increases in petrol and diesel prices. In Japan, higher crude prices and a weak yen lifted the import bill and electricity costs. Indonesia’s signal strengthened through the fiscal cost of more expensive oil and the effect of higher non-subsidised fuel prices. Mexican headlines increasingly connected stronger oil benchmarks with domestic petrol costs.
The common driver was the same, but the mechanism differed: physical supply risk in Saudi Arabia, pump-price pass-through in Chile and Mexico, import-cost inflation in Japan, and subsidy and budget pressure in Indonesia.
The rankings compare 20–26 July 2026 with 13–19 July 2026 using the canonical GMSI topic Economic Data-Inflation–Energy.
A rise means that average directional sentiment per matched headline moved towards stronger energy-price pressure. This may include higher oil, gas, electricity or fuel prices, as well as evidence that those costs are passing into consumer inflation, imports, public finances or business expenses.
A fall requires headline evidence of moderating energy prices or weaker inflation pass-through. A lower numerical average is not sufficient when the dominant stories still describe rising costs.
Domestic and international coverage are combined. Sentiment is divided by matched headline count in each seven-day period so countries with larger news volumes do not dominate the comparison.
For energy exporters, the signal may reflect supply disruption and international price pressure associated with the country rather than domestic consumer-price inflation alone.
| Rank | Country | 13–19 July | 20–26 July | Weekly change |
| 1 | Saudi Arabia | −0.004 | +0.609 | +0.613 |
| 2 | Chile | −0.016 | +0.268 | +0.284 |
| 3 | Indonesia | −0.108 | +0.104 | +0.211 |
| 4 | Mexico | +0.150 | +0.277 | +0.127 |
| 5 | Japan | +0.310 | +0.423 | +0.114 |
Average directional sentiment per matched headline. A higher value indicates stronger energy inflation pressure.
Saudi Arabia’s signal moved from broadly balanced to strongly inflationary as the threat to regional oil infrastructure became more concrete. The focus shifted from general Middle East tension towards port disruption, tanker attacks and the possibility of a sustained premium in global oil prices.
The ranking reflects Saudi Arabia’s central position in the global oil-supply system. The immediate inflation mechanism runs through international crude and transport costs, with the effects then transmitted to energy-importing economies.
Chile’s energy inflation signal turned decisively higher as global oil gains began to feed into expectations for domestic petrol and diesel prices. Coverage moved from earlier reports of relatively low fuel costs towards specific warnings of increases from the end of July.
Chile’s move is one of the clearest cases of external energy pressure approaching domestic inflation. The mechanism operates through both the oil benchmark and the exchange rate.
Indonesia moved from negative to positive energy inflation sentiment as the discussion shifted towards the budgetary and consumer consequences of higher oil prices. The strongest stories focused less on the commodity price itself than on who would absorb the increase.
Indonesia’s signal is therefore not limited to headline inflation. The pressure is being transmitted through subsidies, government spending choices and the relative cost of conventional transport.
Mexico’s energy inflation signal strengthened as higher crude benchmarks were joined by reports of rising domestic petrol prices. As an oil producer and fuel consumer, Mexico experiences the shock through both export revenues and household costs.
The Mexican story is not simply that the country benefits from expensive oil. The downstream effect depends on refining capacity, fuel imports and the extent to which retail prices are absorbed by government, producers or consumers.
Japan’s already elevated energy inflation signal rose further as higher crude prices combined with currency weakness. The country’s dependence on imported energy makes this one of the most direct transmission channels in the ranking.
Japan’s ranking illustrates the interaction between commodities and foreign exchange. Even where the global oil move is shared, a weaker currency can materially increase the inflationary effect.
No country passed the full evidence test for a confirmed decline in energy inflation sentiment this week.
The five largest numerical falls were:
| Numerical rank | Country | 13–19 July | 20–26 July | Weekly change | Evidence verdict |
| 1 | United Kingdom | +0.461 | −0.071 | −0.532 | Excluded |
| 2 | Canada | +0.368 | +0.004 | −0.364 | Excluded |
| 3 | France | +0.470 | +0.165 | −0.304 | Excluded |
| 4 | Hungary | +0.385 | +0.175 | −0.210 | Excluded |
| 5 | South Africa | +0.179 | +0.006 | −0.173 | Excluded |
These countries are not treated as confirmed falls because their dominant high-impact headlines continued to point towards stronger energy-price pressure:
The numerical declines may reflect changes in the wider distribution of matched headlines, but they do not provide sufficiently coherent evidence of easing energy inflation pressure. They are therefore excluded from the confirmed ranking.
The energy inflation story became more geographically specific. During the preceding week, much of the coverage centred on the general rise in oil prices following escalating Middle East tensions. Between 20 and 26 July, that broad shock developed into a series of more defined transmission channels.
Saudi Arabia became the centre of the global supply-risk story as attacks on tankers and threats to Red Sea ports raised concerns about physical delivery. Chilean and Mexican coverage moved closer to the consumer, with specific reports of petrol-price increases. Japan’s import data showed how higher oil and a weaker currency were combining to raise the domestic cost of energy. In Indonesia, the shock appeared through the public finances and the cost of maintaining fuel support.
The absence of confirmed falls is equally important. Some country averages declined, but the underlying news flow remained dominated by higher oil, gas, fuel and electricity prices. This was therefore not a week in which energy inflation pressure split evenly between countries. The strongest evidence continued to point in one direction, even where the numerical intensity of the signal softened.
The result is a ranking led by countries closest to one of three mechanisms: disruption to oil supply, reliance on imported energy, or direct pass-through into fuel prices and public finances.
This edition covers the canonical GMSI topic Economic Data–Inflation–Energy, which includes oil, gas, electricity and fuel-price inflation, together with their economic and consumer-price pass-through.
The latest observation period is 20–26 July 2026, compared with 13–19 July 2026. The analysis uses:
The ranking is based on weekly change rather than the absolute level of energy inflation sentiment.
Countries are included only when:
Where a numerical fall is not supported by the underlying headline mix, the country is excluded rather than used to fill the ranking mechanically.
In this article, we examine how Brent’s risk premium evolved between June and July 2026. Permutable’s Brent crude sentiment indices show that the market’s pricing of conflict shifted from the probability of escalation to the viability of the routes carrying Gulf crude. The signal turned bullish before Brent repriced, while the mid-July attacks on the corridor used to bypass Iran’s restrictions help explain why the premium may prove slower to unwind.
Brent broke past the $86 mark on 14 July, the prompt market catching up with a divergence that had already been confirmed in the sentiment data. The overnight strikes on ADNOC’s Al Bahyah and Mombasa B inside Omani territorial waters did more than add a fresh war-risk premium. They ended the market’s complacent relief trade by demonstrating what it had been resting on. For the best part of June, traders had treated the Gulf’s deteriorating security as a passing headache; that view has now capitulated.
Our energy market sentiment indices told the true story in real time. Geopolitics & Conflict turned bullish, followed closely by Policy & Regulation, and the two climbed in tandem as blockades, transit levies and state-guided escorts pressed on the same shipping corridor from opposite directions. The price of passage no longer rests on whether the oil exists, but on whether it can move on terms that underwriters, charterers and shipowners will accept.

Caption: Brent sentiment began turning bullish in late June while the crude price remained close to its lows. Geopolitics & Conflict recovered first, followed by Policy & Regulation as blockades, tighter transit conditions and attacks on shipping converged on the same export corridor. Brent repriced only after both themes had moved above their recent baselines.
The chart sets two price-directional Brent sentiment themes against the CO1 daily close: Geopolitics & Conflict and Policy & Regulation. Positive readings are bullish for Brent; negative readings are bearish.
A tanker strike is operationally damaging. For Brent, it is bullish when it raises the probability that internationally traded crude will be delayed, rerouted or withheld from the market.
The spring premium was already leaking away like air from a valve by early June. Brent sat in the mid-$90s and Geopolitics & Conflict stood nearly three standard deviations above its trailing norm, but both drifted lower as cargoes kept moving and the disruption looked manageable. Policy & Regulation barely stirred, leaving the premium concentrated in the immediate risk of another strike rather than a lasting restriction on deliverability.
By late June, that relief trade had run its course. Both sentiment themes had fallen close to the bottom of their recent ranges and Brent had eased towards the mid-$70s.
The next turn appeared first in the information flow. Geopolitics & Conflict recovered, followed by a sharper rise in Policy & Regulation as missile strikes, blockade measures and tighter transit conditions accumulated. Brent remained close to its lows, with the market still treating diplomacy as sufficient to contain the disruption.
For several sessions, Brent sentiment became more bullish while the price remained anchored. The indices did not identify the exact day or size of the eventual move. They showed that the ground beneath a $75 Brent was beginning to give way.
The adjustment came in two jolts rather than a glide. Brent jumped 9.6% on 13 July after Washington announced a renewed blockade, then moved above $86 the following day as attacks on shipping and direct US-Iran escalation forced the market to reassess Gulf export capacity.
The more durable shift sat beneath the price. Geopolitics & Conflict pushed sharply above its baseline, capturing the immediate threat to shipping, while Policy & Regulation climbed with it as blockades, transit arrangements and state-guided passage became part of the same trade.
For the first time in the period, both themes were bullish and moving together.
June’s premium rested mainly on the probability of military escalation, a risk that diplomacy can remove quickly. By July, the premium also reflected the terms on which crude could still move: insurance cover, escorted passage, transit restrictions and the willingness of owners to commit vessels.
The price recorded the adjustment. The sentiment indices showed what it was made of.
The two crude carriers struck in the Strait of Hormuz were not trying to break Iran’s restrictions. They were using the route designed to work around them.
ADNOC’s Al Bahyah and Mombasa B were hit by Iranian cruise missiles in the southern lane inside Omani territorial waters. Both vessels caught fire before the blazes were brought under control.
The ships belonged to the ADNOC fleet used to shuttle Gulf crude for transhipment off the UAE and Oman. ADNOC has been among the most active participants in the US military-led effort to keep the southern corridor operating. CENTCOM said the wider operation had facilitated more than 800 vessel transits and over 400 million barrels of crude through the strait during the previous two months.
By striking there, Iran extended the disruption from the main passage through Hormuz to the system sustaining flows around its restrictions.
Traffic data show how narrow that system has become. Since the 12th July, roughly 14 ships of all types crossing Hormuz, as of the 13th this has fallen to 9 ships. When you compare with close to 130 passing the strait a day before the war, it shows the sheer magnitude of the disruption. Within that total, six visible oil and gas tanker transits were recorded, the lowest visible tanker count since late May.
AIS switch-offs mean the observed figures somewhat understates total traffic volumes, but the fall remains severe. More of the surviving flow now depends on escorted movements determined by Trumps levies policy, controlled routings and transfers outside the Gulf.
The southern lane may remain open in a legal or military sense, but commercial access is decided elsewhere. Owners must be willing to nominate vessels, charterers must absorb the extra cost and underwriters must continue providing cover on workable terms.
A lane can remain open on the map while quietly closing on the chartering desks.
An escalation premium can fade in a handful of sessions on a ceasefire, renewed talks or a pause in attacks. Route risk unwinds through evidence: repeated safe transits, falling war-risk premiums, normal fixture activity and clearer rules around the blockade, Iranian transit demands and US-guided passage.
Keeping the two indices separate becomes useful during that unwind. Geopolitics & Conflict captures the immediate probability of attack. Policy & Regulation tracks the framework governing whether crude can continue moving once the immediate threat recedes.
If the conflict signal turns bearish while policy sentiment remains bullish, the premium has not left the market. It has moved into restrictions on deliverability.
Saudi Arabia’s East-West pipeline to Yanbu and the UAE’s link to Fujairah remain the main operational alternatives to Hormuz, but neither can replace the volume that moved through the strait before the crisis.
They shift regional exposure rather than remove it. Yanbu moves crude towards the Red Sea, where renewed Houthi activity has raised the risk around shipping and infrastructure, while Fujairah remains close to the wider conflict zone.
The Cape of Good Hope answers a different problem. It allows vessels to avoid the Red Sea and Suez Canal, but tankers loading inside the Gulf must still pass through Hormuz before beginning the longer journey south.
Flows can be rerouted. The geography they cross cannot.
The downstream system had little slack before the latest attacks. European diesel margins and US refining cracks were at record levels, while Asian diesel, jet-fuel and fuel-oil margins continued to strengthen.
Hormuz is adding pressure to an existing constraint. Russian export restrictions, limited refinery capacity and depleted product inventories had already reduced the market’s ability to absorb another disruption.
The inventory cushion has thinned as well. Global stocks fell sharply between March and June, while combined US crude and product inventories are at their lowest since 2003. The spring shock was cushioned partly through stock draws. That option remains available, but from a weaker starting point.
Who is sailing will matter as much as how many are moving through. A corridor sustained mainly by escorted or state-supported movements would offer weaker evidence of normalisation than the broad return of commercial tankers and LNG carriers.
Brent sentiment can mark the stages of that unwind. Geopolitics & Conflict turning bearish while Policy & Regulation remains bullish would show the immediate threat receding while restrictions on deliverability lingering. Both indices rolling over together would point to broader normalisation.
Until traffic rebuilds, insurance terms soften and the ordinary business of chartering resumes, route risk will remain in the Brent premium.
A Brent move driven by military escalation does not persist in the same way as one reinforced by blockades, transit restrictions and impaired shipping routes.
Permutable’s Energy Indices separate those drivers within the Brent information flow, helping trading, research and risk teams see what is moving the price, how the signal is changing and what would begin to reverse it.
This article analyses how Brent crude sentiment evolved from geopolitical fear to physical supply disruption between February and May 2026, using Permutable’s driver-level energy sentiment indices to track Brent volatility. It explores how macro, supply, logistics, and market-dynamics narratives shaped repricing beneath the surface of price action. The piece is aimed at commodity traders, macro investors, hedge funds, energy analysts, and institutional research teams.
Over the past three months, the market has moved through a sequence of distinct regime phases: broad weakness, early inflection, repricing, divergence and then a supply-led impulse. Price captured the outcome. The sentiment signal showed how the character of the move was changing beneath the surface.
That capturing what’s driving the regime matters. Oil risk premiums are often treated as a single market variable. They are not. A premium built on escalation headlines can fade quickly when diplomacy. A premium rooted in refinery disruption, shipping stress, transit risk and depleted inventories has a different quality being harder to dismiss due to the physical constraint.
This is where driver-level energy sentiment has its edge. Permutable’s systematic energy indices are built from the raw material of global information flow: news and analysis across 75 languages, drawn from tens of thousands of sources that turn unstructured headlines into a processed, topic-tagged, scored for intensity and direction, then mapped to the drivers that matter for energy markets: macro and geopolitics, physical supply, demand and market dynamics.
The result is a structured sentiment signal uncovering which forces are building beneath price, which are fading, and whether the narrative behind a re-pricing is broadening into something more durable or losing the support that first gave it weight.
For Brent, the important signal was not simply that sentiment became bullish. It was how the source of bullishness changed throughout the last few months and tracking this in real time.
The three-month view below shows Brent moving through a clear sentiment sequence. All major drivers were negative in mid-February. Demand, market dynamics and macro/geopolitics then turned positive before the breakout. Broad sentiment strength preceded the March repricing, before a late-March divergence warned that price was holding a premium with weaker narrative support. By late April, physical supply and market dynamics were driving the second bullish impulse.
![]()
Permutable’s intelligence engine tracks how sentiment regimes evolve across physical supply, demand, macro/geopolitical drivers, and market dynamics -revealing when oil market repricing is driven by broad narrative convergence, divergence, or supply-led confirmation before broader consensus forms.
The three-month move in Brent can be read through five distinct phases. That is the value of driver-level sentiment: not simply showing that the market turned bullish, but showing how the character of the move changed as different forces took control.
All the major drivers sat below zero and Brent remained range-bound.
At this stage, there was no durable premium in the market, only fragmented noise. The signal showed a market still lacking narrative breadth: no clear confirmation from demand, macro/geopolitics, physical supply or market dynamics.
This was the pre-regime phase.
The first turn beneath the surface. US-Iran escalation takes hold.
Demand, market dynamics and macro/geopolitical sentiment began to move higher while Brent was still largely contained. That was the first meaningful shift: the narrative was beginning to broaden before price had fully broken out.
This is where sentiment proved its value. The market had decisively repriced, the information flow had already started to converge around a more bullish oil story.
By March, the signal had moved from early inflection to broad confirmation.
Sentiment strength across multiple drivers preceded Brent’s move from the $70s into the $100+ range. This was the first full repricing phase: the premium was no longer latent in the narrative, it had entered the price.
But the composition still mattered. This was largely a fear-led repricing, driven by macro and geopolitical stress and reinforced by market dynamics. Powerful, yes, but not yet deeply rooted in physical tightness.
That made the premium vulnerable. It depended on fear remaining the dominant driver.
Then came the warning. Peace deal talks enter the conversation.
Sentiment faded while price remained elevated. That divergence was the first sign that the rally’s underlying support was beginning to thin. The market still carried a premium, but the narrative that had built it was losing force.
Price alone suggested resilience. The driver-level signal showed something more fragile: a market whose support was weakening beneath the surface.
This was not a fresh bullish impulse. It was a warning that the first phase of the rally was becoming more exposed to reversal.
The second bullish phase was different in kind.
Physical supply and market-dynamics sentiment became the dominant forces behind the move. Refinery disruption, shipping risk, transit uncertainty and inventory drawdowns moved closer to the centre of the Brent narrative.
This was the point at which Brent stopped trading pure escalation risk and began pricing something more durable: the operational consequences of disruption.
That is the shift to pay attention to. A geopolitical premium can be softened by diplomacy. A supply-led premium, tied to disrupted flows and tighter inventories, is harder to dislodge. This was the moment when the rally changed character: from fear to friction.

Above: Permutable’s driver-level energy sentiment intelligence shows how Brent crude transitioned from geopolitical panic premium toward a broader bearish repricing as macro sentiment, physical supply dynamics, and market structure weakened beneath the surface of price action.
The one-month view shows Brent’s latest bearish turn. Macro and geopolitical sentiment fell sharply as Trump’s Iran talks revived hopes of de-escalation, while market dynamics also rolled over into the sell-off. Physical supply sentiment weakened, but did not collapse, leaving Brent caught between diplomatic relief and unresolved supply fragility.
The latest phase is no longer about building risk premium. It is about how much of that premium survives once the panic starts to unwind.
The one-month signal shows the shift clearly. Macro and geopolitical sentiment, which had carried much of the earlier fear premium, fell sharply as Trump’s Iran negotiations moved to the centre of the market narrative. Brent followed, dropping towards the mid-$100s. That was the pivot. The market stopped adding geopolitical fear and began removing it.
But this is not a clean reset. Physical supply sentiment weakened, but did not fully break. That matters. It suggests traders are no longer paying for maximum escalation, but they are not yet ready to declare the physical premium as over. Diplomacy has removed the panic. It has not removed the friction.
The next signal is whether physical supply sentiment follows macro/geopolitics lower. If it does, Brent becomes more exposed to a deeper unwind. If it holds, the market may struggle to break materially lower, even as the Trump-Iran narrative continues to soften.
A Brent rally led by macro/geopolitics carries one message. A rally led by physical supply carries another. Demand, logistics stress, inventory pressure and market dynamics each point to a different source of pressure inside the oil market.
They also resolve in different ways.
Geopolitical sentiment can turn quickly when diplomacy improves. Physical supply sentiment needs evidence that disruption is easing. Logistics stress needs flows to normalise. Inventory pressure needs stocks to rebuild. Market dynamics can weaken once price momentum breaks.
Price compresses all of that into one number. Driver-level sentiment separates the moving parts.
This highlights the true value of treating sentiment as structured market intelligence. It reveals not just where Brent is moving, but why, identifying which macro driver is currently in control, and whether the underlying trend is gaining cross-market breadth or beginning to thin out.
Brent’s three-month signal has traced a clear sequence: broadly negative, inflection, repricing, divergence, supply-led confirmation. The one-month chart adds the latest phase: premium compression.
Trump’s Iran talks have weakened the macro/geopolitical driver that powered the panic phase. The next question is whether physical supply, logistics and inventory signals now follow lower.
If they do, Brent becomes more exposed to a deeper unwind. If they hold, the market may struggle to surrender the full premium, even as geopolitical fear fades.
Brent’s risk premium became more durable when bullish sentiment shifted from headline escalation to supply-side confirmation. The next test is whether diplomatic relief breaks the physical layer, or simply strips out the panic premium above it.
Understanding whether oil markets are repricing on fear, physical disruption, logistics stress or broader macro transmission requires more than headline monitoring. Permutable’s Energy Indices are designed to help institutional teams identify how narrative drivers evolve beneath price action in real time.
Request a walkthrough to see how our driver-level energy sentiment intelligence helps trading, research, and risk teams track shifting market regimes across crude, refined products, natural gas, power, and broader commodity markets.
In this article, we examine the renewed turn in US inflation Q2, as April’s CPI print challenges the idea that disinflation is still moving comfortably in the right direction. The headline points to re-acceleration, but the composition is more awkward: an energy-led shock has reached the consumer basket while core inflation has also edged higher.
April’s CPI report showed what happens when an energy shock reaches the consumer basket.
Headline CPI rose 3.8% y-o-y, up from 3.3% in March, and increased 0.6% m-o-m. Energy did much of the work. The energy index rose 3.8% m-o-m and accounted for more than 40% of the monthly all-items increase. Gasoline rose 5.4% m-o-m and 28.4% y-o-y. Energy prices overall were 17.9% y-o-y.
The headline says inflation has re-accelerated. The detail says the shock is energy-led.
That does not make the report benign. Energy shocks can fade quickly, but they can also move through transport, utilities, freight, business costs and expectations. Once that happens, the Fed can no longer treat them as a petrol-price inconvenience.
Core inflation was not soft enough to offset the energy story either. Core CPI rose 0.4% m-o-m and 2.8% y-o-y. Shelter rose 0.6% m-o-m. Energy was the spark, but the underlying picture was not calm.
Analysts are not reading April as a classic overheating signal. The stronger view is that the US is facing an energy-led inflation shock at an awkward point in the policy cycle.
Reuters framed the print as a higher-than-expected inflation reading that reinforced expectations of the Fed remaining on hold for longer. Principal Asset Management made the policy risk clear: the Fed can usually look through energy shocks, but further pass-through into core inflation would argue for keeping rates steady through 2026, with the risk that easing slips into 2027.
That is the market point. April does not force a hike. It raises the evidence needed for a cut.
The Fed’s communication has already become more defensive. The labour market outlook looks more resilient, but the inflation outlook has worsened, partly because of the Iran war. The policy debate is no longer simply about when cuts begin. It is now about what would allow the Fed to cut without looking too relaxed on inflation.

CPI confirms the shock after the fact. Sentiment helps show whether the market is starting to organise around it.
That is the value of Permutable’s US inflation sentiment signal. It does not need to forecast every CPI print to be useful. Its role is to show whether inflation is becoming more prominent, persistent and market-relevant in the daily macro narrative.
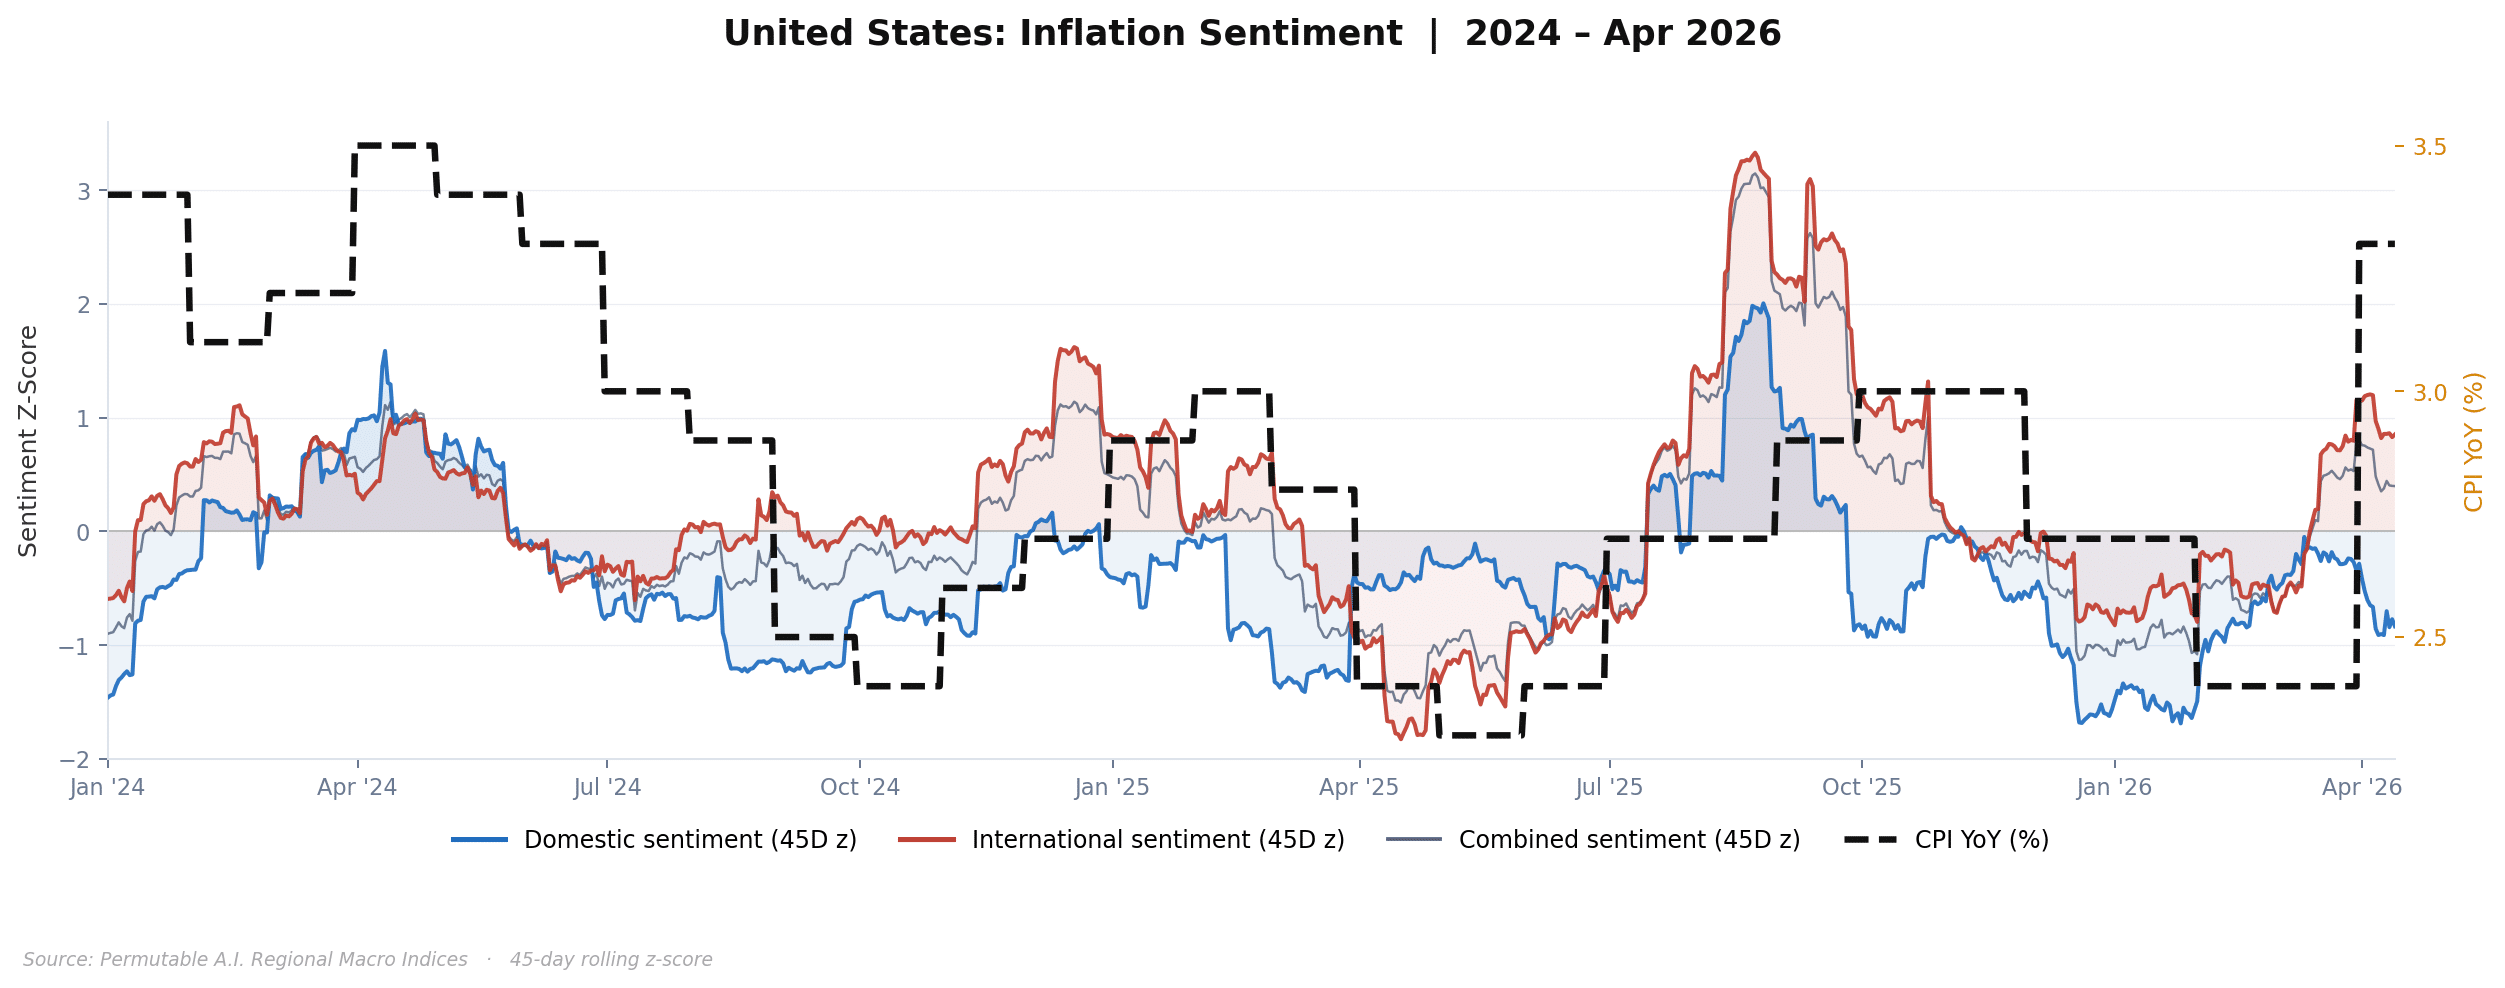
The historic chart gives context. Inflation sentiment tends to rise when inflation pressure becomes a dominant macro theme and fade when disinflation takes hold. It is not a replacement for CPI. It is a way of reading the pressure around CPI between official releases.
Energy inflation does not remain an oil-market story for long.
Higher gasoline prices hit households directly. Higher fuel and power costs raise costs for firms. Higher freight and transport costs feed into margins. Higher headline inflation complicates the Fed’s ability to guide markets towards easier policy.
The loop is straightforward: geopolitical tension lifts energy prices, energy lifts inflation, higher inflation narrows the Fed’s easing path, higher-for-longer rates support the dollar and tighten financial conditions.
What starts as a commodity shock becomes a rates and FX problem.
The producer-price data reinforce the concern. US wholesale inflation rose sharply in April, with energy costs adding pressure on companies and raising the risk of further pass-through to consumers. Producer prices rose 6.0% y-o-y, while PPI rose 1.4% m-o-m, with services, transport, warehousing and trade also contributing to the move.
CPI shows the shock reaching households. PPI suggests it is still moving through the corporate cost base.

The recent chart shows why April matters.
Inflation sentiment has rebuilt as CPI has turned higher again. The point is not that sentiment perfectly predicted the April number. The more useful point is that inflation risk is re-entering the market conversation at the same time as official data are becoming less comfortable.
A single CPI print can be dismissed. A broader resurgence in the inflation narrative is harder to ignore.
The key issue is whether inflation language remains concentrated in energy and gasoline, or broadens into freight, services, margins, wages and policy credibility. The former can fade. The latter would make life harder for the Fed.
If inflation peaks quickly and energy prices fade, the Fed can wait it out.
If the shock lingers, markets have to reassess cuts, front-end yields, the dollar and equity multiples. April does not settle that debate. It raises the stakes of the next few months.
Energy persistence: If gasoline and broader energy costs fade, April can still be treated as a temporary shock. If they hold, the Fed’s room to ease narrows further.
Core pass-through: Services, transport and shelter will decide whether this becomes harder to dismiss.
Fed language: The policy debate is no longer only about when cuts begin. The possibility of a longer hold, or even a renewed hiking discussion, is back in play.
Inflation sentiment does not replace CPI. It changes the timing of the inflation debate.
The historic chart shows the signal has cycle relevance. The recent chart shows why it matters now: inflation language is rebuilding as official CPI turns higher again.
The US is not facing a clean demand-led inflation cycle. It is facing an energy-led cost shock that has reached the consumer basket at a difficult point for policy. For rates, the question is whether this delays the easing path or closes it altogether. For FX, it is whether a more cautious Fed keeps the dollar supported. For equities and credit, it is whether higher input costs and higher rates begin to weigh on margins, valuations and refinancing conditions.
April does not prove inflation is becoming embedded.
It does show that the bar for dismissing it has moved higher.
For institutional access to our US Inflation Sentiment Indices and regional macro indicators, contact us at enquiries@permutable.ai
This case study explores how Permutable’s real-time Brent crude intelligence identified a reversal in ceasefire and de-escalation sentiment before Brent crude sharply repriced geopolitical risk. Designed for hedge funds, commodities traders, and macro research teams, the article examines how narrative intelligence and source-traceable sentiment analysis are reshaping institutional energy trading workflows.
Brent crude’s sharp reversal this week did not begin with price action. It began with a shift in geopolitical narrative momentum that markets started repricing hours before the broader selloff accelerated.
At Permutable, our customised 24-hour Brent crude sentiment tracker identified the first clear reversal in ceasefire-related sentiment before midnight on 5 May, well before crude moved sharply lower during the morning session.
At that stage, peace-deal headlines, Hormuz de-escalation narratives, and weaker disruption-risk signals had already begun clustering across the market. The tracker showed Brent’s read-through shifting away from supply-risk escalation and toward geopolitical risk-premium unwind before the move became fully visible in futures pricing.
By the time the broader repricing appeared on trading screens, narrative conditions inside the market had already changed materially.
Above: Permutable AI’s customised Brent crude sentiment tracker identified a sharp reversal in ceasefire and de-escalation narratives before oil markets rapidly unwound geopolitical risk premia.
Beneath the surface, Permutable’s system identified several important transitions developing simultaneously:
The move that followed reflected a rapid unwind of geopolitical risk premia across oil markets.
Reports of paused US Strait operations, alongside growing optimism around a potential US-Iran agreement, changed how traders assessed near-term supply disruption probabilities. As those narratives strengthened, Brent crude rapidly repriced lower.
At one stage Brent briefly approached the $98 level as markets aggressively reduced exposure linked to escalation risk.
The selloff was not caused by one headline alone. Instead, the move developed through the accumulation of multiple de-escalation signals entering markets simultaneously:
This distinction matters because modern commodities markets increasingly trade on changing probability distributions rather than static fundamentals alone.
That is precisely the reason we have been seeing institutional demand for Permutable’s real-time Brent crude intelligence accelerating across macro hedge funds, systematic, commodity and energy trading desks.
The market is no longer simply reacting to whether supply is tight or loose. It is continuously repricing the probability of future disruption scenarios. In this case, the system isolated the dominant driver clearly. This was not generic oil-news weakness. It was a ceasefire-driven repricing of geopolitical risk.
One of the more important aspects of this week’s move is that the underlying physical backdrop remained relatively supportive throughout the selloff.
Large inventory draws, constrained supply conditions, and persistent structural tightness continue to sit underneath the market. Under different geopolitical conditions, those factors could easily have pushed crude higher.
But markets temporarily prioritised diplomatic momentum over physical scarcity. That divergence highlights how oil markets increasingly behave during periods of geopolitical volatility. In practice, sentiment can overpower fundamentals in the short term, particularly when positioning becomes heavily concentrated around a single macro narrative.
Many conventional commodities research workflows still rely heavily on static news monitoring, delayed analyst interpretation, or document-level sentiment scoring. The problem is that narrative transitions rarely happen cleanly.
They emerge gradually through thousands of interconnected signals before becoming consensus positioning. By the time the narrative appears obvious through price action alone, a large portion of the move may already be complete.
During this Brent reversal, sentiment progressively rotated away from:
toward:
The reversal itself began before midnight, long before ceasefire optimism became the dominant market narrative during the following trading session.
In our view, this is one reason first-generation sentiment systems increasingly struggle during periods of geopolitical stress. Many remain overly dependent on isolated document scoring and fail to capture how narratives evolve collectively across markets.
This case study reflects a broader structural shift taking place across commodities and macro trading.
We are already seeing institutional investors are moving beyond simple positive or negative sentiment classification toward systems of the kind we have built here at Permutable capable of modelling:
The distinction is important.
Modern commodities markets increasingly move in stages:
For systematic trading teams, the challenge is identifying those narrative transitions before they become consensus market positioning.
That requires more than headline ingestion. It requires infrastructure capable of understanding how narratives spread across entities, regions, policy developments, and macro assets simultaneously. At Permutable, our real-time Brent crude intelligence is increasingly becoming part of that workflow.
The recent Brent reversal is a useful reminder that oil markets increasingly function as geopolitical probability markets layered on top of physical supply dynamics. Inventory data still matters. Supply discipline still matters. Physical tightness still matters.
But short-term price discovery is increasingly dominated by how quickly markets reassess future geopolitical outcomes. That reassessment process now happens at machine speed.
For macro systematic funds, commodities trading desks, and cross-asset research teams, the ability to monitor narrative momentum in real time is becoming increasingly important for:
The firms likely to adapt fastest are not necessarily those consuming the most headlines. They are more likely to be those capable of identifying narrative inflection points before those shifts fully propagate through markets.
For Brent crude specifically, the shift was unusually clear:
At Permutable, we provide source-traceable narrative intelligence and real-time sentiment infrastructure for institutional trading and research workflows across commodities, macro, FX, rates, and digital assets.
Our platform supports:
Our custom real-time Brent crude intelligence sentiment trackers allow trading teams to monitor the narratives that matter to their book, configure targeted alerts, and identify when market-moving themes begin to turn in real time.
To request a walkthrough of our real-time Brent crude intelligence or discuss trial access, contact the team at enquiries@permutable.ai.
This article examines the aluminium and copper outlook 2026 as elevated oil prices, Gulf logistics disruption and China’s manufacturing cycle are now cutting through the base metals complex, but the pressure points are not the same.
Copper remains caught between structural scarcity and demand confirmation. Aluminium is more directly exposed to energy costs, input availability and shipping disruption.
Using Permutable’s industrial metals intelligence across supply, demand, geopolitical risk, macro conditions and price discovery, we separate the headline move from the underlying driver, showing where stress is building, where conviction is justified, and where the market may be misreading the signal.
Copper still has the stronger long-term scarcity case. Mine supply growth is slow, concentrate tightness persists, smelting constraints remain important, and electrification, grids, EVs, data centres and AI infrastructure continue to support the structural thesis.
But copper is also an industrial barometer. It responds to factories, Chinese procurement, construction cycles and manufacturer margins. Higher oil therefore matters not only because it raises transport costs, but because it raises the cost of using copper.
Aluminium is more directly exposed. Power costs, alumina flows, carbon inputs and Gulf shipping lanes are part of the production system. For aluminium, the oil shock is not just a macro risk. It is an operating risk.
That is the asymmetry. The same oil shock can challenge copper’s demand premium while reinforcing aluminium’s cost floor. The useful signal is sequencing: which channel moved first, which confirmed, and which is still holding.
The copper bull case is intact. The near-term proof is less secure. Copper still has the strongest long-cycle story in base metals. New mine supply is difficult, concentrate availability remains tight and the energy transition continues to absorb more copper into grids, EVs, renewables, data centres and industrial electrification.
But long-term scarcity does not remove near-term cyclical risk. Copper can be structurally tight and still soften if higher energy costs, weaker manufacturing margins and slower Chinese demand weigh on procurement.

The chart shows where the first impulse came from. Copper was not initially moving on a clean demand story. It was being lifted by a broader macro and geopolitical risk premium. That is useful, but not enough. A geopolitical premium can lift copper. Demand has to defend it.
The key copper signal is industrial and infrastructure demand. Demand sentiment weakened in early March, recovered later in the month, and then rose sharply into mid-April as copper pushed higher. Demand was not the first mover. It was the confirmation channel.

China is central to that test. March manufacturing PMI returned to expansion at 50.4, with production at 51.4 and new orders at 51.6. That gives copper some support. But export orders remained below 50, supplier delivery times were stretched and raw-material purchase prices surged to 63.9.
China is helping copper, but not cleanly. It is supporting demand inside a more expensive industrial system. If manufacturers can pass costs forward, demand can hold. If they cannot, the pressure moves into margins, inventory discipline and weaker procurement.
Copper supply risk is present, but it is less direct than aluminium’s. The supply and logistics signal was choppier than the geopolitical line, but the mid-April lift mattered. It arrived as copper was already recovering, adding physical credibility to a move that began with macro risk.
Visible inventories complicate the story. Global exchange stocks above 1.4 million tonnes at the end of March challenged the near-term shortage narrative, even as the longer-term structural case remained intact. The market can believe in electrification and still punish weak manufacturing data.
There is also a quieter supply risk beneath the electrification story: sulphuric acid. Acid is not ancillary to leached copper output. It is part of the production process. Sulphur is extracted inside the oil and gas system. Sulphuric acid is produced from it and used in copper leaching through solvent extraction and electrowinning. Nearly 15% of global copper production depends directly on acid-based leaching.
Oil and Middle East disruption can alter sulphur economics and transport. If acid availability tightens, leached copper output becomes vulnerable, even if the electrification thesis remains intact.
China controls roughly 40% of global sulphuric acid output and has moved to restrict exports from May to protect domestic fertiliser supply owing to spillover effects of the US Iran conflict. Shipments to Chile reportedly dropped to zero in March, compared with more than 150,000 tonnes in the same month last year. Chile is the world’s largest copper producer. The Democratic Republic of Congo faces similar exposure through thin acid inventories and process dependency.
Copper does not need its structural thesis to fail for prices to soften. It only needs the near-term demand premium to look too expensive relative to current order books.
Copper is still debating the balance between future scarcity and near-term demand. Aluminium is dealing with a more immediate constraint. Its exposure to a Gulf logistics shock is direct, physical and visible. The question is not whether demand holds. It is whether the shock is arriving through cost, supply or availability. The answer is all three.

This was not a generic base-metals rally. Aluminium was repriced because the market began to worry about a region that produces, powers and ships a meaningful share of global seaborne supply.
The more important aluminium signal is supply disruption and logistics sentiment. It surged into the same window as the price breakout, then cooled while price remained firm. That is the key detail: aluminium did not fully give back the move once the first logistics impulse fade. The market retained an availability premium.
That is how physical markets often behave. The headline moves first. Procurement behaviour changes next. Buyers become defensive, regional premiums rise and traders stop asking only where the LME price is. They start asking where metal can be sourced, financed, shipped and delivered.
The Gulf accounts for roughly 10% of global aluminium production and a larger share of seaborne exports outside China. But Hormuz is not just an exit point for finished metal. It is a two-way industrial corridor.
Bauxite must become alumina. Alumina must reach the smelter. Carbon anodes must be produced and delivered. Power must remain reliable and affordable. Finished aluminium then has to move from smelter to consumer. Hormuz touches several of those links at once.
In April, LME aluminium hit a four-year high and the cash market moved into premium as the supply chain repriced. Physical premiums tightened across Rotterdam, the Midwest and Japan. Gulf deliveries were hindered, some volumes were effectively trapped in the region, and smelters began rerouting metal overland to ports outside Hormuz.
This is why aluminium has developed an availability premium above the LME price. The market is not only pricing demand. It is pricing confidence that metal can be produced, financed, shipped and delivered through a stressed logistics system. Diplomatic talks do not repair that overnight.
Secondary aluminium producers in key markets have faced disruption to scrap flows from the Middle East, a major source of recycled feedstock. Scrap prices have risen sharply and some producers have cut operating rates. Recycled aluminium feeds autos, construction, packaging and consumer goods. The route from freight disruption to factory utilisation and end-product prices is already in motion.
If copper is mainly asking whether growth can support the price, aluminium is asking whether the supply chain can keep operating.
Copper
If demand sentiment catches up with price, the rally is better supported. If it rolls over while geopolitical risk stays elevated, the premium becomes vulnerable.
Aluminium
If supply and logistics sentiment reaccelerates while price remains firm, the market is pricing a deeper operational constraint, not just a news cycle.
This is where geopolitical disruption stops being a market event and starts changing how the market operates. An event moves prices quickly. The behavioural shift that follows is slower and steers the course for the outlook. Buyers stop treating supply stress as noise. Procurement teams rebuild inventories defensively. Smelters focus on operating continuity over price optimisation. Downstream fabricators protect supply before protecting margin.
When that shift takes hold, the market stops pricing only the event and starts pricing the physical system behind it.
The shock is the same. The transmission is not.
Copper is asking whether demand can defend the scarcity premium. Aluminium is asking whether the supply chain can keep operating smoothly enough to remove the availability premium.
Knowing which channel has taken hold is the edge.
For commodity desks, macro investors and systematic teams, the challenge is no longer simply tracking whether metals are rising or falling on geopolitics. It is identifying which part of the market is doing the work: physical tightness, demand resilience, logistics stress or macro deterioration.
Tracking supply, demand and macro themes separately helps teams manage and mitigate risk. It provides the ability to distinguish concentrate tightness from demand weakness, and smelter disruption from diplomatic noise.
In a market where the same oil shock can test copper’s demand premium while reinforcing aluminium’s cost floor, gaining greater clarity on real time driver attribution is the edge.
For institutional access to metals sentiment intelligence, data feeds and API, contact enquiries@permutable.ai
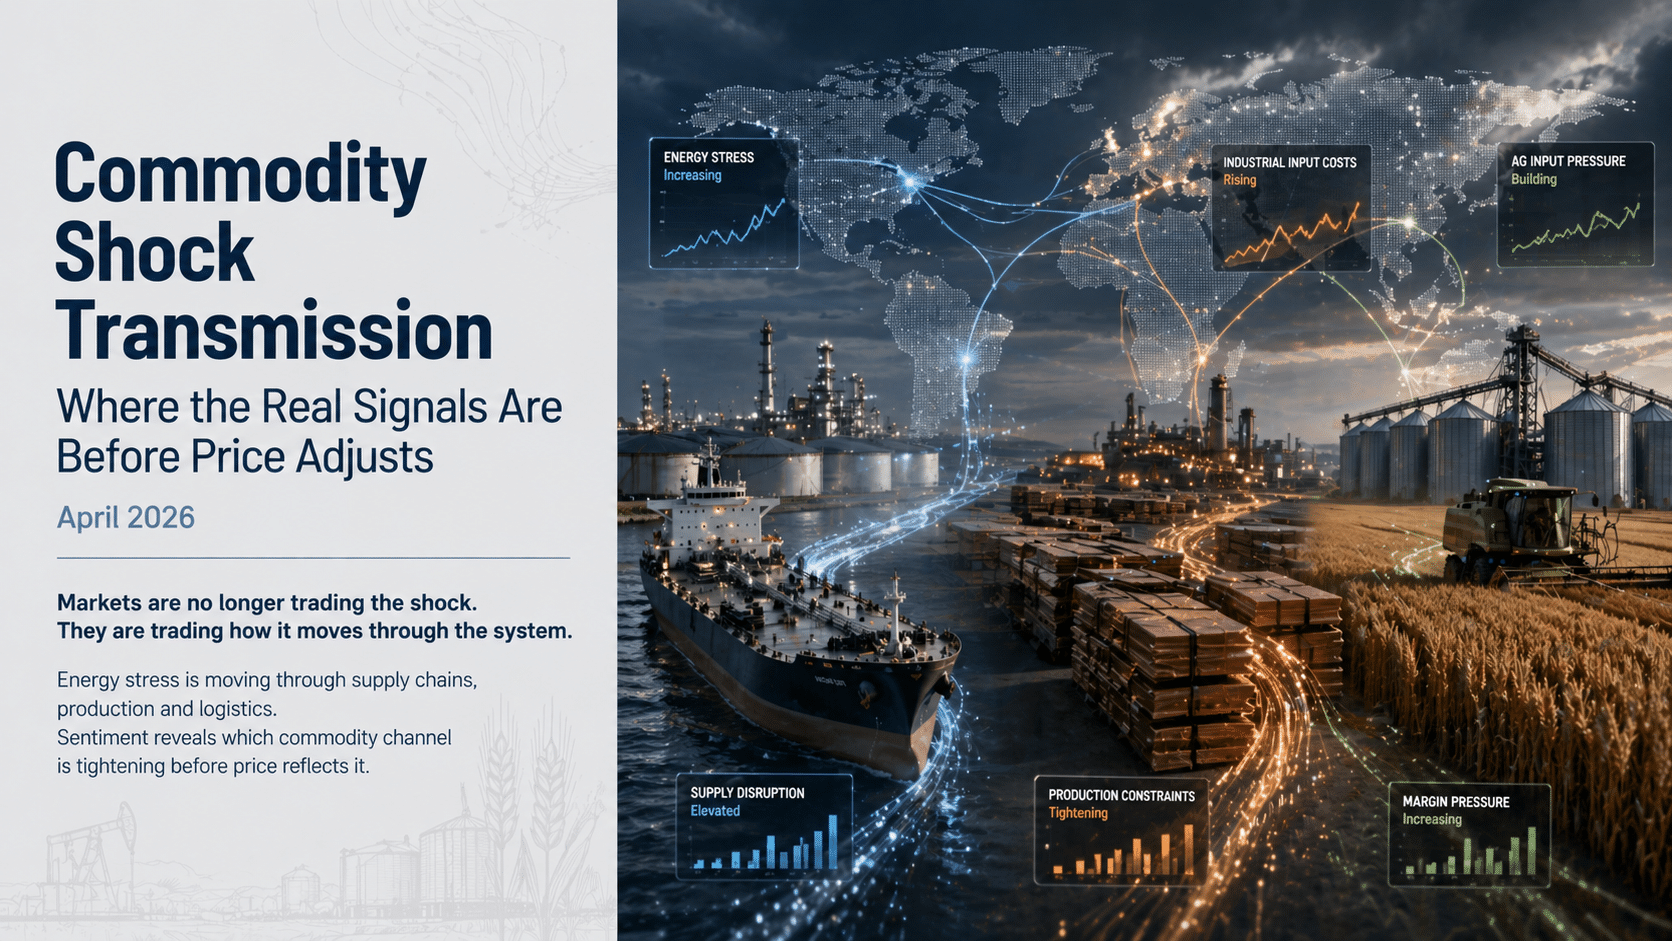
This article explains how commodity shocks transmit across markets and how Permutable’s real-time sentiment signals reveal these shifts before they appear in price. It is aimed at institutional investors, hedge funds and trading desks seeking to identify early drivers of commodity and macro movements, improve signal detection and integrate narrative-based intelligence into discretionary and systematic workflows.
In commodity markets, the initial shock is rarely the full story. What matters is how that shock moves through the system. Oil prices above $110, disruption in key shipping routes and fractures within OPEC are the visible triggers. But for institutional investors, the real signal lies in how these events transmit into metals, agriculture and broader cost structures.
This process is not uniform. It is layered, nonlinear and often misread when relying solely on price or traditional data.
At Permutable AI, our real-time sentiment intelligence is designed to track this transmission as it unfolds, capturing how narratives evolve across supply, demand, macro conditions and logistics before those changes are fully reflected in markets.
Commodity shock transmission refers to the way a primary market disruption, such as an energy price spike, propagates through interconnected markets via input costs, production dynamics and supply chains.
An oil shock does not remain confined to oil.
It feeds into:
As these pressures move through the system, different markets respond in different ways. Some absorb the shock through demand adjustments. Others through supply constraints or margin compression. Understanding this distinction is key. It determines not only where risk is building, but how and when it is likely to appear in price.
Traditional data sources tend to lag these shifts. By the time changes are visible in price, inventory or macro releases, a significant portion of the move may already be priced in. This is where sentiment becomes valuable.
At Permutable, our models analyse over 250,000 global sources and millions of narratives to detect how market perception is evolving in real time. Rather than focusing on keywords alone, the system captures how themes such as supply disruption, demand resilience or logistics stress are gaining or losing traction across markets.
This provides an early-read layer that sits between raw information and price action. In practice, it allows institutional teams to identify which drivers are becoming dominant before those dynamics are fully expressed in markets.
To make this process actionable, we break commodity shock transmission into three core channels:
This occurs when rising costs begin to influence end-user behaviour. Copper is a clear example. The long-term structural drivers, including electrification and grid expansion, remain intact. However, higher energy prices increase the cost of using copper, not just producing it.
Freight, power and financing costs rise simultaneously. Industrial buyers become more selective. The question becomes whether demand can absorb these pressures without weakening.
In other markets, the constraint appears on the production side. For example, aluminium is currently exhibiting this dynamic. Power, alumina and logistics costs are tightening together, shifting the market from price discovery to physical availability.
Disruption in scrap flows and rising input costs are already forcing some producers to reduce output. In this regime, the key variable is not demand, but whether supply can be maintained under tighter operating conditions.
Agricultural markets often sit in a third category, where the primary impact is on margins. Input costs such as fertiliser, fuel and transportation rise, while crop prices adjust more slowly. This creates a structural imbalance for producers.
Over time, this imbalance feeds back into supply decisions, but the initial signal appears as pressure on profitability rather than immediate changes in output.
Permutable’s recent sentiment data highlights a clear concentration of supply-side risk across agricultural markets. Signals are clustering around production constraints, logistics pressure and energy-linked inputs. The move is not broad based. It is directional and increasingly coherent. The underlying issue is margin compression.
Input costs remain elevated and priced for disruption, while crop returns have not adjusted sufficiently to offset those pressures. This creates a “scissor” effect, where producer economics deteriorate despite stable or rising prices.
From a market perspective, this is significant because it often precedes more visible supply adjustments. Here, Permutable’s sentiment intelligence allows this process to be tracked in real time, identifying where stress is building before it is fully reflected in price.
Above: Permutable AI’s Agriculture sentiment heat map showing supply-side drivers across key commodities, with bullish signals clustering around production risk, logistics disruption and energy-linked inputs. The concentration of green across production and supply chain factors highlights a developing margin squeeze, where input costs remain elevated while crop returns lag, signalling early-stage supply stress before full price adjustment.
Above: Permutable AI’s copper geopolitical and macro sentiment versus price, illustrating how sentiment has strengthened ahead of the recent price move. The divergence reflects a market increasingly driven by demand resilience and geopolitical risk premium, with sentiment capturing the shift in narrative before it becomes fully embedded in price action.
Aluminium, by contrast, is increasingly defined by supply constraints. Rising power and input costs are tightening production capacity, shifting the focus toward availability rather than pricing.
Above: Permutable AI’s aluminium geopolitical and macro sentiment versus price, highlighting a sharp spike in sentiment aligned with tightening production conditions. Unlike copper, the signal reflects supply-side constraint, where rising energy, input and logistics pressures are shifting the market from price discovery to availability, with sentiment identifying the tightening regime ahead of sustained price impact.
This distinction is important. Markets rarely move in a uniform way. Identifying whether a commodity is trading demand, supply or cost dynamics is essential to understanding where the next move is likely to emerge.
In modern commodity markets, the gap between narrative and price has become a key source of alpha. Markets do not wait for confirmation. They move as expectations shift.
Sentiment captures that shift at the point where narratives begin to consolidate. This provides a forward-looking signal that complements traditional data rather than replacing it.
For discretionary teams, this improves clarity around what is actually driving the market. For systematic strategies, it introduces a new layer of structured inputs that can enhance regime detection, timing and risk calibration. The objective here is not to react faster. It is to see earlier.
Permutable’s commodity signal layer translates real-time narrative flow into structured indicators that can be integrated into both discretionary and systematic workflows.
These signals can be used to:
Because the data is structured and consistent, it can be incorporated directly into research, backtesting and live trading environments.
Commodity markets are no longer trading isolated events. They are trading how those events move through the system. Consequently, the initial shock sets the direction, but the transmission determines the outcome.
For institutional investors, the edge lies in identifying that process early, when narratives are forming and before price fully adjusts. This is where Permutable’s real-time sentiment signals provide a meaningful advantage.
Explore Permutable’s real-time commodity and industrial metals sentiment intelligence, designed for institutional workflows. Request access: enquiries@permutable.ai
Commodity shock transmission describes how a primary market disruption, such as an energy price spike, spreads across related markets including metals and agriculture through supply chains, input costs and logistics.
Real-time sentiment signals capture how market narratives are evolving across supply, demand and macro conditions before those changes are fully reflected in price. This allows institutional investors to identify emerging trends earlier than traditional data sources.
Oil influences commodities through input costs such as energy, fertiliser and transport. As these costs rise, they affect production decisions, supply availability and demand behaviour across metals and agricultural markets.
Demand transmission occurs when rising costs affect consumption behaviour, supply transmission when production becomes constrained, and cost transmission when input pressures impact margins before output adjusts.
Permutable AI analyses over 250,000 global sources and millions of narratives to detect shifts in sentiment across macro and fundamental drivers, transforming unstructured data into structured, model-ready signals
Yes. Sentiment signals can be integrated into systematic strategies as regime indicators, feature inputs or cross-asset signals, helping improve timing, risk calibration and model performance.
Permutable tracks sentiment across 25+ economic indicators for over 50 countries, including inflation, interest rates, employment and geopolitical risk, using local and international sources in multiple languages
Markets react to expectations before confirmed data. Sentiment captures these expectations as they form, allowing investors to identify shifts in market direction before they are fully reflected in price action.
This article examines how Permutable’s Regional Macro Indices captured the return of energy inflation risk in the Philippines, and how that shift is now reshaping the country’s macro outlook. The central argument is straightforward: the Bangko Sentral ng Pilipinas is being forced into a narrower and less forgiving policy choice between inflation control, currency stability and growth support. For investors and policymakers alike, the wider significance is that narrative data can often detect regime change before it appears in the official numbers.
The BSP has returned to tightening, raising its target reverse repurchase rate by 25 basis points to 4.50%, while lifting the overnight deposit and lending facility rates to 4.00% and 5.00% respectively. The move marks a decisive break from the easing bias that still framed policy earlier this year, and is a reminder of how quickly conditions can revert when an external energy inflation shock meets currency pressure and limited room for manoeuvre.
The bank’s message was plain. The inflation outlook has worsened, underlying pressures are broadening, and early action is required to preserve price stability. This is no longer fine calibration at the margins. It is defensive policymaking in a harsher environment, where imported inflation is rising, the peso remains exposed, and growth momentum is fading.
This is the trilemma now confronting the BSP: contain inflation, support the currency, and avoid tightening into weaker growth. The latest move should be read not as routine adjustment, but as recognition that policy space has narrowed sharply.
The BSP may yet prove less an outlier than an early warning. The immediate lesson is domestic: imported energy pressure, currency fragility and softer demand have already pushed policy from easing bias towards defensive tightening. The broader risk, however, lies in persistence. A short disruption may add only modestly to headline and core inflation. A longer shock could keep energy prices elevated, push headline inflation nearer a percentage point higher, and begin to seep into core prices.
In that setting, central banks that only recently moved from easing to pause may find themselves weighing rate rises into weakening activity. What looks today like a policy trilemma in Manila could, if the shock endures, become a policy trap for larger economies as well.
Permutable’s Regional Macro Indices track the tone and intensity of macro-relevant coverage across economies and themes. They are not designed to mirror official releases in real time. Their value lies in identifying when the narrative backdrop is shifting before that turn is visible in conventional data.
That matters in the Philippines, where the macro story is no longer moving through a single channel. Inflation pressure has re-emerged, the external conflict shock is feeding domestic costs, the peso remains vulnerable, rates have repriced higher, and the growth narrative has softened. Across the chart pack, those pressures appear in the narrative first and in the hard data later.
The inflation data gave the BSP a strong basis for acting. Headline inflation rose to 4.1% in March from 2.4% in February, moving above both the BSP’s 2% to 4% target band and its own March forecast range. Average inflation for the first quarter still came in at 2.8%, but the monthly acceleration was sharp enough to alter the policy tone. Core inflation also rose, to 3.2% from 2.9%, suggesting that the pressure is no longer confined to the initial fuel shock. The burden is also becoming more visible at the household level, with inflation for the bottom 30% of households accelerating to 4.2% in March.
Permutable’s inflation sentiment index captures this shift in narrative. It moved out of the deeply negative territory seen in mid-2025 and into clearly positive ground by the first quarter of 2026. In that sense, the narrative around price stability had already deteriorated before the March CPI print broke above target. The official data did not initiate the story. It confirmed a change that was already visible in the discourse. When inflation coverage becomes consistently more alarmed, it may point to a broader change in regime rather than a one-off disturbance.
The March inflation breakdown helps explain why the pass-through matters. PSA data show that the acceleration was broad rather than isolated, with transport, housing and utilities, and food all contributing. Transport inflation rose 9.9% year on year. The housing, water, electricity, gas and other fuels category increased 4.5%. Food inflation also picked up as rice prices turned higher. Higher domestic petroleum prices have lifted transport and logistics costs, electricity charges have risen, and fuel costs are now feeding into the food chain through farmgate, post-harvest and distribution channels.
Domestic conflict coverage in the Philippines is therefore not simply a proxy for geopolitical anxiety abroad. It also reflects a domestic lens on energy exposure, shipping disruption, logistics strain and remittance corridor risk. That narrative intensified sharply through late February and into March. The transmission into hard data then followed quickly rather than gradually. Transport CPI, which had been quite through January and February, rose to 9.9% YoY in March. The sentiment signal did not provide a forecast of the precise number, but it did highlight the direction of risk and the likely transmission channel before the official release made the pass-through visible.
This is also an FX story. For the Philippines, tighter policy is not only about the inflation forecast. It is also about limiting the extent to which peso weakness adds to imported price pressures. March’s balance of payments deficit widened to US$2.6 billion, taking the cumulative first-quarter deficit to US$5.3 billion. Gross international reserves fell to US$106.6 billion at end-March. That still represents a meaningful external buffer, covering 7.0 months of imports and around 3.9 times short-term external debt on a residual maturity basis, but it still points to a somewhat softer external picture than the BSP would ideally face during an oil shock.
The peso remains an important part of that transmission chain. A rate increase may help limit near-term downside pressure, but it does not remove the underlying vulnerability of an economy heavily exposed to Middle Eastern oil and to external financing conditions. A negative monetary policy sentiment score should not be read simply as a signal of easier policy expectations.
In this context, it points more to a policy narrative marked by concern, constraint and limited room for manoeuvre. Negative sentiment here suggests constrained optionality rather than accommodation. Read that way, the chart alongside USD/PHP reflects the strain created by a more difficult policy mix in which the BSP is trying to contain inflation risks, defend credibility and lean against imported price pressure at the same time.
Permutable’s interest rate sentiment shows the relationship to the 10yr yield variable it is plotted against. When negative commentary around BSP policy becomes more sustained, the bond market has tended to reprice within days rather than weeks.
That is the pattern visible through the first quarter of 2026. By the time the BSP delivered its 25 basis point hike, the hawkish narrative was already established and the 10yr yield had already moved higher. A yield around 6.62% does not appear consistent with a market assuming that inflation pressures will fade quickly. Rather, it appears consistent with a market that sees the central bank as having to respond defensively to a backdrop it does not fully control.
The broader context complicates the policy calculus further. Fitch affirmed the Philippines’ BBB rating but revised the outlook to negative, reflecting the economy’s exposure to the global energy shock and the drag from scandals disrupted public investment. Growth is still expected to hold up better than in some peer economies, but the medium-term outlook is softer, with 2026 GDP growth seen below the government’s 5% to 6% target range. The BSP is therefore tightening into a weaker growth backdrop, not because it is seeking to suppress demand for its own sake, but because the risk of allowing an oil shock to feed through into core inflation, food prices and the exchange rate has increased.
That softer backdrop is also visible in the GDP sentiment chart. The index is not collapsing, but neither is it offering much reassurance. A reading close to neutral during a tightening phase is rarely an entirely benign signal. Neutral growth sentiment suggests that the market narrative has become less willing to reinforce the official growth story. It has not turned clearly pessimistic, but it has become less supportive. That distinction matters. The growth narrative has lost conviction, not collapsed. Even so, that alone is enough to make the policy mix more difficult if inflation and FX pressures continue to build.
A further complication is the broader dollar environment. Safe-haven demand has supported the dollar again as tensions around Iran and the Strait of Hormuz persist, while discussion around swap lines and dollar funding conditions has added another layer of pressure for oil-importing economies trying to stabilise their currencies. That does not alter the BSP’s domestic mandate, but it does make the external setting less forgiving and narrows the room between inflation management and growth support that the central bank would ideally want to preserve.
Taken together, this looks less like a routine 25 basis point hike and more like a defensive move aimed at limiting risks across several fronts at once: inflation expectations, peso stability and second-round effects. The BSP is no longer simply fine-tuning policy. It is responding to the risk that an external oil shock could become a broader domestic inflation and FX problem.
That is also the core message of the charts. These indices are not mechanical forecasting tools. They show when the narrative around a macro theme has shifted before the official data fully reflects it.
In the Philippines, the signals are starting to line up:
The official data is now moving in the same direction, but with months lag.
For investors and macro teams looking to track sentiment can give you an insight into evolving policy risk, inflation dynamics and cross-asset transmission in real time, Permutable’s macro sentiment offers a structured view of how narratives are shifting across markets. For access or further information, contact enquiries@permutable.ai
This article explores how US inflation is being driven by rising oil prices and geopolitical risk, particularly around the Strait of Hormuz, which has reintroduced energy-led price pressure. Macro sentiment data from Permutable AI shows these risks were reflected in market narratives before appearing in official CPI data, signalling a potential shift in the inflation regime and limiting the Federal Reserve’s ability to ease policy.
There is a particular kind of market discomfort that does not begin with panic, but with recognition. It is the moment investors realise the path they had priced is no longer the one in front of them. That is where the U.S. inflation outlook stands in April 2026.
The market had settled into a comfortable pattern. Inflation was easing, the soft landing remained intact, and the Fed had already begun its easing cycle in late 2024. Further easing was still assumed to be the path of least resistance.
Then the geopolitical shockwave flipped the script.
Escalation in the Gulf and renewed disruption risk around the Strait of Hormuz pushed crude sharply higher, returning energy to the centre of the U.S. inflation outlook. Markets did not need a full interruption to flows, yet that is exactly what happened. The threat to shipping routes and the energy complex alone was enough to challenge the assumption of a smooth disinflation path.
March CPI provided the first hard confirmation of this. Headline inflation rose 0.9% m/m and 3.3% y/y, up from 2.4% previously. The energy index rose 10.9% in March, while gasoline surged 21.2%, accounting for much of the monthly increase.
This was more than an upside print. It hinted at a change in regime. An outlook built on easing price pressure and gradual policy loosening now faces a more systemic risk: energy-led inflation proving stickier than expected, forcing markets to revisit the path of rates.
Energy now sits at the centre of the inflation basket. Strip out volatile energy components and core CPI remains comparatively composed at 2.6% y/y, modestly below expectations.
But calm in the core basket offers limited reassurance. Energy shocks rarely stop at the petrol pump. They pass through freight costs, input margins and pricing decisions with a lag. April’s release will matter less for the headline than for signs that second-round effects are beginning to emerge.
None of this is mysterious. The geopolitical rupture pulled the trigger; the macro channels are now carrying the force of it. Renewed disruption risk around the Strait of Hormuz, the world’s most important energy corridor, has reintroduced a scarcity premium into oil. Brent has traded in the low-$100s in recent sessions, materially above pre-shock levels.
Weekend talks failed. Maritime pressure on Iranian shipping has intensified. Markets are no longer pricing a short-lived event risk. They are beginning to price duration.
Rising oil prices linked to geopolitical disruption are reintroducing inflation pressure, with energy acting as a transmission channel into broader costs and increasing the risk of more persistent inflation.
What Does Rising Inflation Mean For the Federal Reserve Outlook?
That leaves the Federal Reserve in an awkward position. Rates remain at 3.5% to 3.75% for a second consecutive meeting. Officials still signal limited easing over time, but confidence around that path has thinned materially.
Recent commentary has shown a Committee more concerned by upside inflation risk than downside labour-market weakness. Markets have noticed. Futures imply only a modest probability of cuts this year, while the 10-year Treasury yield has moved back towards the 4.35% area.
The market is no longer asking when cuts begin again. It is asking whether the easing cycle has already delivered most of what it can.
Elevated inflation risk is reducing the Federal Reserve’s flexibility, with markets increasingly questioning whether further rate cuts are achievable in the current environment.
Why Does Macro Sentiment Matter for Inflation and Fed Policy?
The relevant question is no longer whether U.S. inflation has turned higher. It has. The more important question is whether this is a transient geopolitical shock that mean-reverts, or the early stage of a more persistent inflation regime with consequences for rates, FX and cross-asset positioning.
Official data will settle the question in time. Market sentiment moves faster.
That is where Permutable’s sentiment data earns its place in the process. For macro PMs, it offers a live read on how narratives are feeding through inflation expectations, policy pricing and positioning before those shifts are fully reflected in the data. For systematic investors, it can function as an additional regime signal, helping distinguish short-lived noise from changes in the underlying macro backdrop.
Used properly, sentiment is not a substitute for hard data. It is an earlier signal of information.
Macro sentiment provides an earlier signal of inflation and policy shifts than official data, allowing investors to identify changes in market expectations before they are reflected in CPI or central bank decisions.
If the past two years offer a clear lesson, it is that inflation rarely turns first in the official data. It tends to turn first in the narrative around it. Markets adjust to that shift long before the statistics catch up.
For much of 2024, domestic and international inflation sentiment traded around neutral to negative levels. The prevailing regime was one of orderly disinflation. Goods prices had normalised, supply constraints had eased, and investors had grown comfortable with the view that the next meaningful move in policy would be lower rates rather than renewed price pressure.
That confidence began to erode in spring 2025.
Headline CPI, then near 2.5%, subsequently moved back towards 4%. Permutable’s sentiment data did not merely anticipate the move. It identified the change in regime before the official releases validated it.
Late 2025 brought a temporary unwind as the first inflation pulse moved through the data and commodity pressures eased. Yet by early 2026, both domestic and international series had begun to recover from deeply negative readings, rising together as inflation concerns quietly re-emerged.
The combined signal is particularly telling.
This time the catalyst was different. Gulf escalation, shipping disruption and a renewed surge in crude prices replaced tariffs as the immediate transmission channel.
March CPI at 3.3% confirmed that turn.
At the right-hand edge of the chart, both measures remain positive. The international series, notably, has shown little sign of retreat since the March release.
The earlier pattern has not disappeared. It has reasserted itself.
Inflation sentiment consistently turned ahead of official CPI data, demonstrating that shifts in market narratives can signal regime changes before they appear in traditional economic indicators.
If Permutable’s inflation sentiment captured the return of price pressure, rate sentiment captured the market’s growing discomfort with the easing cycle that preceded it.
During the first half of 2024, domestic rate sentiment moved firmly positive while the Fed held policy at restrictive settings. Cuts were not simply expected; they had become embedded in the market’s central case.
The international series was more restrained. In retrospect, that divergence mattered. Domestic commentary leaned into the soft-landing narrative, while external investors remained more sensitive to geopolitical risk, commodity volatility and the possibility that U.S. inflation would prove less cooperative than consensus assumed.
The easing cycle began in late 2024, taking rates from 5.5% towards today’s 3.5% to 3.75% range. Soon after, both sentiment measures deteriorated sharply.
This was not frustration over the pace of cuts. It was a deeper reassessment that policy may have turned easier before the inflation process had been fully contained.
By late summer 2025, rate sentiment reached its weakest point of the cycle just as inflation was beginning to re-accelerate in the hard data. Tariff pressures, firmer goods prices and a renewed bid in energy were already testing the benign macro narrative.
Once again, sentiment moved ahead of confirmation.
The rebound into early 2026 was measured rather than convincing. Both series returned to mildly positive territory as markets adjusted to a Fed on hold. That recovery is now losing traction.
The combined rate signal tells a similar story. As domestic optimism around cuts faded and international caution persisted, the grey series rolled over decisively. That shift suggested doubts over the easing path had become more broadly embedded, rather than confined to one market perspective.
Treasury yields have moved higher again. The FOMC has adopted a more balanced, less explicitly dovish stance. Markets are no longer focused solely on the timing of the next cut.
They are beginning to reprice the possibility that the easing cycle has already run its course.
Rate sentiment deteriorated as markets reassessed the sustainability of the easing cycle, indicating that confidence in lower rates weakened before policy expectations fully adjusted.
Taken together, the two charts map the arc of the current macro cycle: from the confidence of 2024’s disinflation trade, through the inflation scare of 2025, to today’s more complex regime in which geopolitics, energy and policy uncertainty are again shaping the distribution of risks.
Inflation sentiment tends to turn first. Rate sentiment follows as markets reassess the policy path. That repricing then feeds through to front-end yields, the dollar and broader asset allocation.
Across both charts, the combined grey signal is the clearest read of regime change. It smooths local noise and isolated reactions, showing when domestic and international narratives are converging into a broader macro trend. At each major inflection point in this period, that convergence offered information ahead of confirmation in the official data.
The immediate market question is whether this proves another transient geopolitical premium or the early phase of a more durable inflation regime.
Current signals lean towards the latter.
Inflation sentiment remains elevated. Rate sentiment is re-firming. Official releases have begun to validate the turn.
That is where Permutable’s real-time macro sentiment has value. It does not remove uncertainty. It offers earlier recognition of regime change than traditional data can provide.
For macro desks, that means a cleaner read on narrative direction before it is fully expressed in pricing. For systematic investors, it offers a regime filter when relationships between inflation, policy and markets begin to change.
Both inflation and rate sentiment remain positive. The international series continues to lead. The hard data is beginning to follow.
The current macro regime reflects a shift from disinflation to renewed uncertainty, where energy, geopolitics and policy constraints are interacting to reshape inflation and interest rate expectations.
The current macro sentiment signal suggests that inflation risks are no longer transient. Energy-driven price pressure and persistent geopolitical uncertainty are increasing the probability of a more durable inflation regime.
For markets, this implies:
Macro sentiment data indicates that the current inflation shift is not purely a short-term shock. Oil-driven price pressure and persistent geopolitical risk are reinforcing a more complex inflation regime, with direct implications for Federal Reserve policy and market positioning.
Our Regional Macro Indices track domestic and international policy narratives across 50+ economies, updated daily. For access or integration enquiries, contact us at enquiries@permutable.ai.
This analysis uses Permutable AI’s Regional Macro Indices, which track sentiment across global news and financial narratives in real time. The indices measure both domestic and international sentiment across 50+ economies, allowing for early identification of macro regime shifts.