See what is moving crude oil before price confirms it

Turn global reporting on OPEC policy, sanctions, geopolitics, shipping, production, inventories and refinery activity into structured crude oil intelligence – with historical and live contract-level indices, driver signals, event records and the underlying sources behind every shift across Brent, WTI and refined-product markets.

Built for systematic research, market monitoring and institutional integration.
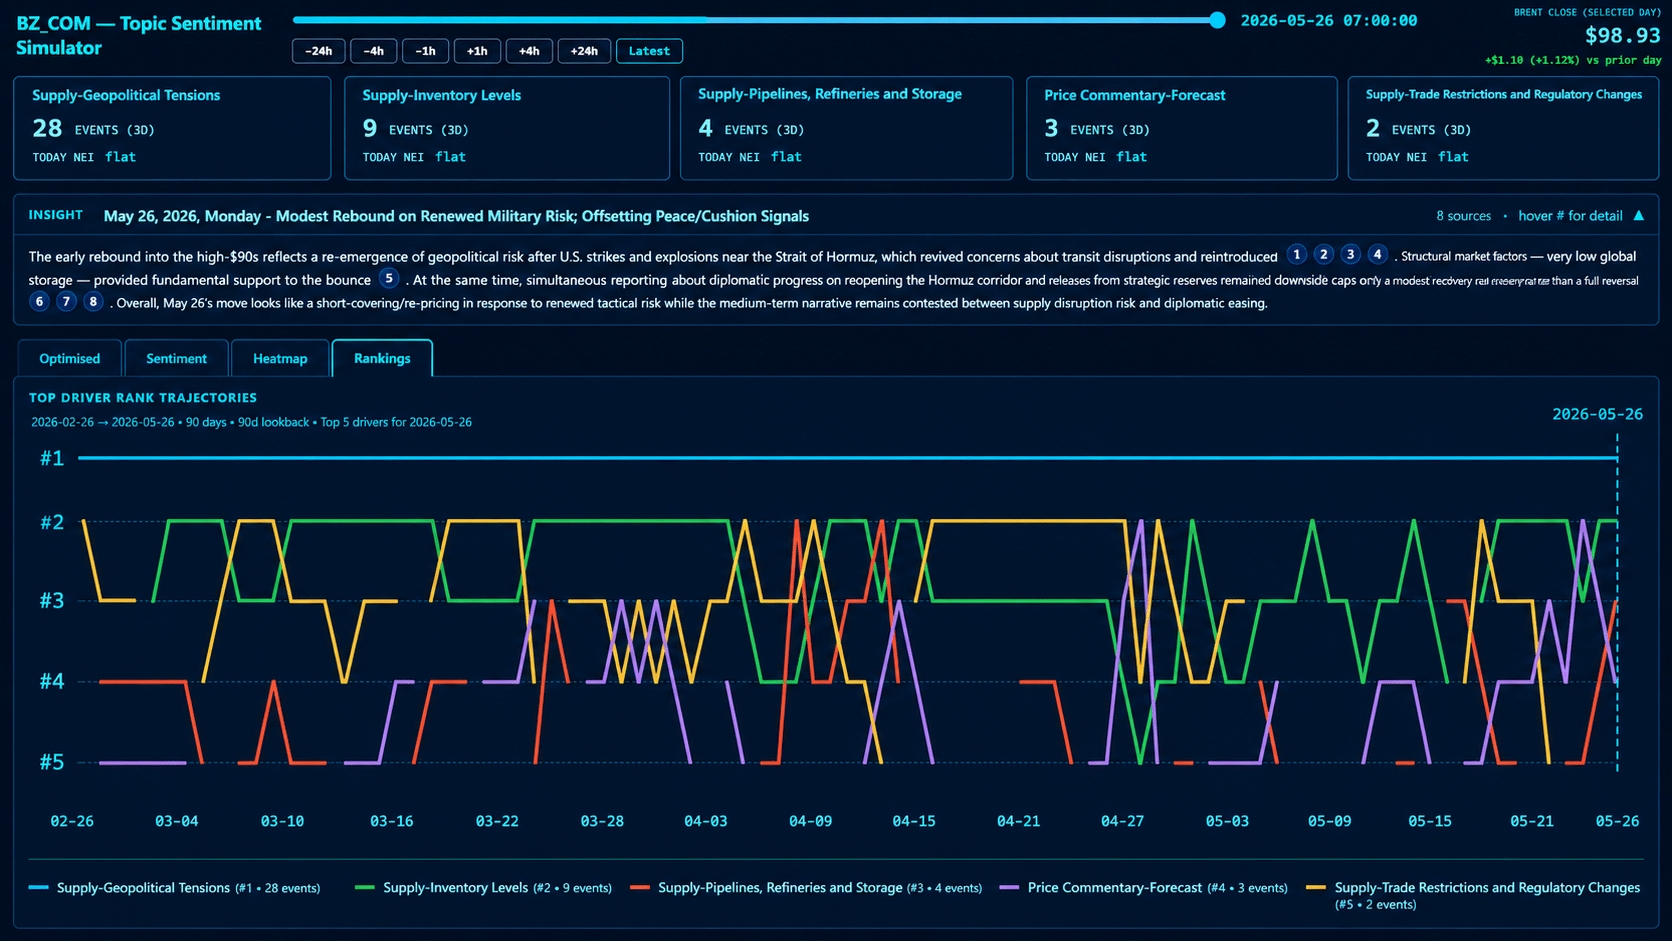
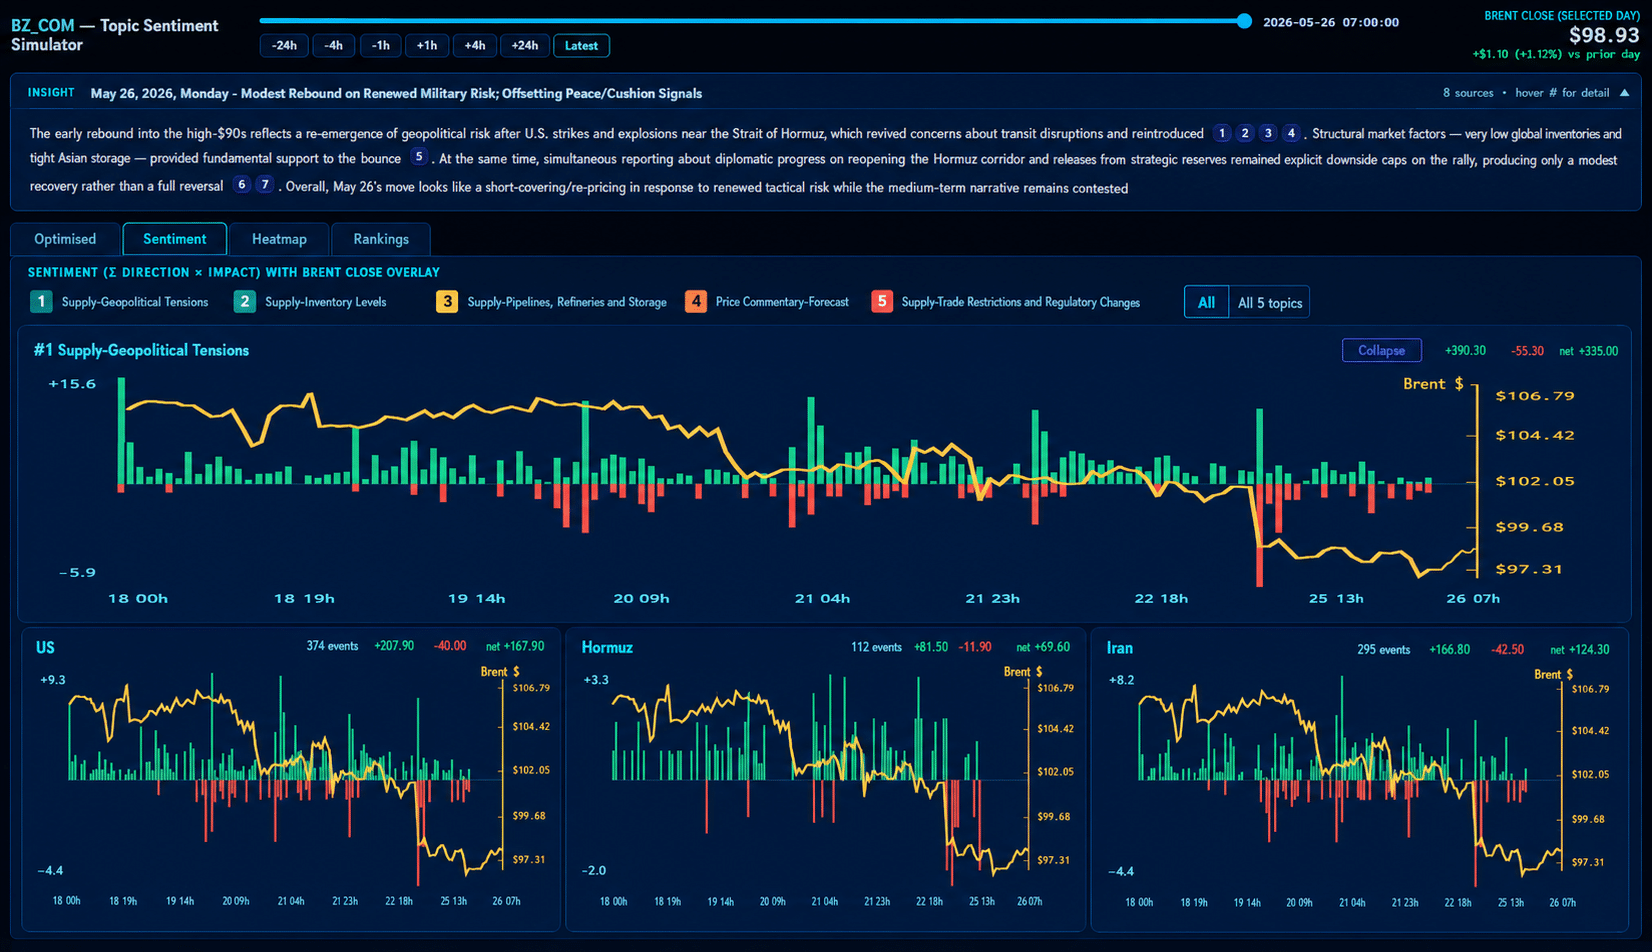
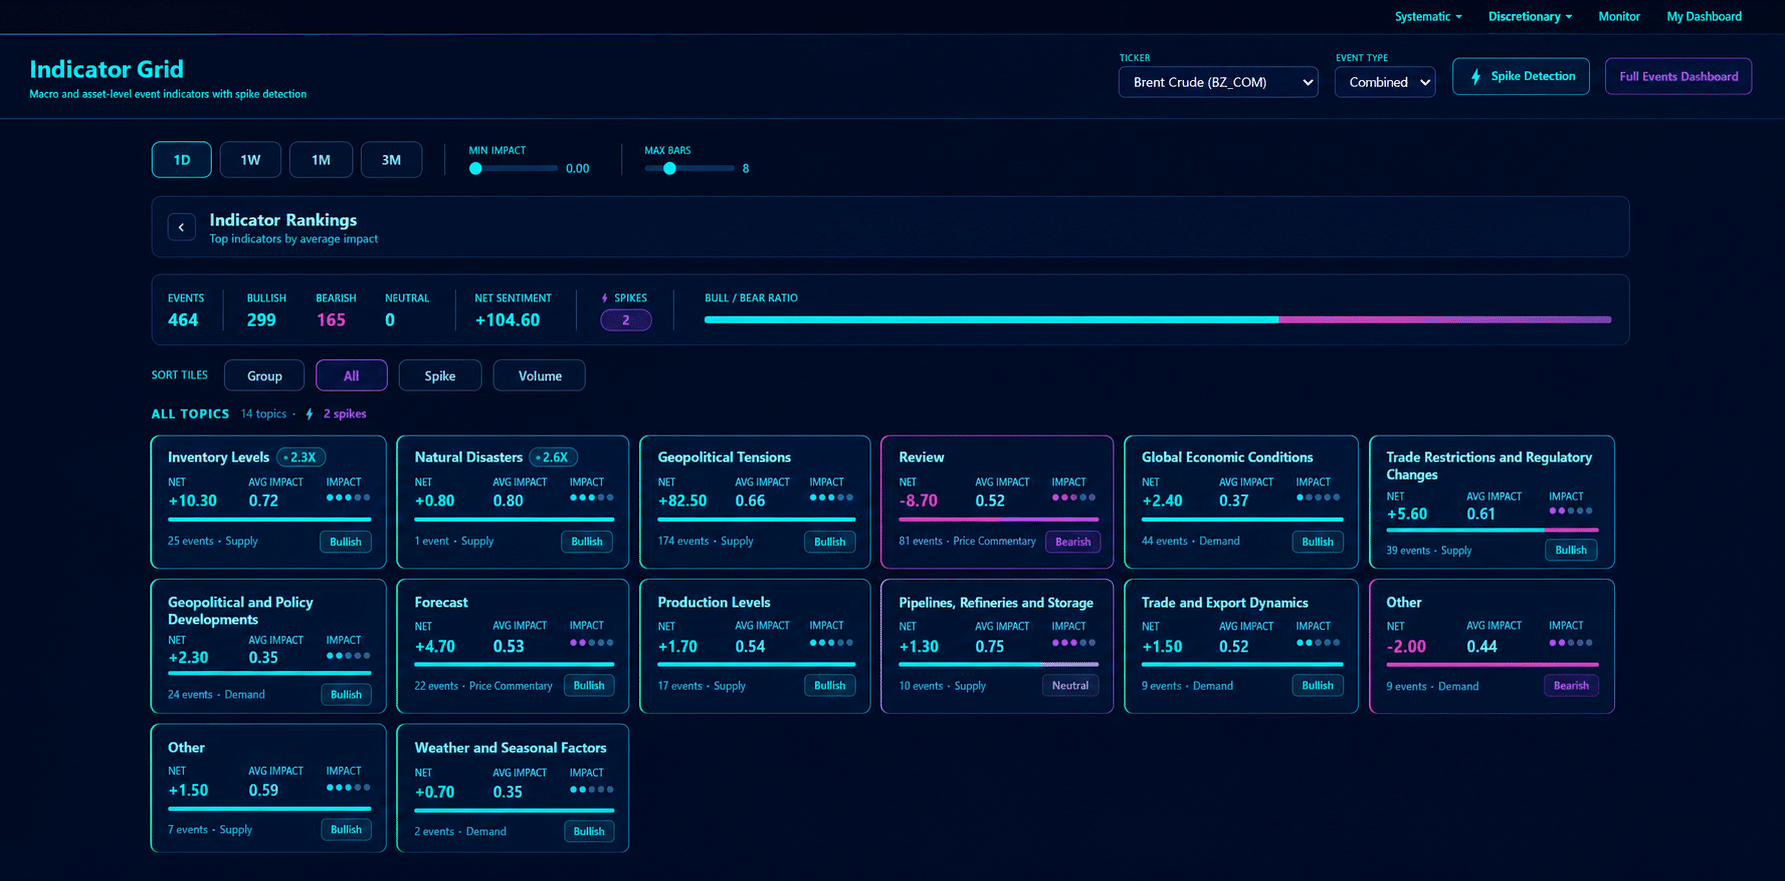
Permutable visualisation showing 90-day Brent crude driver rank trajectories for geopolitical tensions, inventories, refinery storage, forecasts and trade restrictions.
  • 11 years point-in-time data
  • Brent, WTI, RBOB, gasoil and heating oil
  • Hourly indices, signals, events and source records
  • API, Excel, files and data feeds
Request sample crude oil data

Trusted by energy and commodity market teams

Global commodity trading house “The useful part is being able to see what sits behind the move. Permutable links the crude signal back to the drivers, events and sources, which makes it easier to judge whether the move is real.”
Energy trading desk “Permutable helped us separate short-term oil-market noise from a genuine shift in the underlying narrative. The driver breakdown made the signal much easier to trust.”
Leading global hedge fund “For crude oil, the value is seeing how geopolitics, inventories, supply disruption and macro pressure are moving together. Permutable gives us that context in a structured way.”
Book a demo

See the signal beneath the price move

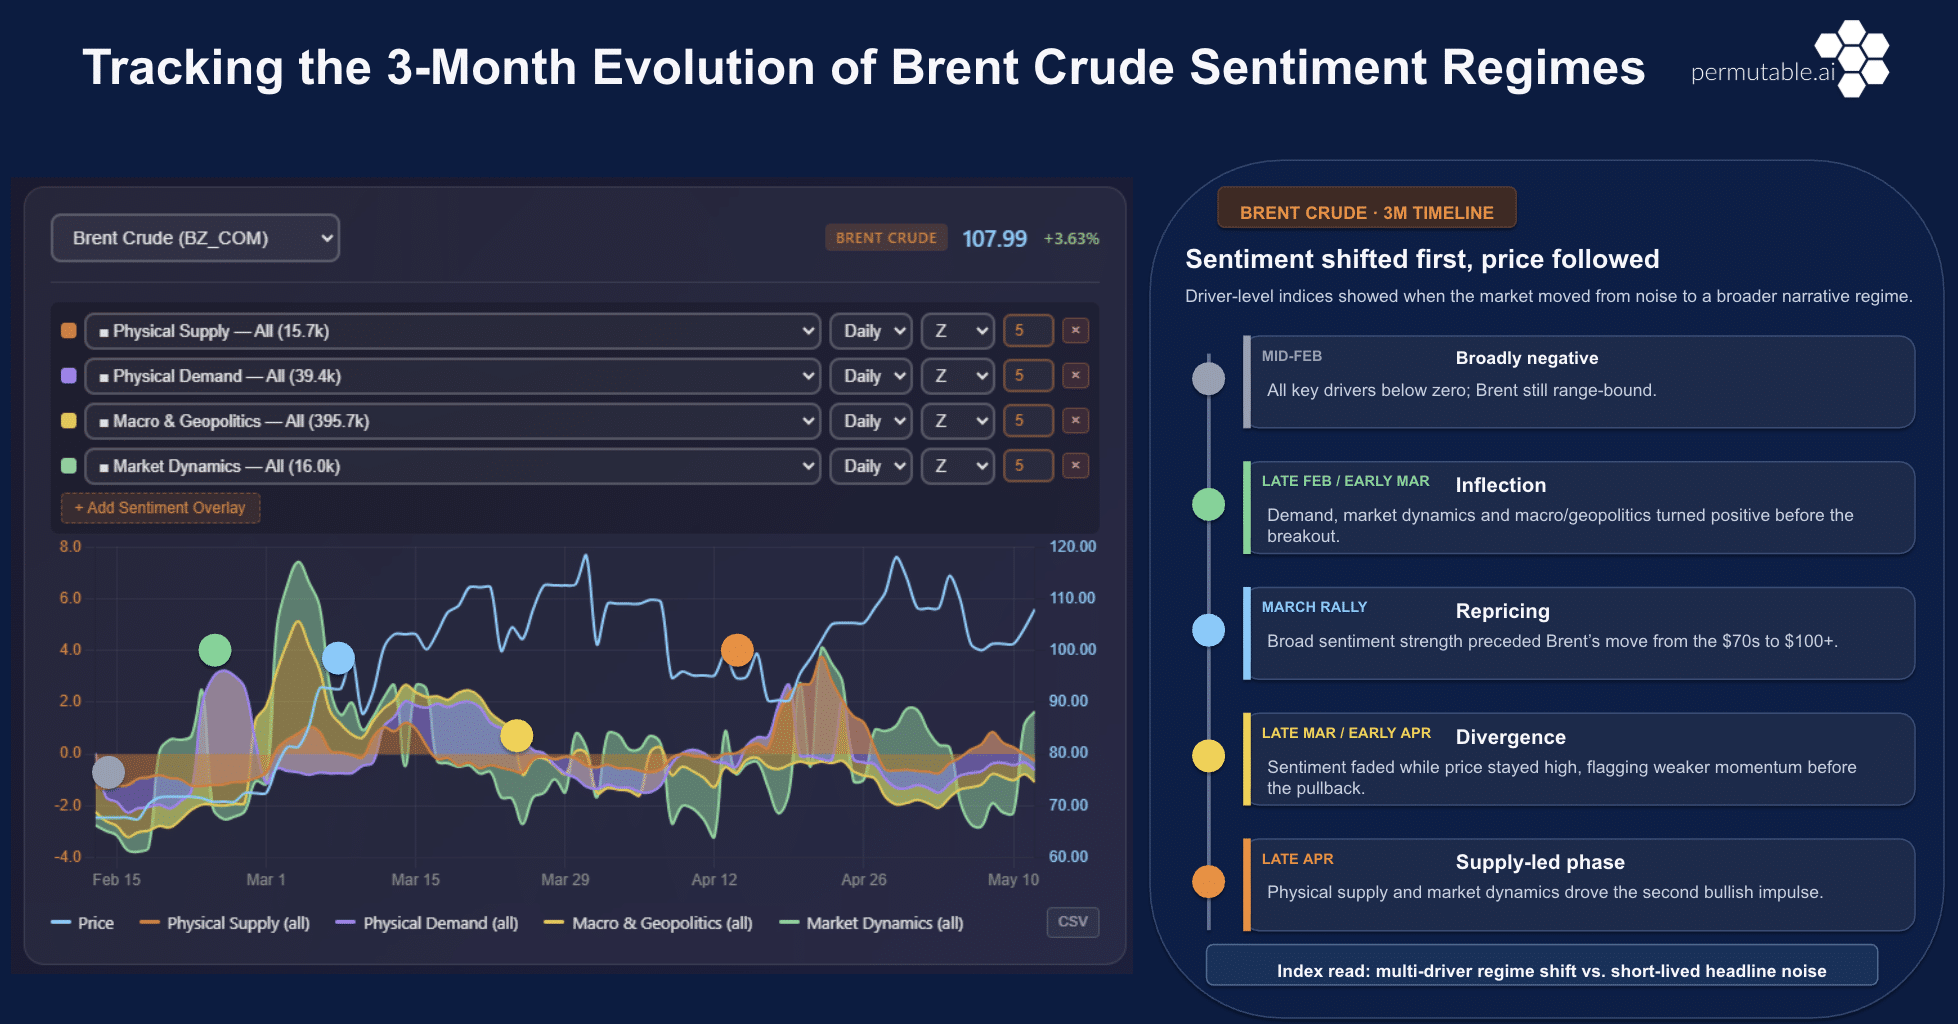
From geopolitical panic to broader bearish pressure

Brent’s initial risk premium was dominated by geopolitical escalation. As the market evolved, the signal broadened into weaker macro sentiment, changing physical supply conditions and deteriorating market structure – indicating that the bearish repricing was no longer being driven by geopolitics alone.

Date range: Three-month analysis window

Signals shown: Brent price, geopolitical risk, macro sentiment, physical supply dynamics and market-structure signals

Permutable's energy indices tracking three months of Brent crude sentiment regimes across physical supply, physical demand, macro and geopolitical drivers, and market dynamics with corresponding price evolution.

From market change to institutional workflow

What changed? Why is it changing? How can it be used?
Contract and asset indices Supply, demand, inventories, OPEC, shipping, sanctions and geopolitical drivers Research, monitoring, systematic models and risk workflows
Direction and magnitude Source-linked events and story development Historical replay, alerts, API, Excel and data feeds
Brent, WTI and refined products Narrative persistence, divergence and transmission across markets Cross-market analysis, scenario testing and custom configurations
Request sample event records

Auditable crude signals behind every market shift

Without Permutable With Permutable
Headlines disconnected from individual contracts Contract and driver-level signals
One generic oil sentiment score Separate supply, demand, policy, sanctions and geopolitical series
No clear evidence behind a signal change Source-linked events, headlines and timestamps
Historical data vulnerable to hindsight Strict point-in-time construction
Different structures for research and live use Consistent historical and production schema
Manual monitoring across multiple sources API, Excel, files and institutional feeds

Built to be evaluated without hindsight

Historical observations are constructed using only the information available at their original timestamps, allowing the same signal structure to be tested historically and monitored in production.

  • Point-in-time history

    Each observation reflects only the information available at that moment.

  • Source and processing timestamps

    See when information was published, captured and converted into a signal.

  • Versioned signal outputs

    Identify which production methodology generated each historical or live value.

  • Consistent research and live schema

    Move from historical analysis into monitoring without rebuilding fields or data structures.

Explore API delivery

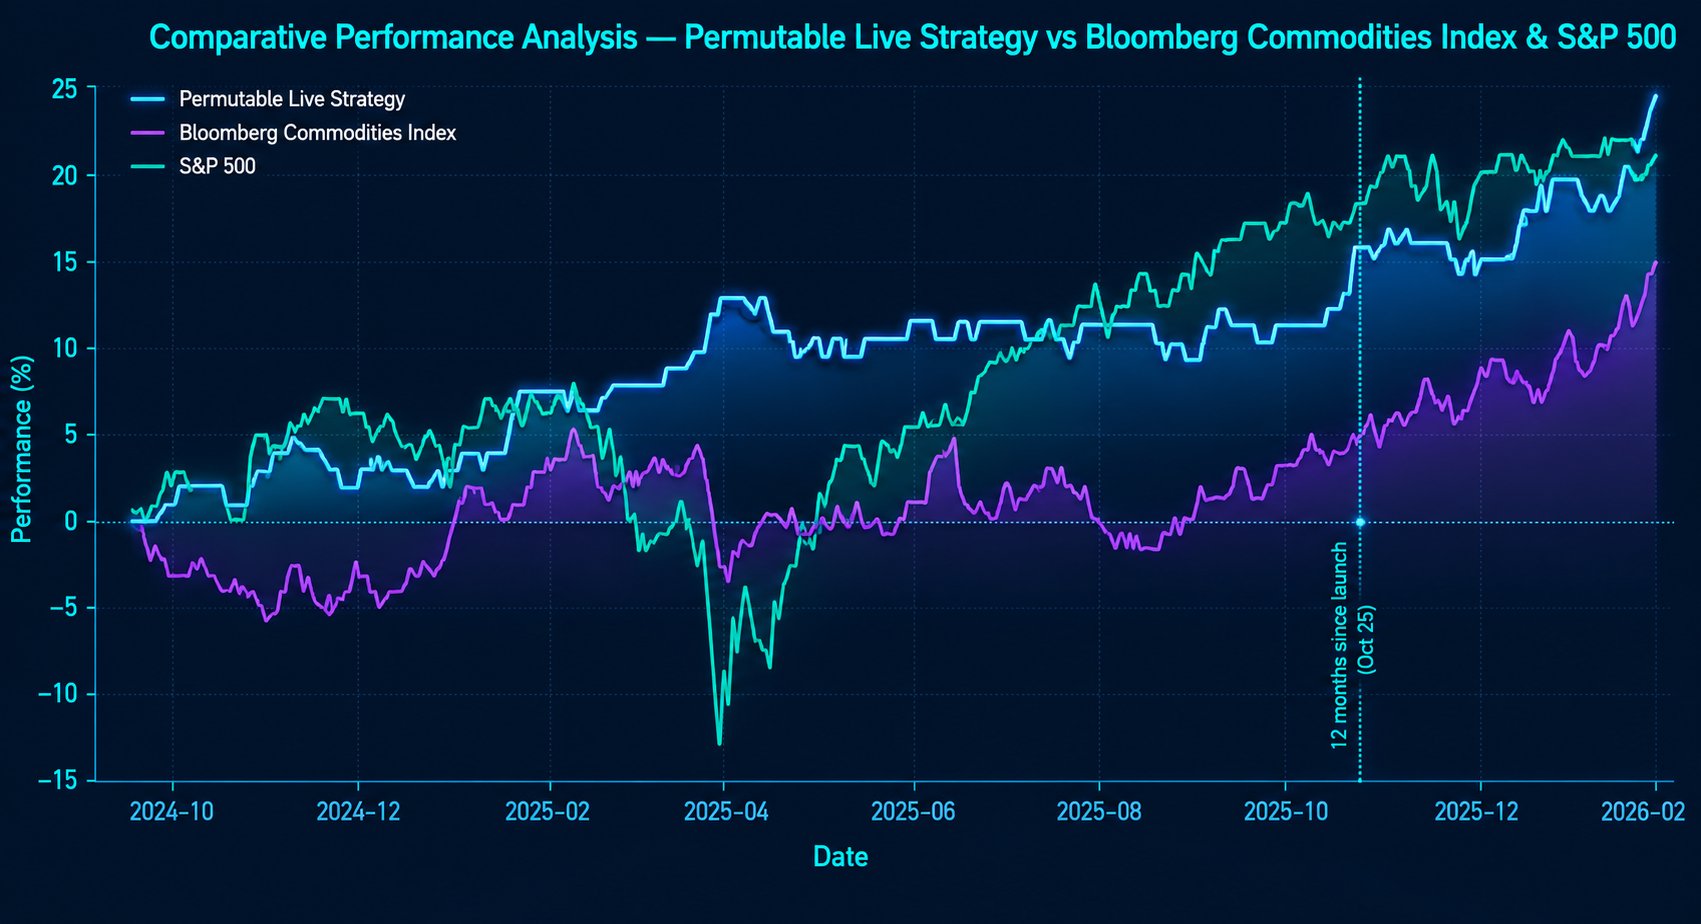
Validated in a live multi-commodity implementation

A defined 16-month implementation using Permutable signals across liquid energy, agriculture and metals futures delivered a 28.54% total return, 20.86% annualised return, 7.01% annualised volatility and a −2.95% maximum drawdown.

These results reflect one implementation under defined portfolio and risk rules. They do not represent expected performance across every strategy or application.

View full results

FAQs

  • What does the crude oil dataset contain?

    The dataset includes historical and live crude oil indices, contract-level signals, market-driver series, event records and source-linked observations. Signals can be organised by asset, contract, topic and direction of pressure for systematic research, monitoring and production use.

  • Which crude oil benchmarks and refined-product contracts are covered?

    Coverage includes Brent and WTI crude, alongside refined-product markets such as RBOB gasoline, gasoil and heating oil. Data can be structured around benchmark, contract and market driver, with detailed coverage available for specific research and integration requirements.

  • How far back does the historical data go?

    Permutable provides more than 11 years of historical crude oil data. Exact start dates may vary by contract, driver and configuration.

  • Is the historical dataset strictly point in time?

    Yes. Historical observations are constructed using only the information available at the original timestamp. Later events, revised interpretations and subsequently known market outcomes are not inserted into earlier readings.

  • How frequently are the indices and event records updated?

    Update frequency can be adapted to the required workflow, from historical research and backtesting to real-time and intraday monitoring and production integration.

  • Can users access the underlying events and sources?

    Yes. Source-linked configurations can include the events, headlines, entities, topics, timestamps and source metadata contributing to a signal or index movement, supporting traceability and validation.

  • How is the crude oil data delivered?

    The data can be delivered through API, Excel, structured historical files and institutional data feeds. Historical and live outputs use consistent data structures to support testing, monitoring and integration into existing workflows.