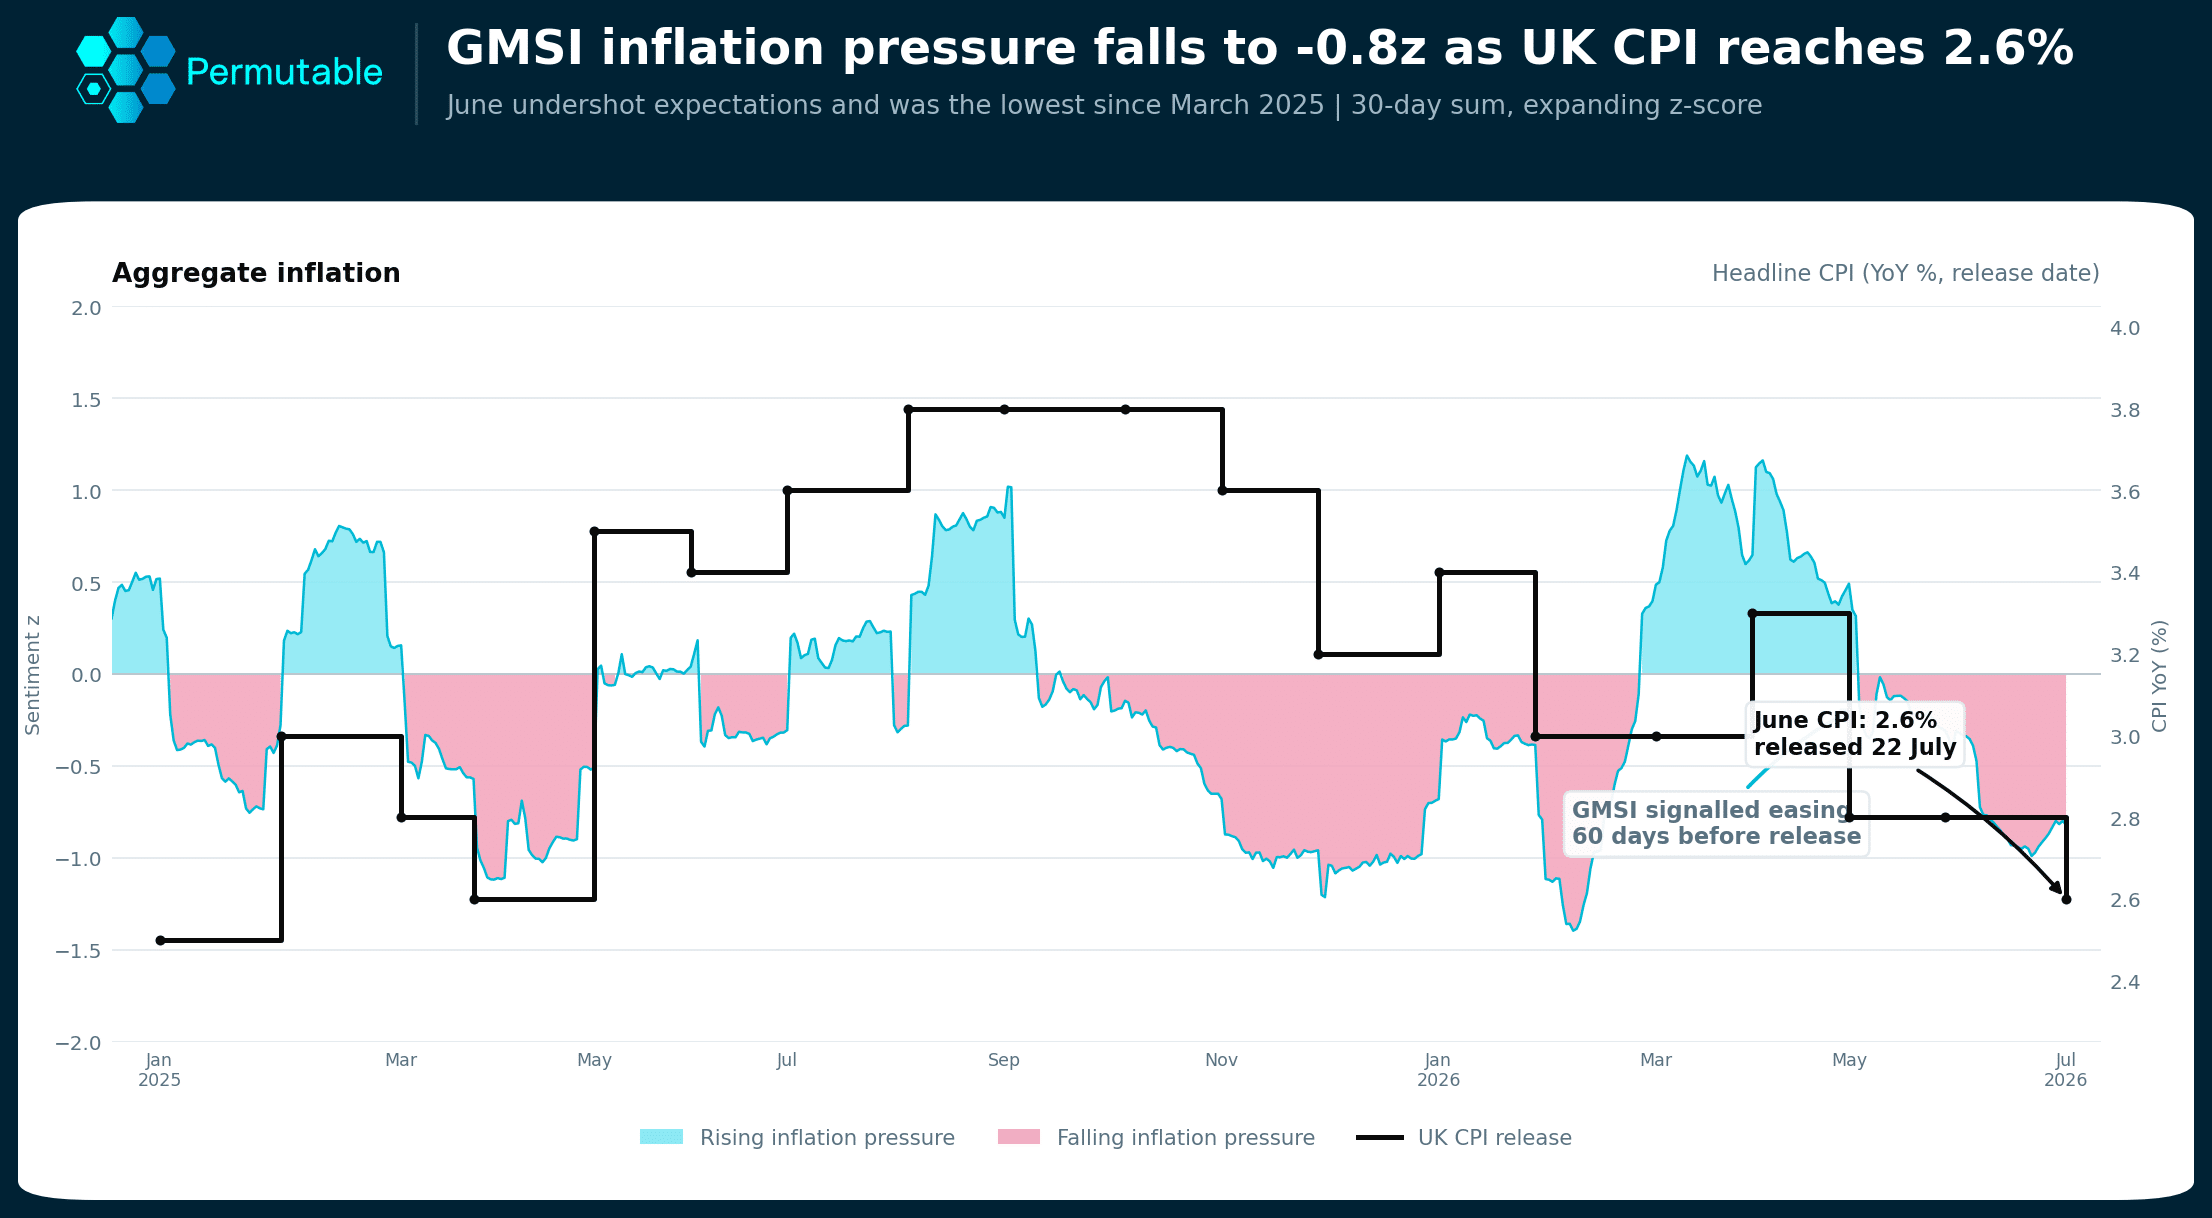
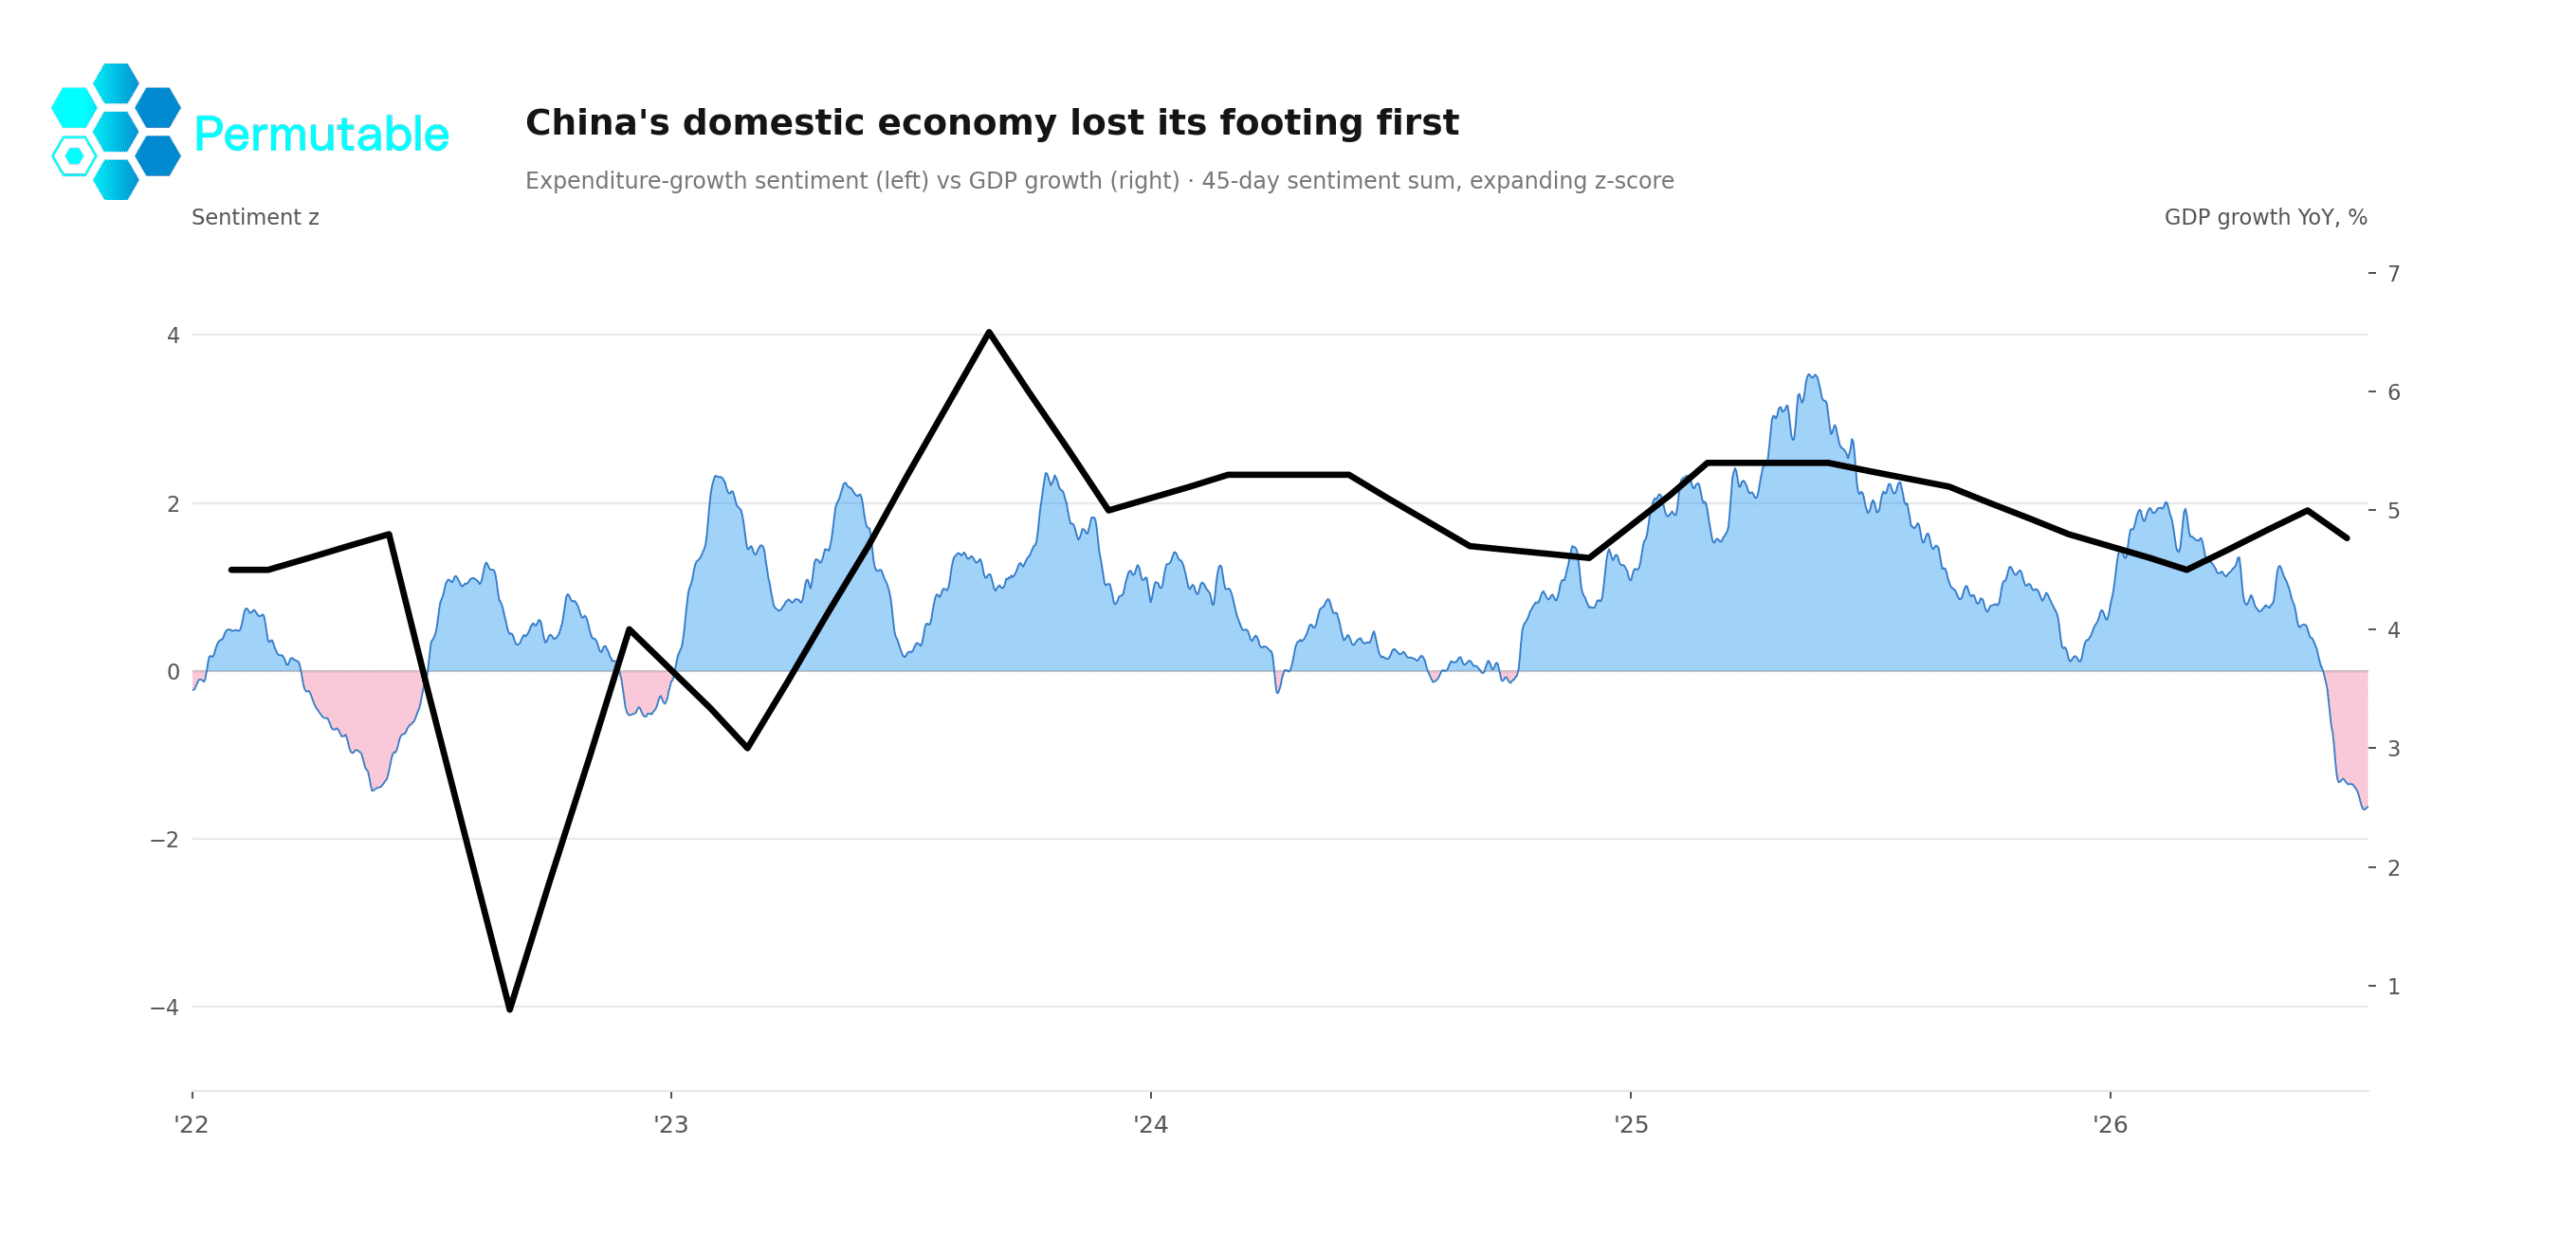
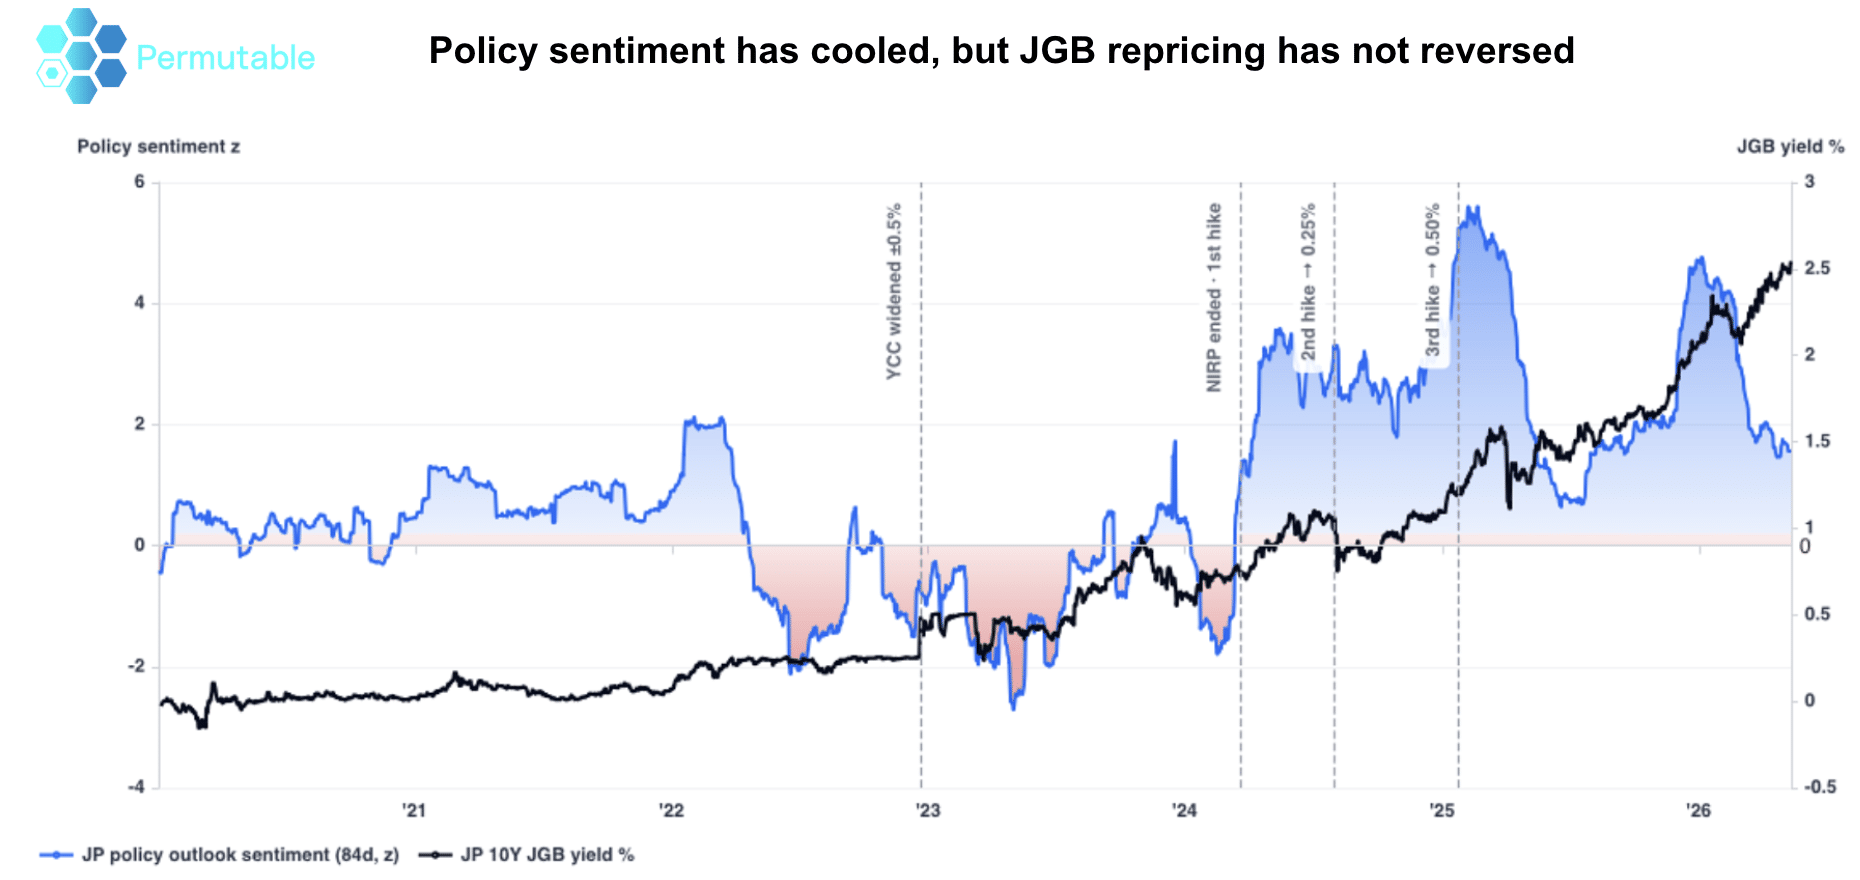
Connect macro change to market impact

Understand how shifts in inflation, growth, monetary policy and political risk are developing across economies – and where those pressures may transmit across rates, FX, commodities and global portfolios.
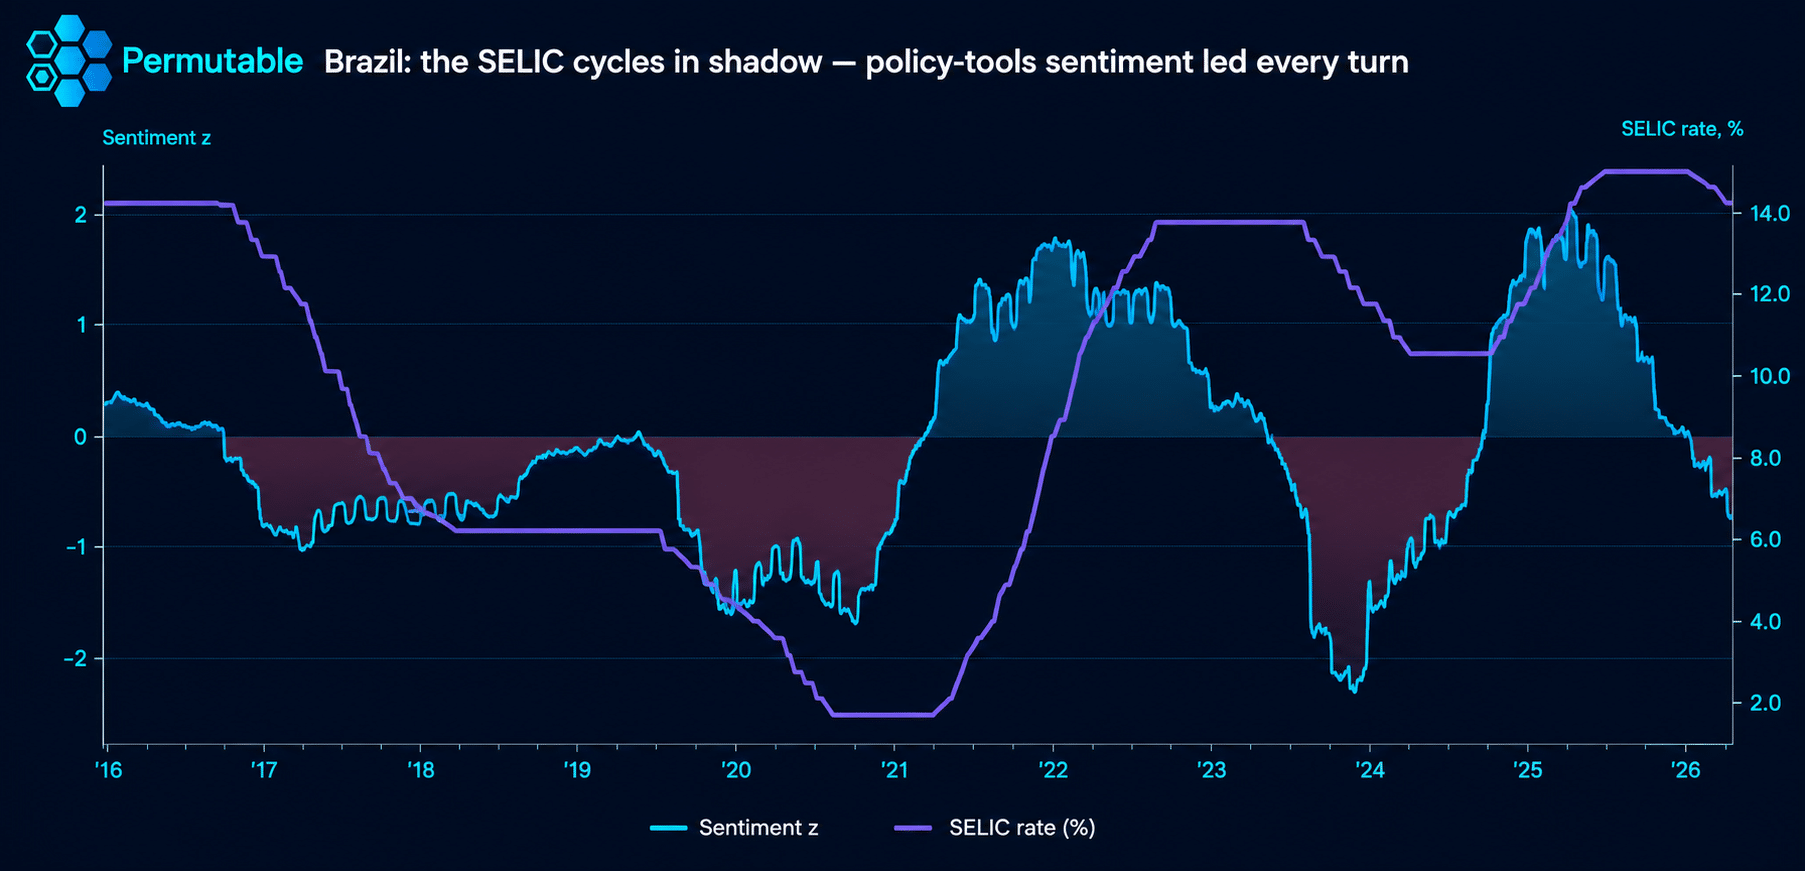

Dark institutional chart showing Brazil policy-tools sentiment z-score against the SELIC rate from 2016 to 2026, highlighting how sentiment turned ahead of major Brazilian monetary policy cycles.
  • Country divergence
  • Policy repricing
  • Cross-market transmission
Explore Global Macro Sentiment Indices

The questions that sit between data and markets

Permutable helps teams investigate how the macro environment is changing, where conditions are diverging and when those developments may become relevant for market pricing.

  • Where is economic pressure building?

    Track whether inflation, growth, fiscal or political pressure is strengthening, weakening or becoming more persistent.

  • Which economies or sectors are diverging?

    Compare countries and economic components to identify where headline resilience may be masking weaker demand or uneven activity.

  • Are policy expectations beginning to turn?

    Monitor changes in central-bank narratives, credibility and the expected policy path before those shifts are fully reflected in positioning.

  • Where could the pressure transmit next?

    Connect macro developments with rates, currencies, commodities, sovereign risk and wider portfolio exposures.

Discuss your macro questions

See how macro change becomes market relevant

  • Economic divergence

    Compare production, expenditure, consumption and investment signals to determine whether economic resilience is broad-based or dependent on a narrower part of the economy.

  • Policy repricing

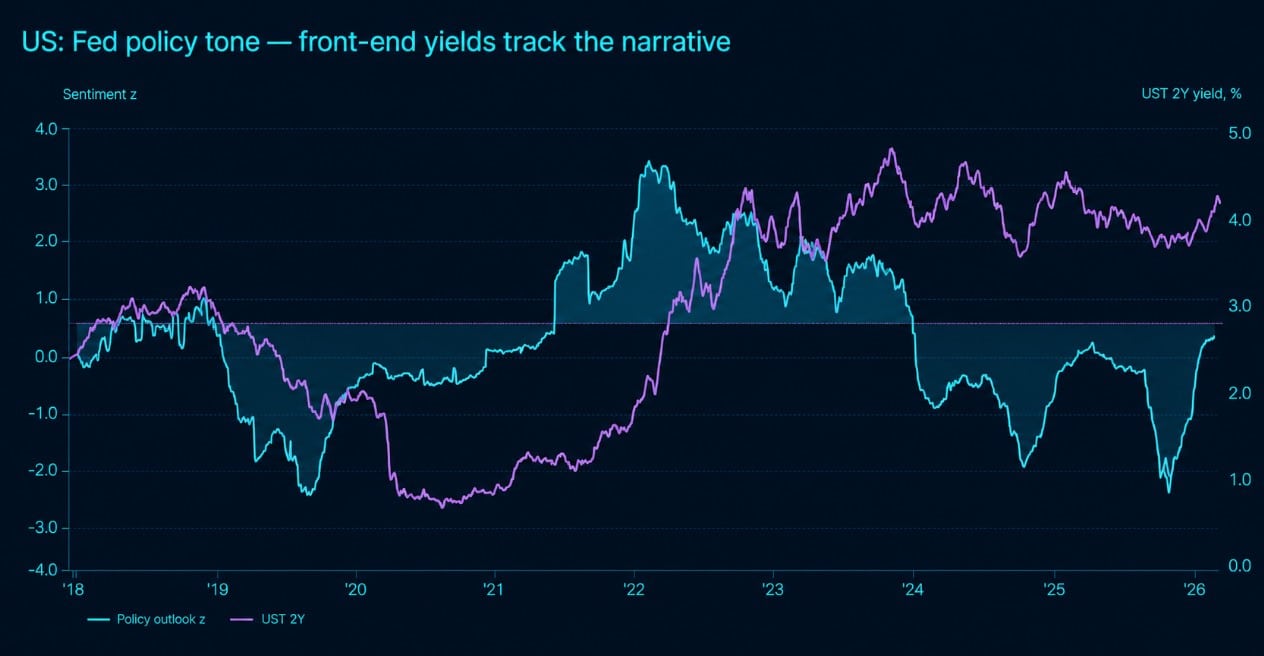
    Follow how hawkish or dovish policy pressure changes through the cycle and assess whether expectations are moving ahead of official decisions or market consensus.

  • Cross-market transmission

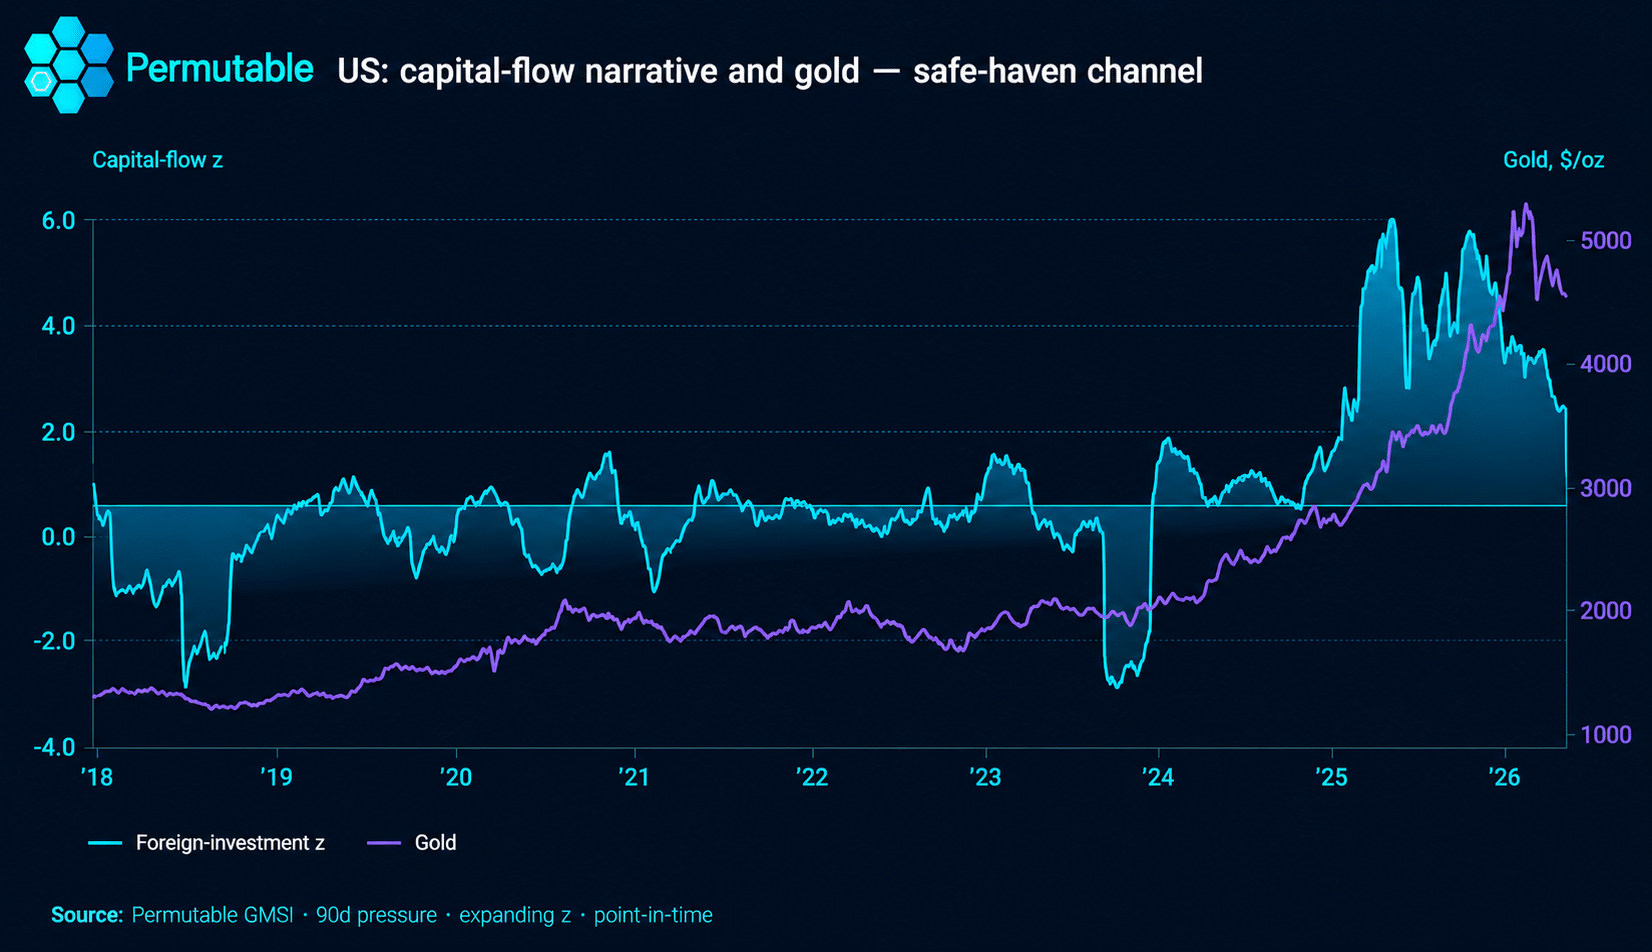
    Examine how changes in policy, capital flows, fiscal risk and political pressure begin to affect rates, currencies, commodities and safe-haven demand.

See macro intelligence in action

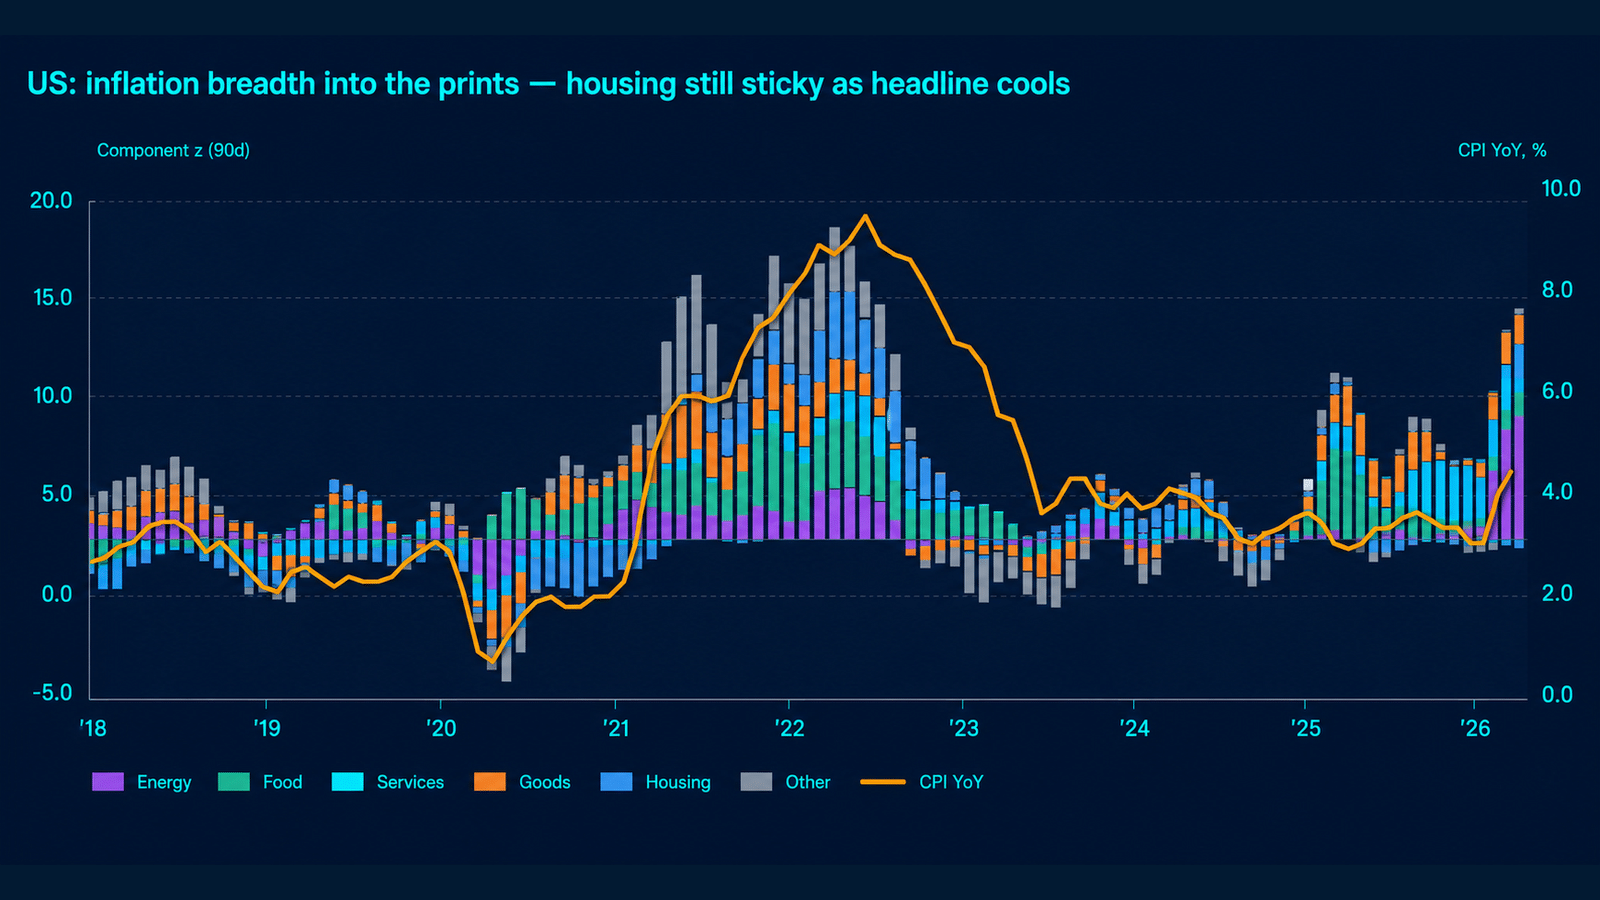
See inflation pressure beneath the headline

Track whether inflation pressure is broadening, narrowing or rotating across energy, food, housing, services, wages and consumer goods before the change is fully reflected in official releases.

Date range: 2018–2026

Signals shown: Energy, food, services, goods, housing and other inflation components alongside US CPI

Dark Permutable chart showing US inflation breadth from 2018 to 2026, with stacked component z-scores for energy, food, services, goods, housing and other categories alongside CPI YoY.
View Global Macro Sentiment Indices

Macro intelligence across institutional workflows

Permutable provides an additional information layer for teams seeking to understand what is changing in the economy, why it is changing and when it may become relevant for markets.


A consistent intelligence layer across global macro markets

Global and local information is classified into country, topic, narrative and event-level macro intelligence, with domestic-versus-international separation, source traceability and point-in-time processing throughout.

Explore the Intelligence Engine

The signal layer behind the analysis

Permutable’s Global Macro Sentiment Indices transform global and local information into hourly, point-in-time country and topic signals. Explore the dedicated product page for coverage, signal structures, historical methodology, empirical evidence and delivery options.

Explore Global Macro Sentiment Indices

Macroeconomic information, structured into auditable signals

Conventional workflow With Permutable
Macro headlines disconnected from individual countries and economic topics Country, topic, event and source-level signals
One generic country or news-sentiment score Separate inflation, growth, policy, fiscal, labour, trade and geopolitical series
Domestic and international reporting blended together Separate domestic, international and combined views
No clear evidence behind a signal movement Source-linked events, narratives and timestamps
Historical analysis vulnerable to hindsight Strict point-in-time construction
Manual monitoring between official releases Hourly indices delivered through API, Excel, files and institutional feeds

FAQs


  • What does the macroeconomic dataset contain?

    Permutable’s macroeconomic dataset includes historical and live country and topic-level indices, directional and semantic signals, domestic and international views, event records and source-linked observations. Outputs can be organised by economy, economic topic, reporting perspective, signal type and direction of pressure, allowing users to move from an aggregate index to the developments contributing to it.

  • Which countries and economic topics are covered?

    Coverage spans more than 95 economies and over 70 macroeconomic topics across inflation, economic growth, monetary policy, fiscal policy, labour markets, trade, political risk and geopolitics. Reporting is processed across more than 80 languages, enabling users to compare developments in major economies with signals from emerging and less extensively covered markets.

  • What is the difference between domestic and international signals?

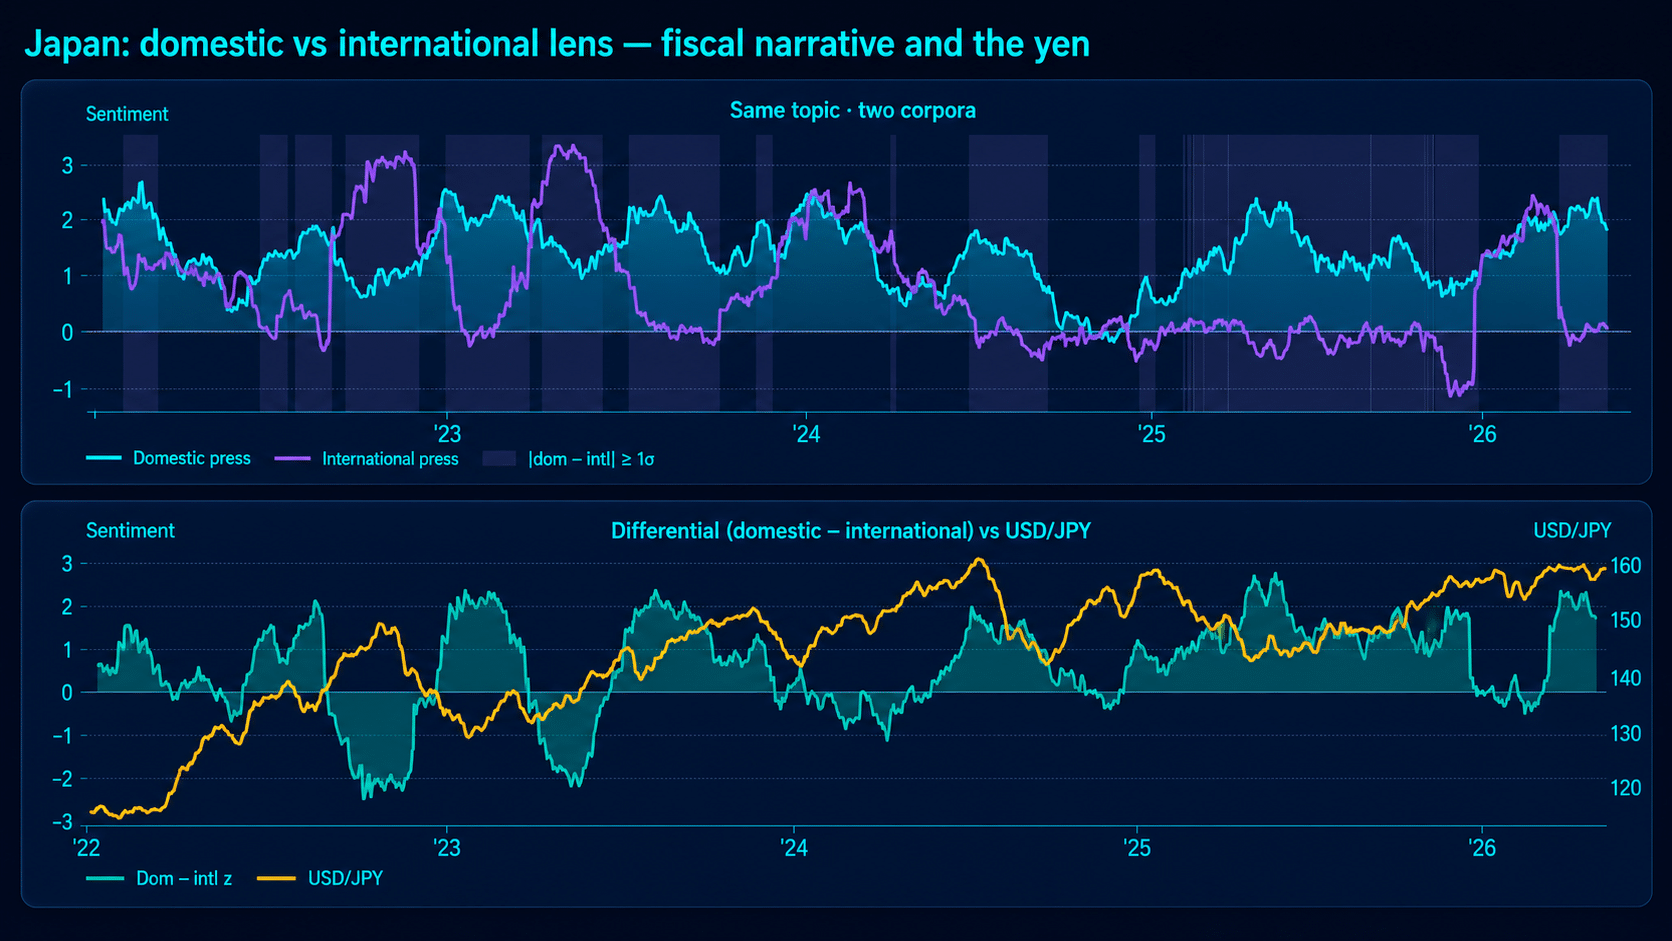
    Domestic signals are constructed from reporting originating within the economy being analysed, while international signals reflect how that economy is discussed by sources outside it. Permutable also provides a combined view, allowing users to identify where local economic narratives align with or diverge from international market perception.


  • What is the difference between directional and semantic sentiment?

    Directional signals identify whether reporting implies improvement, deterioration, tightening, easing, acceleration or deceleration within a macroeconomic topic. Semantic signals capture the broader meaning and context of the reporting, helping distinguish developments that may use similar language but carry different economic implications.

    The two signal types can be analysed separately or together, depending on the research question and model design.


  • How far back does the historical macroeconomic data extend?

    Permutable provides more than 11 years of point-in-time macroeconomic history, with core series extending from 2015 to the present. Exact availability can vary by economy, topic and configuration and can be confirmed during the data-evaluation process.

  • Is the historical dataset strictly point in time?

    Yes. Each historical observation is constructed using only the information available at its original timestamp. Events, sources and signal values are preserved without incorporating information published later, helping users evaluate historical behaviour without hindsight or look-ahead bias.

    Historical and live outputs use a consistent structure so the same fields and signal definitions can be examined in research and monitored in production.

  • Are the production models tested out of sample?

    Yes. Permutable’s core production models were trained in 2020 and have not been retrospectively refitted using the major economic events that followed. COVID-19, global supply disruption, the inflation surge, widespread monetary tightening and subsequent disinflation were therefore processed as previously unseen regimes.

    This allows institutions to assess how the production framework behaved through economic conditions that were not included in its original training period.

  • Can users inspect the events and sources behind a signal?

    Yes. Users can access the source-linked events, narratives, headlines, countries, entities, economic topics and timestamps contributing to a signal. This makes it possible to investigate why an index changed, distinguish isolated reports from persistent narratives and trace the evidence behind historical and live observations.

  • How is macroeconomic intelligence delivered?

    Permutable provides macroeconomic intelligence through API, Excel, structured files and institutional data feeds. Standard indices are updated hourly, with delivery configurations available for research, monitoring, alerting and production workflows.

    Custom integrations can also be structured around particular countries, topics, signal types and internal data environments.

  • Can institutions evaluate sample macro data?

    Yes. Institutions can request a sample containing country and topic-level indices, domestic and international views, directional and semantic signals, source-linked events and example records.

    Samples can be structured around a defined research question, such as inflation breadth, monetary-policy expectations, country divergence or cross-market transmission, and can include a data dictionary and point-in-time methodology note.