See what is moving agricultural commodities before price confirms it

Turn global reporting into structured agricultural commodity intelligence – with live and historical indices, driver signals, events and source-level evidence across grains, oilseeds, soft commodities and livestock.

Built for systematic research, market monitoring, cross-commodity analysis and institutional workflows.
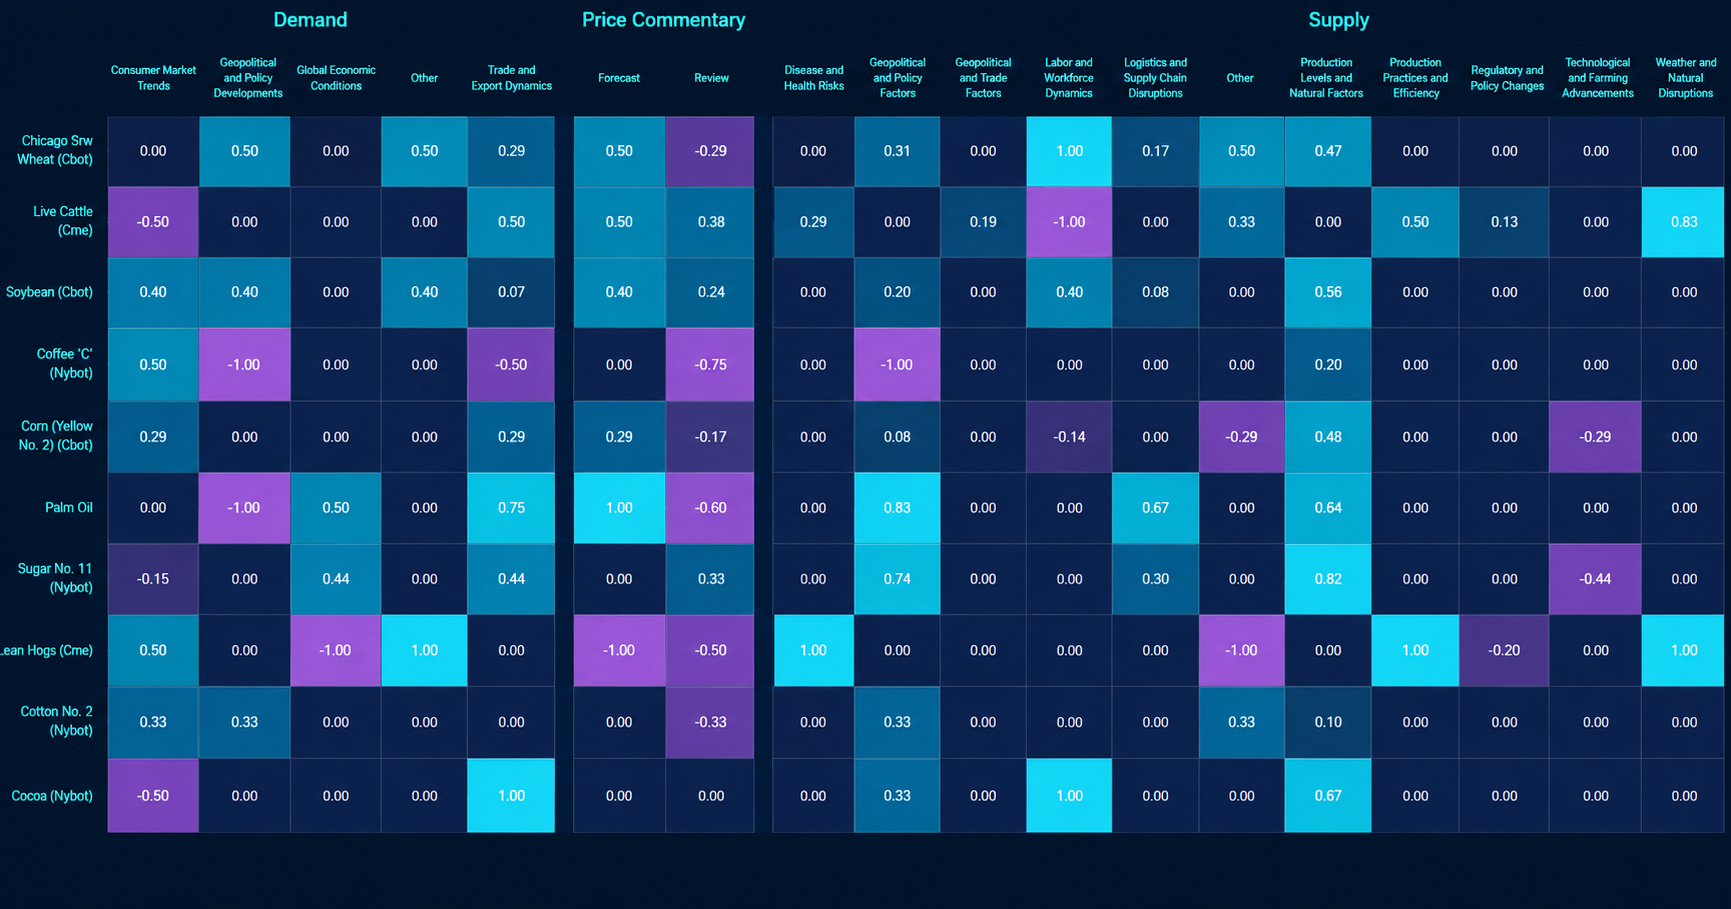

Permutable agricultural commodities sentiment heatmap powered by AI, showing real-time bullish, neutral and bearish sentiment across key agricultural commodities including wheat, soybeans, coffee, corn, palm oil, sugar, cotton and cocoa. The dashboard analyses supply, demand and price commentary factors such as geopolitical developments, trade dynamics, economic conditions, weather disruptions, production efficiency and regulatory changes using a colour-coded intelligence matrix.
  • Wheat, corn, soybeans, softs and livestock
  • Weather, crop, trade, biofuel, demand and cost drivers
  • Commodity, driver, event and source-level outputs
  • API, Excel, files and institutional feeds
Book a demo

Agricultural market change, structured for institutional workflows

What is measured? What explains the move? How is it used?
Commodity and driver-level indices Weather, crop conditions, yields, harvests, export policy, biofuel and feed demand, input costs, freight and geopolitics Research, monitoring, systematic models and risk workflows
Direction and magnitude Source-linked events and story development Historical replay, alerts, API, Excel and data feeds
Grains, oilseeds, soft commodities and livestock Narrative persistence, cross-commodity divergence and market transmission Portfolio analysis, scenario testing and custom configurations
Explore API delivery

See the signals behind agricultural commodity repricing

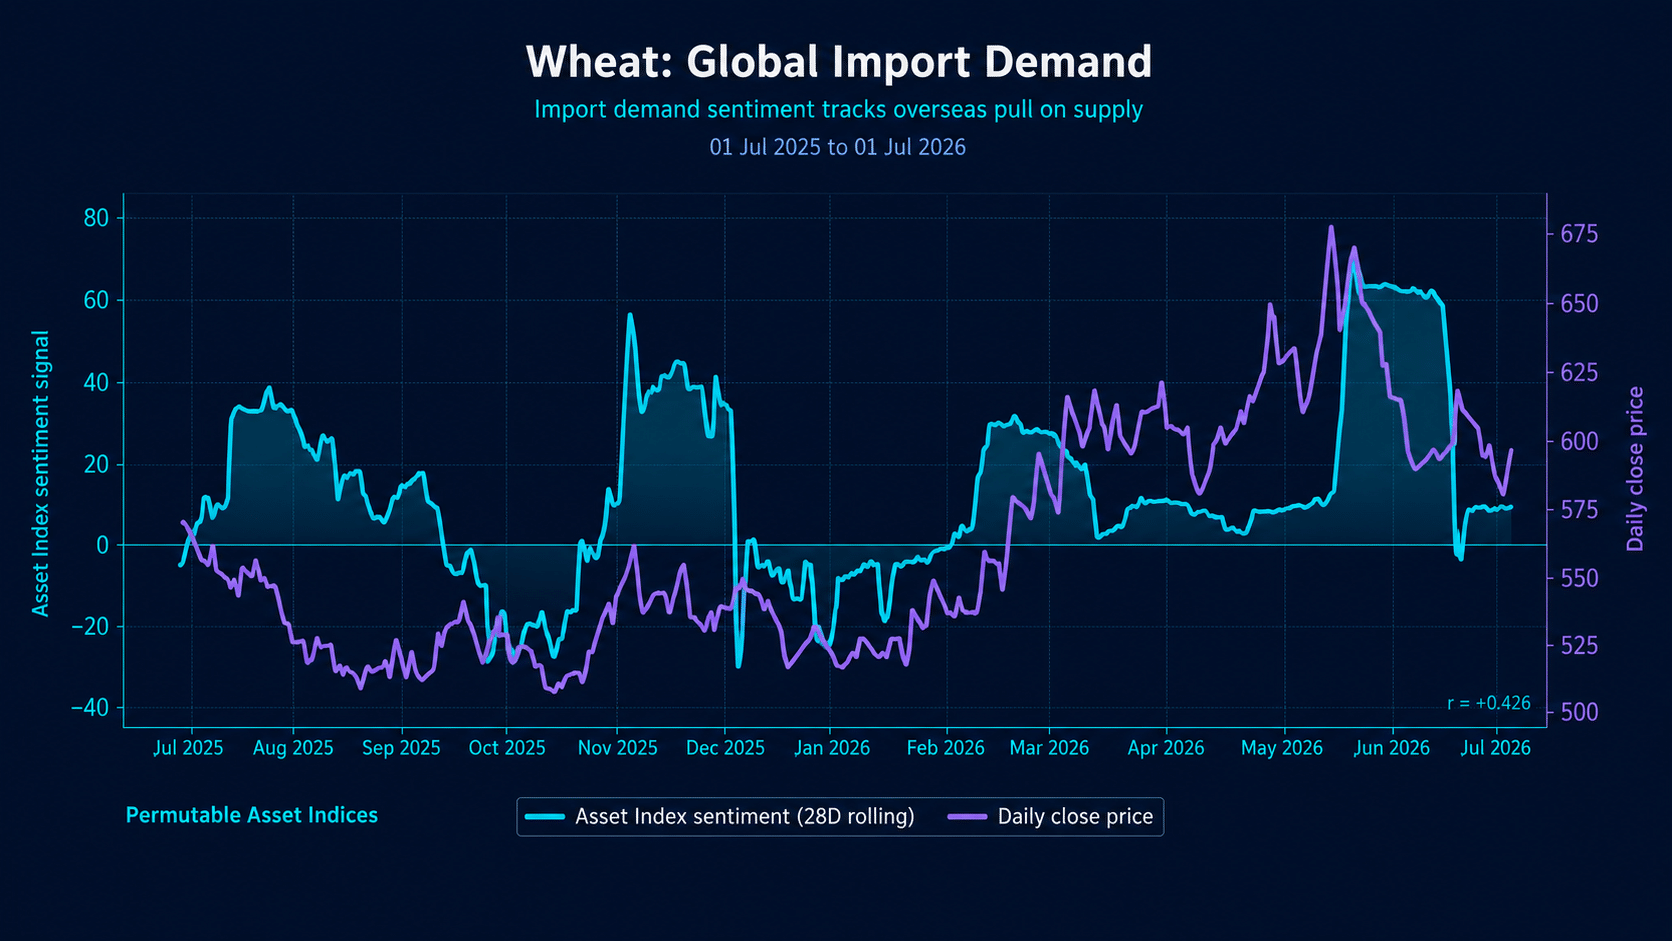
Agricultural commodities respond to changing combinations of weather, crop conditions, demand, trade policy, input costs and geopolitical risk. Permutable separates these forces by commodity and driver, allowing users to examine which narratives are strengthening and how they relate to market pricing.

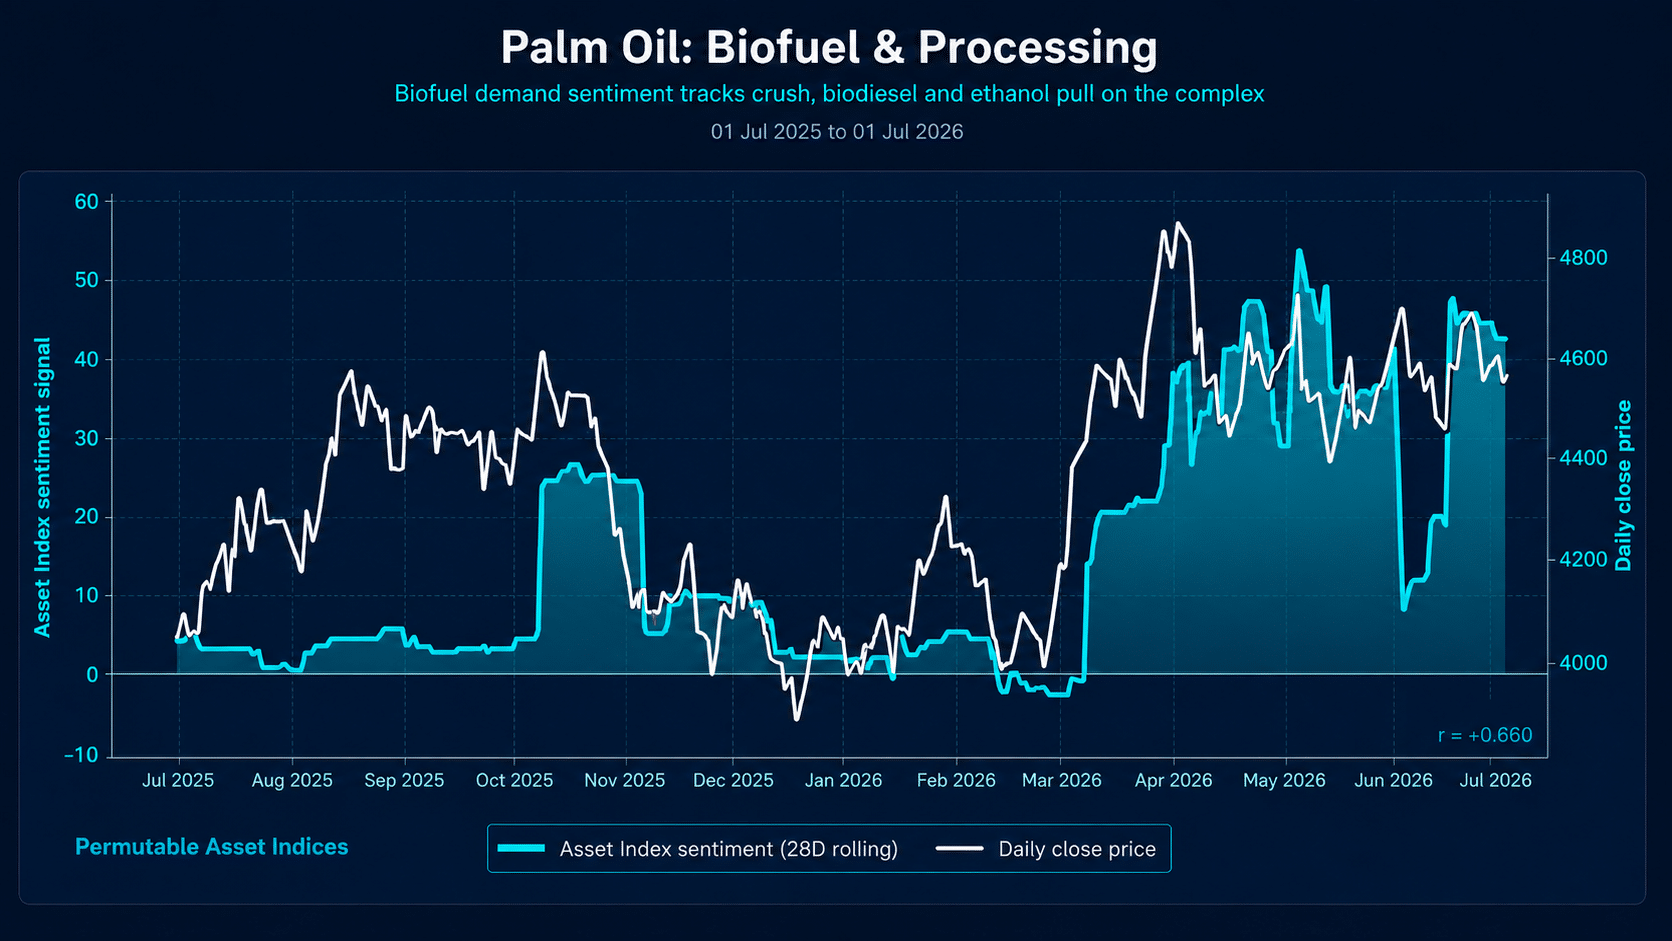
Tracking palm oil and soybean prices with biofuel and processing sentiment over the same one-year period. Presenting the two markets together helps users examine how a shared demand driver develops across related agricultural commodities without reducing both markets to one generic signal.

Signals shown: Palm oil biofuel and processing sentiment, soybean biofuel and processing sentiment, and daily closing prices

Dark institutional chart showing palm oil biofuel and processing sentiment against daily close price from July 2025 to July 2026, with Permutable Asset Indices sentiment and price movements compared.
Inspect the underlying signals

Fragmented agricultural information, structured into auditable signals

Conventional workflow With Permutable
Agricultural headlines disconnected from individual commodities and drivers Commodity, driver and event-level signals
One generic agricultural sentiment score Separate weather, crop, yield, export, biofuel, feed-demand, cost and geopolitical series
No clear evidence behind a signal movement Source-linked events, headlines and timestamps
Difficult to compare drivers across grains, oilseeds, softs and livestock Consistent cross-commodity signal structures
Historical analysis vulnerable to hindsight Strict point-in-time construction
Manual monitoring across multiple sources API, Excel, files and institutional feeds
Built to be evaluated without hindsight

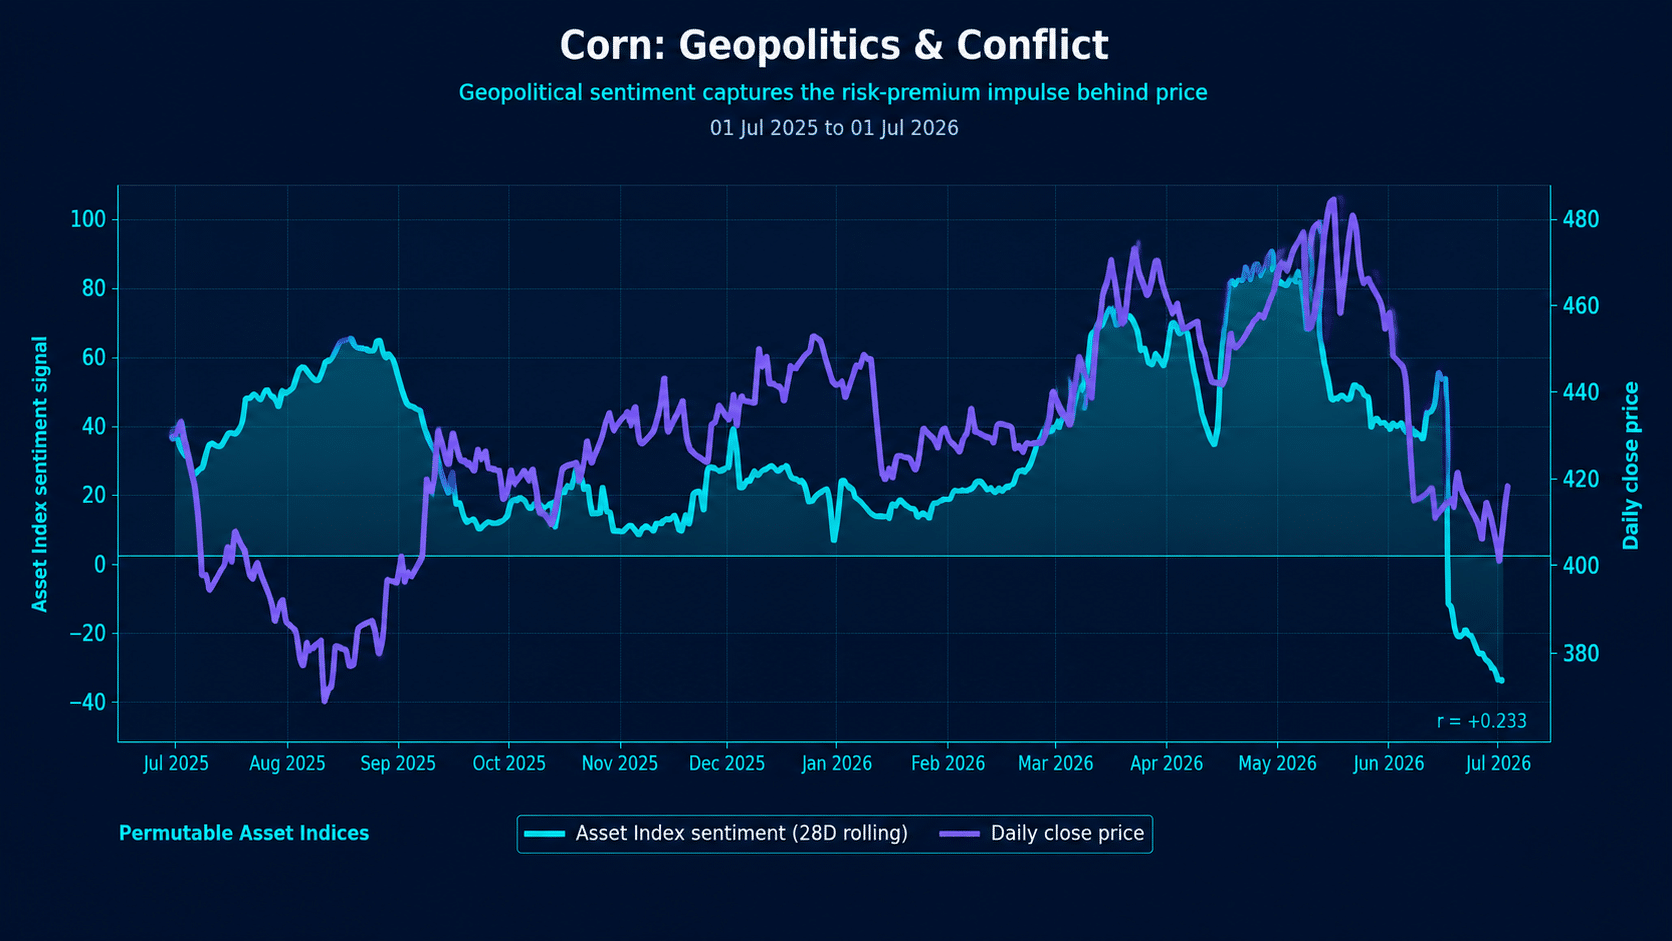
Historical observations reflect only the information available at their original timestamps, allowing the same signal structure to be examined historically and monitored in production.

  • Point-in-time history

    Each historical value reflects only the information available at that moment.

  • Source and processing timestamps

    See when information was published, captured and incorporated into a signal.

  • Versioned outputs

    Identify which production methodology generated each historical or live observation.

  • Consistent historical and live schema

    Move from research into monitoring without rebuilding fields or output structures.

Explore API delivery

FAQ

  • What does the agricultural commodities dataset contain?

    Permutable’s agricultural commodities dataset includes historical and live commodity-level indices, driver signals, event records and source-linked observations. Outputs can be organised by commodity, contract, geography, market driver, event type and direction of pressure, allowing users to move from an aggregate signal to the developments contributing to it.

  • Which agricultural commodities are covered?

    Coverage includes wheat, corn, soybeans, cocoa, coffee, sugar, cotton, palm oil, live cattle and lean hogs, alongside related agricultural markets and configurations. Signals can be analysed by individual commodity or compared across grains, oilseeds, soft commodities and livestock to identify divergence and cross-market transmission.

  • Which agricultural market drivers are tracked?

    Signals can be structured around weather conditions, crop health, acreage, yield expectations, harvest progress, export restrictions, trade flows, biofuel demand, feed demand, fertiliser and energy costs, freight, food inflation and geopolitical developments. These drivers can be monitored individually or combined to show how the balance of market pressure is changing.

  • How far back does the historical agricultural data go?

    Permutable provides long-run historical point-in-time intelligence for core agricultural commodity series. Exact availability may vary by commodity, contract, market driver and configuration and can be confirmed during the data-evaluation process.

  • Is the historical dataset strictly point in time?

    Yes. Historical observations are constructed using only the information available at their original timestamps. Events, source records and signal values are preserved without incorporating information published later, helping users evaluate historical behaviour without hindsight or look-ahead bias.

  • How frequently are agricultural signals and event records updated?

    Standard agricultural commodity indices are updated hourly. Event and source records are processed throughout the day, while delivery cadence can be configured around research, monitoring, alerting and production requirements.

  • Can users inspect the events and sources behind a signal?

    Yes. Users can access the source-linked events, headlines, entities, countries, regions, crops, market drivers and timestamps contributing to a signal. This allows teams to investigate why an indicator changed, distinguish isolated reports from persistent narratives and trace the evidence behind each historical or live observation.

  • How is agricultural commodities intelligence delivered?

    Agricultural commodities intelligence can be delivered through API, Excel, structured files and institutional data feeds. Historical and live outputs use a consistent schema, helping teams move from research and validation into monitoring or production without rebuilding the underlying data structure.

  • Can institutions evaluate sample agricultural commodities data?

    Yes. Institutions can request a defined event-window sample containing commodity and driver-level signals, source-linked events and example records. Samples can be structured around wheat, corn, soybeans, soft commodities, livestock or a specific market question involving weather, crop conditions, demand, trade, input costs or geopolitics.