See what is moving LNG before the market prices it

Turn global reporting on export outages, liquefaction and regasification infrastructure, cargo flows, freight, shipping routes, weather, sanctions and regional demand into structured LNG intelligence – with location, facility, route and driver-level signals, event records and the underlying sources behind every shift.
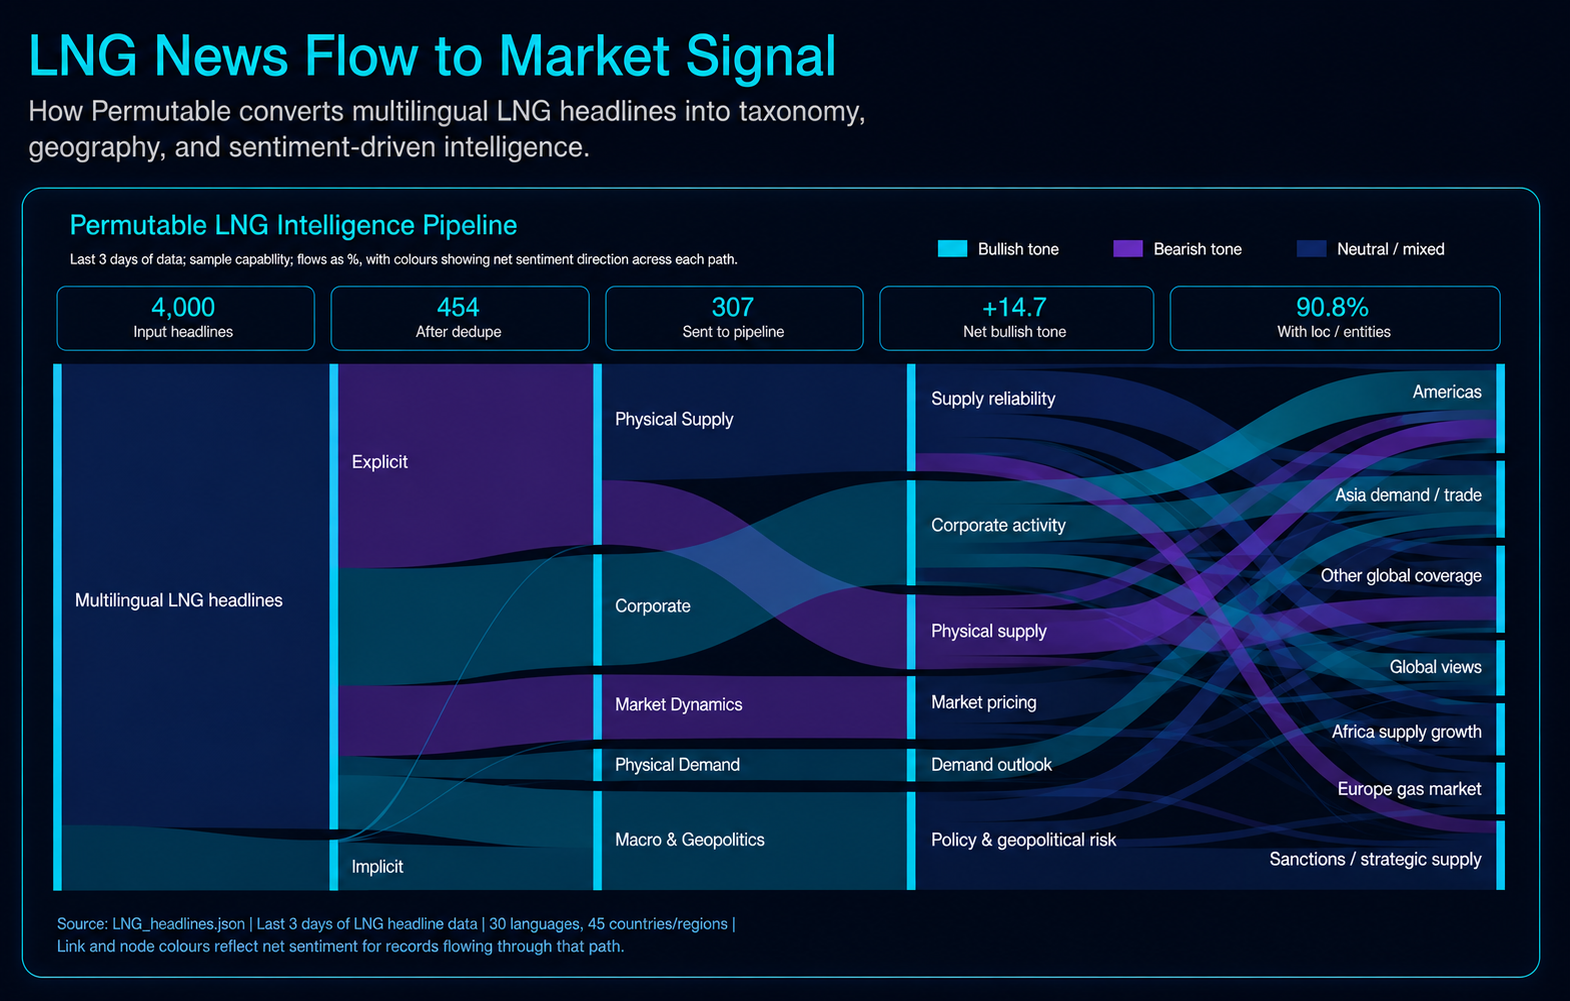

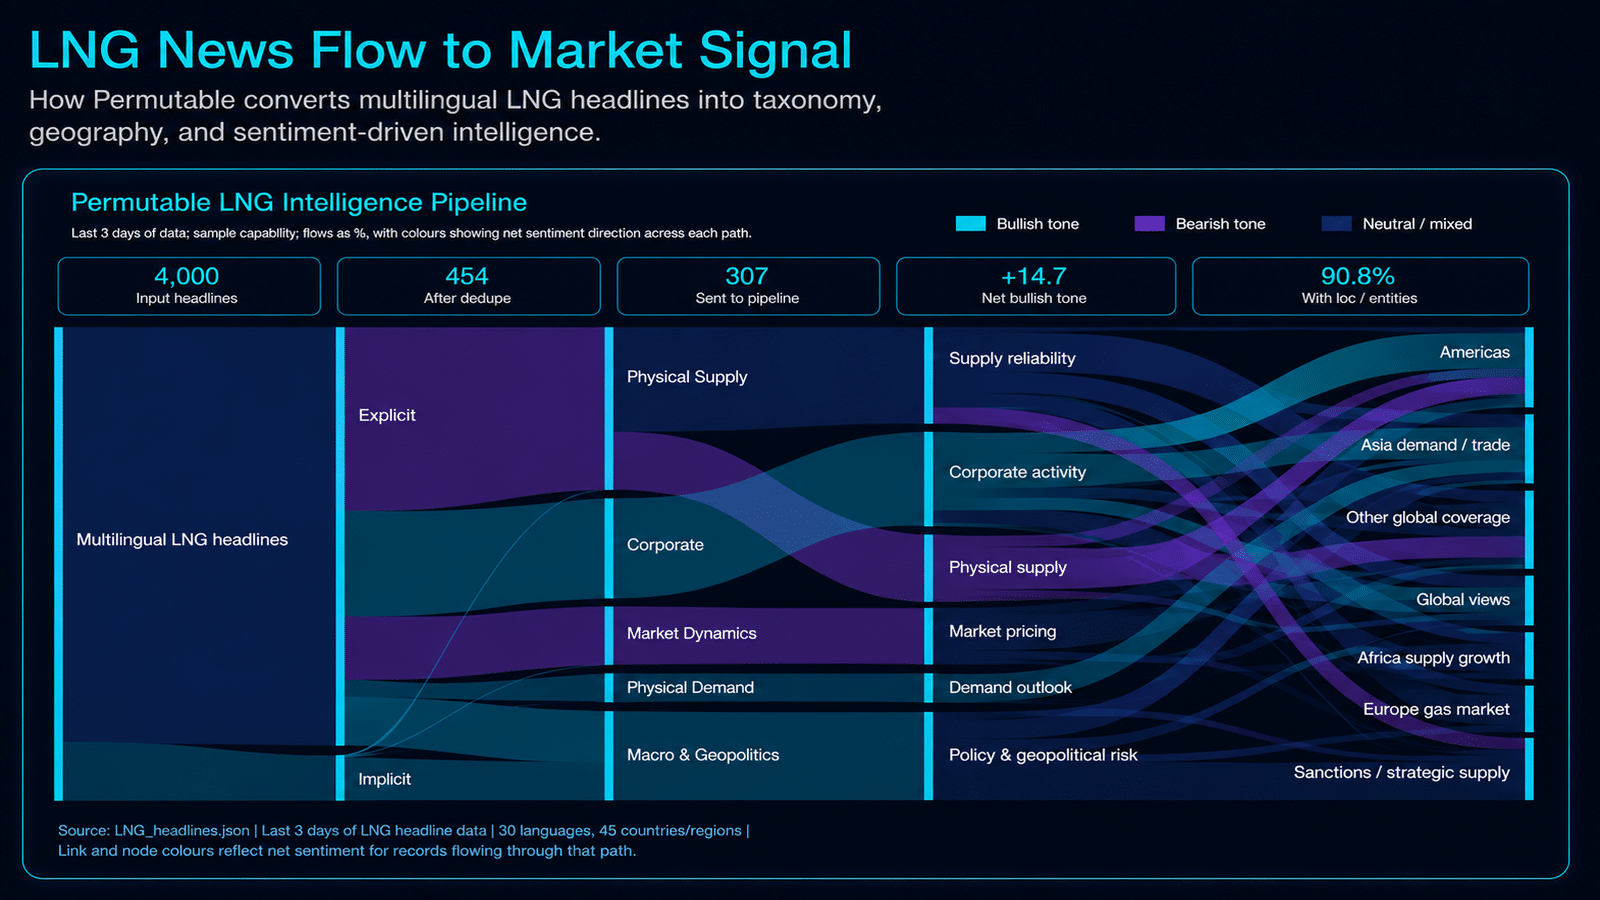
Permutable market intelligence dashboard showing how multilingual LNG headlines are transformed into structured market signals using AI. The Sankey diagram visualises the flow of news data through taxonomy classification, sentiment analysis, market drivers, and geographic impact categories. The dashboard highlights bullish, bearish, and neutral sentiment flows across LNG supply, pricing, demand outlook, geopolitical risk, and global market regions using a dark blue, cyan, and purple visualisation theme.
  • Export terminals, cargo flows and shipping routes
  • Supply, freight, demand and geopolitical drivers
  • Location, facility, driver and event-level outputs
  • API, Excel, files and institutional feeds
Request sample LNG data

LNG market change, structured for institutional workflows

What is measured? What explains the move? How is it used?
Location, facility and route-level indices Export outages, liquefaction, regasification, freight, shipping, weather, sanctions and regional demand Cargo-market research, monitoring, systematic models and risk workflows
Direction and magnitude Source-linked events and story development Historical replay, alerts, API, Excel and data feeds
Global supply regions and demand centres Narrative persistence, regional divergence and cross-market transmission Regional comparison, scenario analysis and custom configurations
Explore API delivery

See the signals shaping LNG market risk

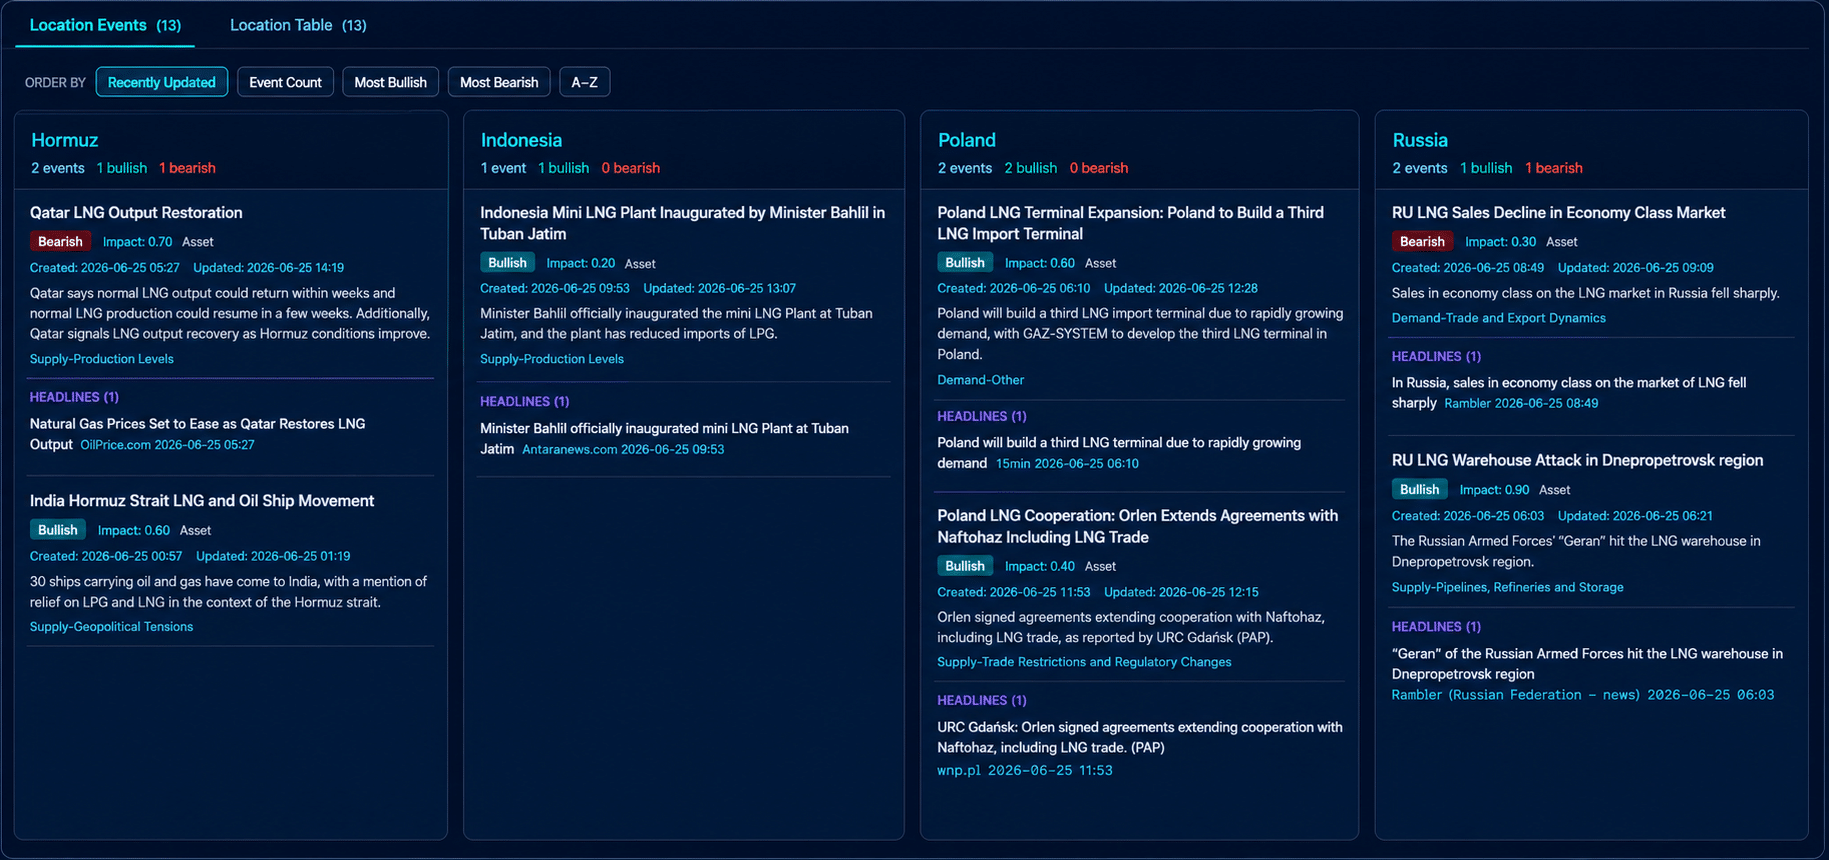
LNG market pressure develops differently across supply regions, transit points, infrastructure hubs and demand centres. Permutable shows where bullish and bearish signals are concentrated, which events are contributing and the source-linked evidence behind each location-level view.

Comparing pressure across LNG locations

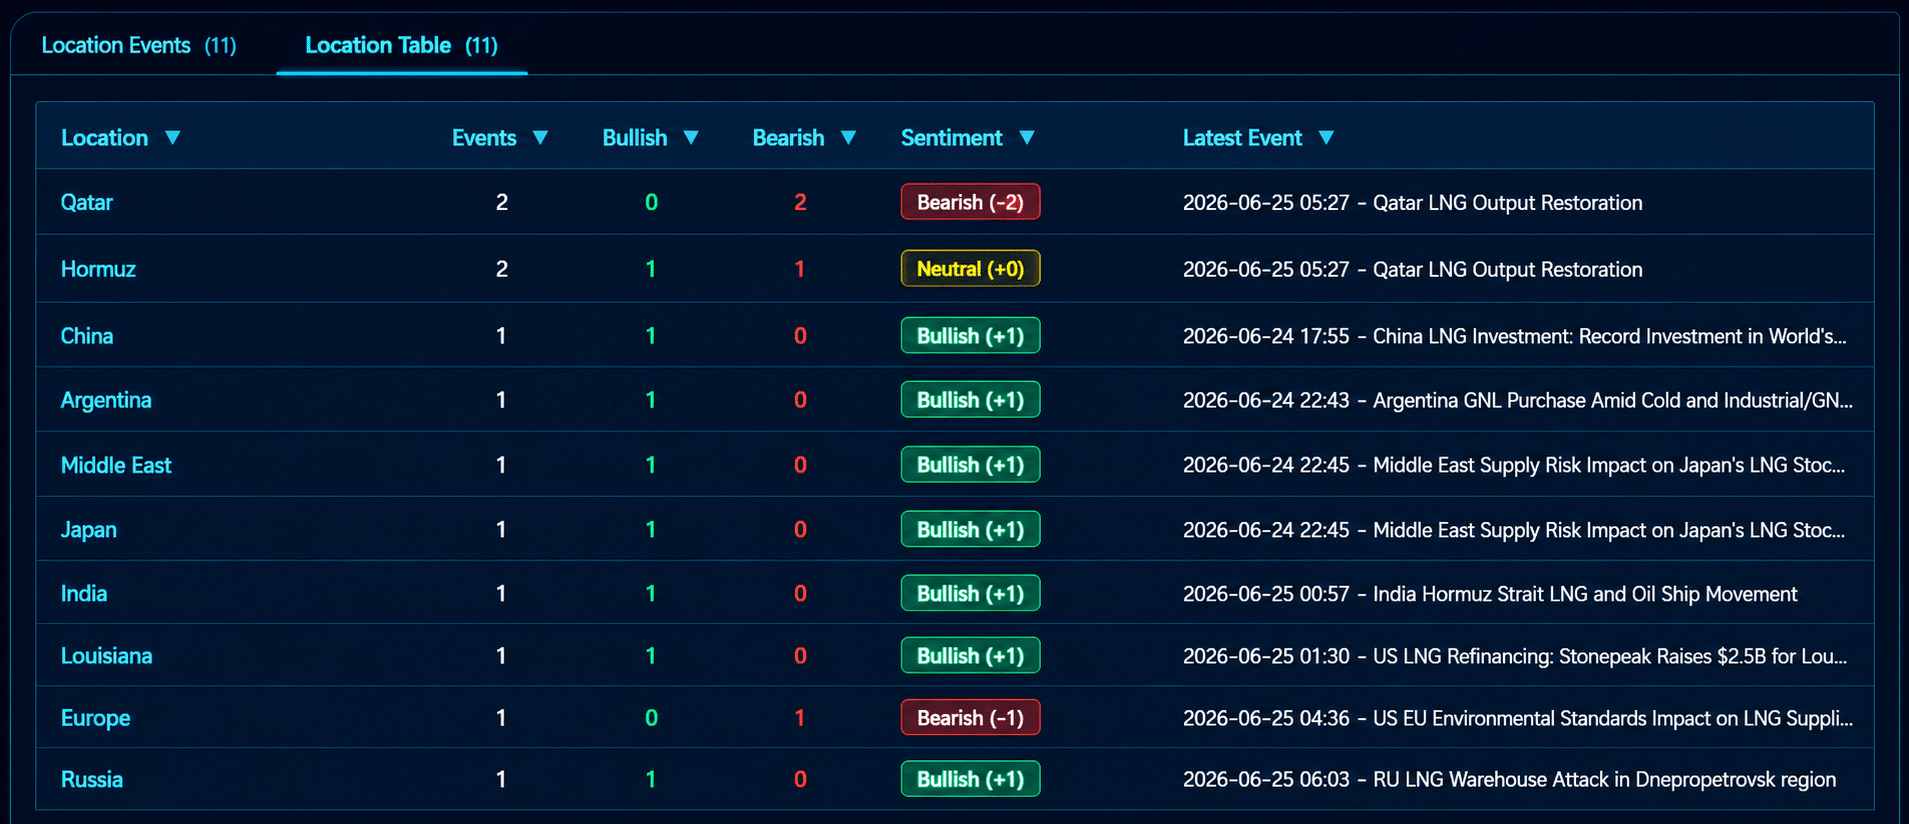
Permutable’s location table compares event counts, bullish and bearish contributions, net sentiment and the latest development across LNG supply regions, transit points, demand centres and infrastructure hubs. The snapshot makes it possible to compare where positive and negative pressure is concentrated without reducing the global LNG market to one aggregate score.

Signals shown: Event count, bullish events, bearish events, net sentiment and latest event

Locations shown: Qatar, Hormuz, China, Argentina, Middle East, Japan, India, Louisiana, Europe and Russia

Permutable LNG location sentiment visualisation ranking Qatar, Hormuz, China, Argentina, Japan, India, Europe and Russia by event count, bullish and bearish signals.
Inspect the underlying signals

Built to be evaluated without hindsight

Historical observations reflect only the information available at their original timestamps, allowing the same signal structure to be examined historically and monitored in production.

  • Point-in-time history

    Each historical value reflects only information available at that moment.

  • Source and processing timestamps

    See when information was published, captured and incorporated into the signal.

  • Versioned outputs

    Identify which production methodology generated each historical or live observation.

  • Consistent historical and live schema

    Move from research into monitoring without rebuilding fields or output structures.

Request full methodology

Fragmented LNG information, structured into auditable signals

Conventional workflow With Permutable
LNG headlines disconnected from locations, facilities and routes Location, facility, route and driver-level signals
One generic global LNG sentiment score Separate export, freight, shipping, demand, infrastructure and geopolitical series
No clear evidence behind a signal movement Source-linked events, headlines and timestamps
Market developments difficult to compare across regions Consistent location and regional signal structures
Historical analysis vulnerable to hindsight Strict point-in-time construction
Manual monitoring across multiple sources API, Excel, files and institutional feeds
Request sample LNG data

FAQs

  • What does the LNG dataset contain?

    Permutable’s LNG dataset includes location, facility, route and driver-level signals, event records and source-linked observations. Outputs can be organised by supply region, demand centre, facility, shipping route, market driver and direction of pressure, allowing users to examine both aggregate conditions and the developments contributing to them.

  • Which LNG regions, facilities and routes are covered?

    Coverage can be structured around major LNG supply regions, demand centres, liquefaction and regasification facilities, shipping routes and transit points. Configurations may also focus on specific countries, terminals, companies, routes or regional market relationships.

  • Which LNG drivers are tracked?

    Signals can be structured around export outages, liquefaction and regasification capacity, cargo flows, shipping disruption, freight constraints, sanctions, weather, infrastructure risk, Asian demand, European gas conditions and geopolitical developments. Drivers can be monitored separately or combined to show how the balance of market pressure is changing.

  • Is the historical LNG dataset strictly point in time?

    Yes. Historical observations are constructed using only the information available at their original timestamps. Events, source records and signal values are preserved without incorporating information published later, helping users evaluate historical behaviour without hindsight or look-ahead bias.

  • How frequently are LNG signals and event records updated?

    Standard LNG signals are updated throughout the trading day, while event and source records are processed as new information becomes available. Delivery cadence can be configured around research, monitoring, alerting and production requirements.

  • Can users inspect the events and sources behind an LNG signal?

    Yes. Users can access the source-linked events, headlines, entities, locations, facilities, routes, topics and timestamps contributing to a signal. This makes it possible to investigate why an indicator changed, distinguish isolated reports from persistent narratives and trace the evidence behind each historical or live observation.

  • How is LNG intelligence delivered?

    LNG intelligence can be delivered through API, Excel, structured files and institutional data feeds. Historical and live outputs can use a consistent schema, helping teams move from research and validation into monitoring or production without rebuilding the underlying data structure.

  • Can Permutable create custom LNG configurations?

    Yes. We can create customised indices, location groups, facility groups, shipping-route views, market drivers and event configurations. These can be designed around particular supply regions, demand centres, terminals, companies, transit points or institutional workflows.

  • Can institutions evaluate sample LNG data?

    Yes. Institutions can request a defined LNG event-window sample containing location and driver-level signals, source-linked events and example records. Samples can be structured around export disruption, infrastructure outages, shipping risk, freight, regional demand or another relevant LNG market question.