Validated sentiment alpha for systematic trading

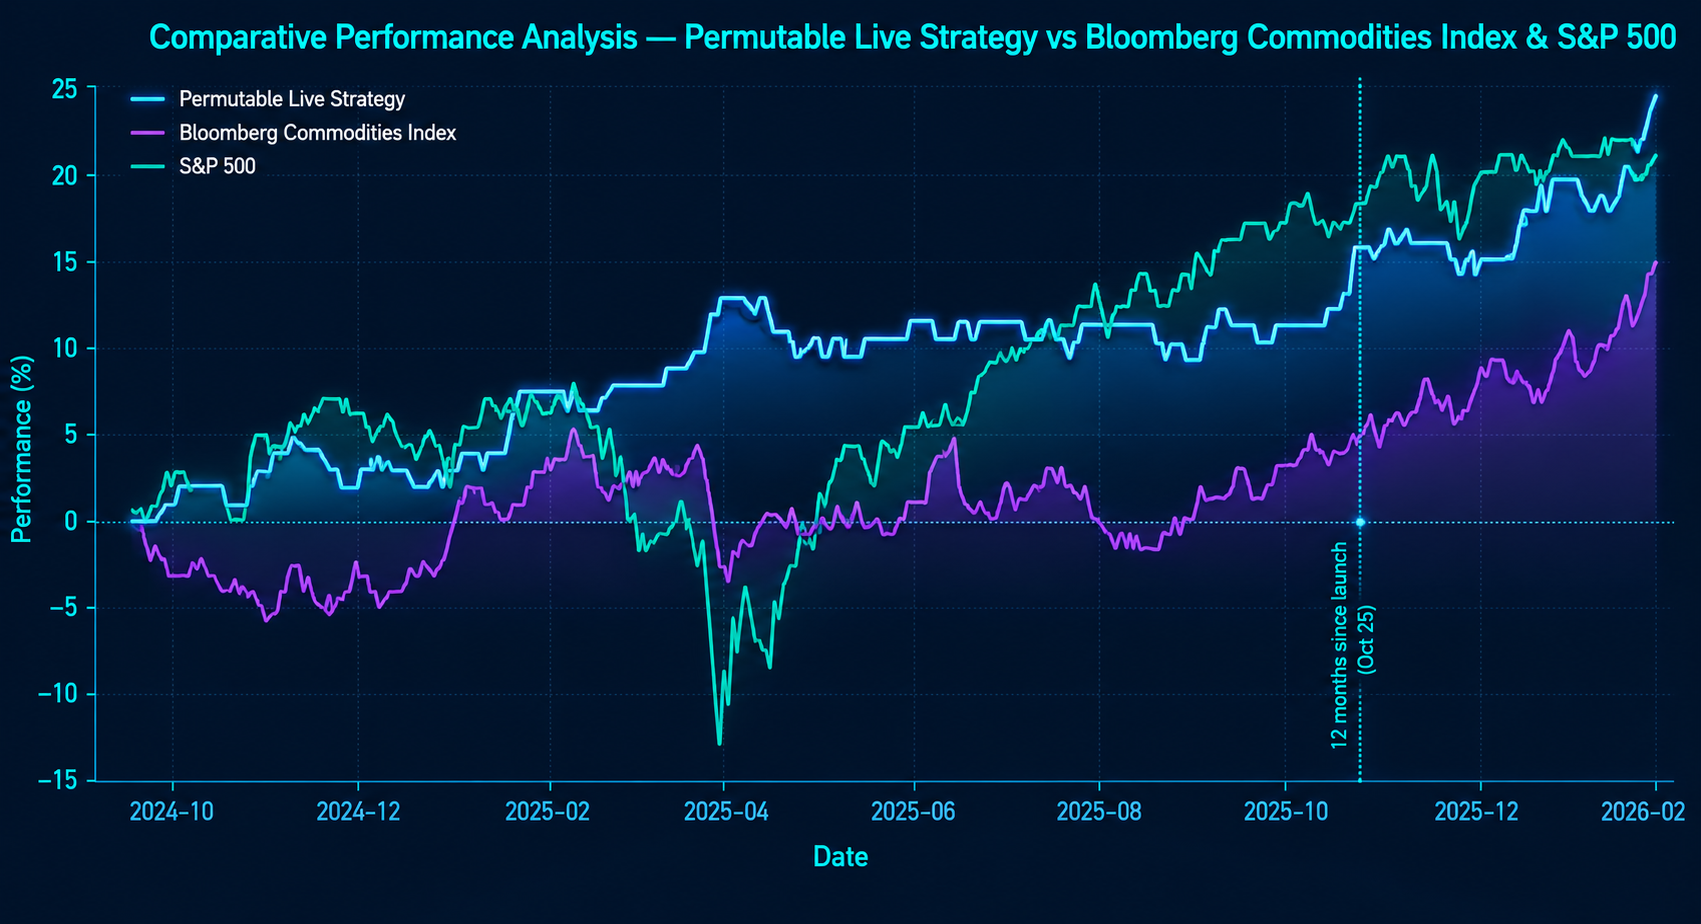
Permutable’s proprietary market sentiment signals have been tested in live trading conditions across a 16-month commodities futures experiment, delivering 28.54% total return, 20.86% annualised return, 7.01% annualised volatility and a maximum drawdown of just -2.95%.

Built from AI-driven market intelligence and deep sentiment analysis, our signals are designed for institutional systematic traders seeking differentiated, low-beta data inputs across highly liquid global futures markets. Whether you are looking to integrate our data into your own systematic strategy, evaluate our signal performance, or explore running a book together, we would welcome a conversation.

For institutional enquiries, email enquiries@permutable.ai

Dark-themed performance comparison chart showing Permutable's Live Strategy, Bloomberg Commodities Index, and S&P 500 from October 2024 to February 2026. The Permutable strategy, displayed in bright cyan, outperforms the Bloomberg Commodities Index and closely tracks the S&P 500, ending with approximately 24% returns. The chart includes a marker highlighting the 12-month anniversary since launch and demonstrates the effectiveness of AI-powered market intelligence and narrative-driven trading signals.

16 months of live signal validation

If you are an allocator or would like to see a full breakdown of our results please email enquiries@permutable.ai

Metric Permutable S&P 500 BCI
Total Return 28.54% 21.50% 18.69%
Annualized Return 20.86% 15.83% 13.80%
Annualized Volatility 7.01% 17.47% 12.78%
Downside Volatility 4.45% 18.50% 13.18%
Max Drawdown -2.95% -19.25% -10.15%
Best Day 3.07% 7.81% 3.41%
Worst Day -1.19% -6.39% -4.51%

Validated metrics

  • 28%

    Total Return

  • 20%

    Annualized Return

  • 7%

    Annualised Volatility

  • 2.95%

    Maximum Drawdown

Strategy profile

  • Strategy Structure: Balanced long/short (50/50) exposure
  • Trading Universe: Highly liquid front-month futures across commodities
  • Beta versus Benchmarks: Low
  • Edge versus Benchmarks : ~16% Annualised
  • Risk Allocation: Evenly distributed VaR across global energy, agriculture, and metals markets

Strategic Direction Post-Experiment: Permutable continues the run the data business model with our clients. We look to identify, isolate and preserve edge.