Yesterday, our Trading Co-Pilot identified an important shift in media sentiment surrounding crude oil fundamentals that successfully anticipated the subsequent rebound in Brent and gasoline contracts. In its LLM-driven oil market analysis, it predicted the moves that caused both to return to the upper boundary of last week’s trading range, validating our sentiment-based approach to market timing.
Market sentiment indicators as leading price predictors
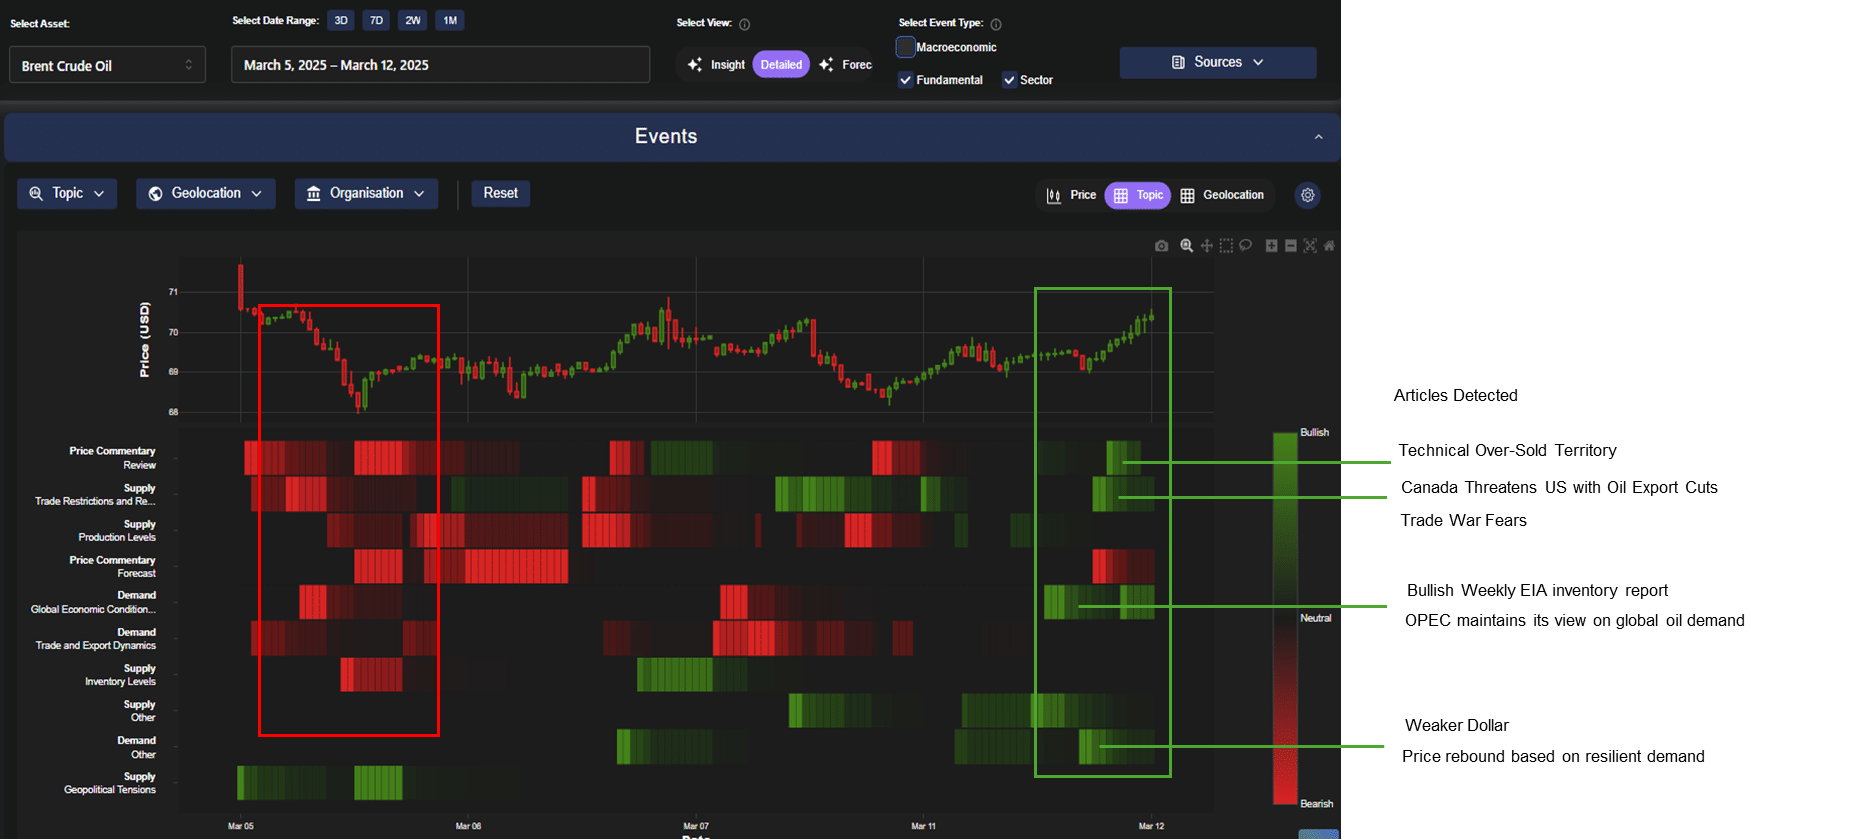
Our proprietary sentiment indicators within our Trading Co-Pilot demonstrated a marked transition from bearish to bullish across multiple factors between March 11-12. This transition preceded the price action by approximately 24 hours, providing traders using our tool with a significant timing advantage. Our oil market analysis clearly shows the sentiment heat map displaying clustering of green sentiment bars forming after a sustained period of red, with particular strength in the Supply Inventory Levels and Technical categories (see chart above).
What makes this shift particularly noteworthy is the breadth of the sentiment change. Unlike isolated sentiment indicators that often produce false signals, we observed coordinated shifts across fundamentals, technicals, and geopolitical factors through our Trading Co-Pilot – a powerful combination that has historically preceded sustainable price movements.
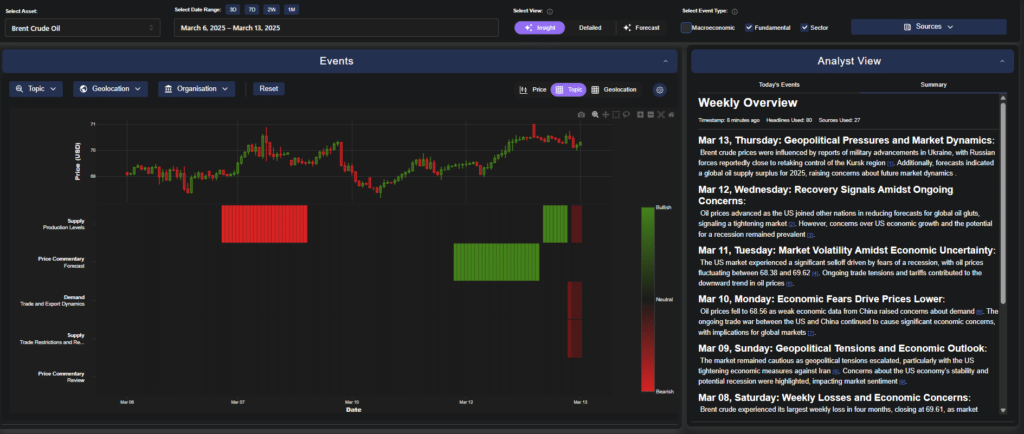
Above: Oil market analysis rebound by topic: Analyst Insight mode
Technical structure analysis
From a market structure perspective, Brent crude displayed clear evidence of accumulation following the March 10 decline. The price action formed a classic “spring” pattern at the 68.36 level, violating previous support before rapidly recovering – a textbook indicator of institutional buying interest.
The volume profile during this period reveals steadily increasing participation on up-days compared to diminishing volume on down-days, creating a bullish divergence that sophisticated traders recognise as accumulation. Thorough oil market analysis of the technical oversold condition, as highlighted in our Articles Detected panel, created the necessary conditions for this reversal pattern to manifest.
Fundamental catalysts triggering the reversal
Several fundamental catalysts coincided with the sentiment shift, as our oil market analysis reveals:
Geopolitical premium reassessment
Reports of military advancements in Ukraine, specifically Russian forces approaching the Kursk region, introduced a risk premium that was initially under-priced.
Supply constraints emerging
Gasoline prices responded sharply to reports indicating a draw in U.S. stocks, with our dashboard showing prices increased to 2.15 as market participants reacted to tightening supply conditions.
Trade flow recalibration
As Canada threatened US with oil export cuts this introduced a fresh supply variable previously not factored into prices as a sentiment driver. Simultaneously, reports of Russian oil supplies to India recovering suggested trade flow adjustments that could tighten Atlantic Basin balances.
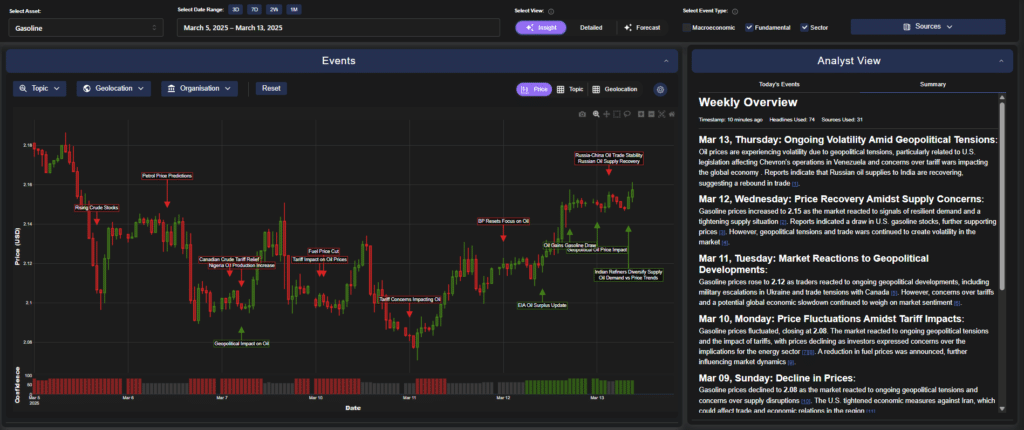
Above: Oil market analysis rebound by event: Analyst Insight mode
Demand variables in flux
Our Trading Co-Pilot’s comprehensive oil market analysis showed that while supply factors dominated the sentiment shift, demand indicators presented a more nuanced picture. Our system flagged economic fears driving prices lower, with Chinese demand concerns remaining at the forefront. However, this was then offset by the price rebound when our sentiment indicator turning positive on March 12.
This dynamic tension between supply bullishness and demand uncertainty explains the measured nature of the rally – strong enough to return prices to the upper trading range but insufficient to trigger a breakout above established resistance.
Temporal analysis and path dependency
The sequencing of sentiment shifts proved key in our Trading Co-Pilot’s oil market analysis. Our temporal analysis shows the initial weaker dollar sentiment shift that preceded and likely catalysed the subsequent bullish weekly EIA inventory report response. This path dependency of sentiment factors demonstrates how initial catalysts can create cascading sentiment effects that ultimately drive prices.
Our Trading Co-Pilot system’s success in detecting this sentiment shift before price action materialised perfectly highlights the advantage of using our technology in increasingly volatile energy trading. Its advantage lies in being able to process vast quantities of unstructured sentiment data, which is becoming as key as traditional oil market analysis methodologies.
Experience the Trading Co-Pilot advantage
Don’t just take our word for it – see the power of predictive sentiment analysis in your own trading strategies. Our complimentary 14-day enterprise trial gives your trading desk full access to the Trading Co-Pilot dashboard, including real-time sentiment heat maps across 42 energy market factors, predictive alerts 12-24 hours before major price movements, custom sentiment threshold configurations for your specific trading parameters, direct API integration with your existing trading systems, and historical backtesting against your previous trading positions.
Arrange a 39-minute personalised demonstration where we will apply our Trading Co-Pilot to your specific trading instruments and show how recent trades could have been optimised using our sentiment indicators. Simply email us at enquiries@permutable.ai or fill in the form below.