Climate change is one of the most pressing issues of our time, and businesses have a crucial role to play in addressing it. As companies strive to become more sustainable and meet Net Zero goals, it is vital that they measure and report their carbon emissions accurately and transparently.
But beyond the businesses themselves, there is an ever increasing cohort of stakeholders who also want to access ti high quality corporate carbon emissions data. Let’s take a closer look at the stakeholders involved.
Corporates
Investors
Investors are increasingly looking for companies that are transparent about their carbon emissions and are taking action to reduce their impact on the environment. Access to high quality data on carbon emissions can help build investor confidence in a company’s environmental performance.
Customers
Meanwhile, customers are becoming more conscious of the environmental impact of the products and services they consume. They are interested in the carbon emissions data of the companies they do business with, and may choose to support companies that have lower emissions or are making efforts to reduce their carbon footprint.
NGOs
The above is often largely informed by the work of NGOs and advocacy groups through their advocacy work for stronger climate policies and lobbying to hold companies accountable for their environmental impact.
Employees
The same is true of many employees, particularly the younger generation, who are increasingly interested in working for companies that are socially and environmentally responsible. Carbon emissions data is a key indicator of a company’s sustainability performance, and employees may be more attracted to companies that report their emissions and have a clear sustainability strategy in place.
Regulators
For regulators, such as government agencies, access to high quality carbon emissions data is integral to their work in developing policies and regulations to address climate change as well as monitoring compliance with existing regulations and to enforce penalties for non-compliance.
Introducing our corporate carbon emissions dashboard
8 things you can do with our carbon emissions data
Key features of our corporate emissions dashboard
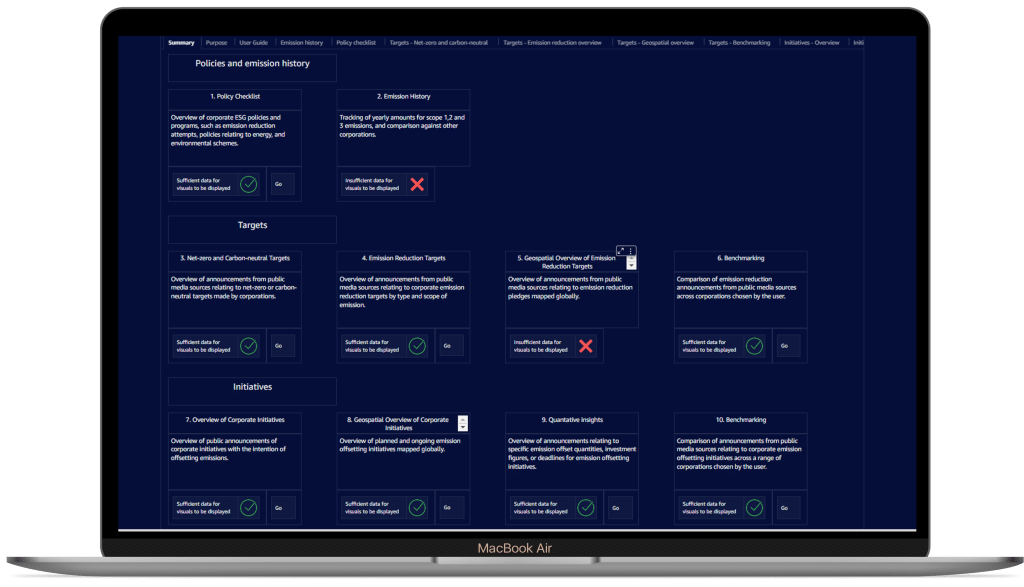
The dashboard provides detailed insights 20,000 corporate entities that range from large corporates to SMEs in three sections:
Emission policies and history
The policies, targets and actions related to emissions ongoing at the company. It includes in depth statistics of yearly scope emission quantities.
Emission targets
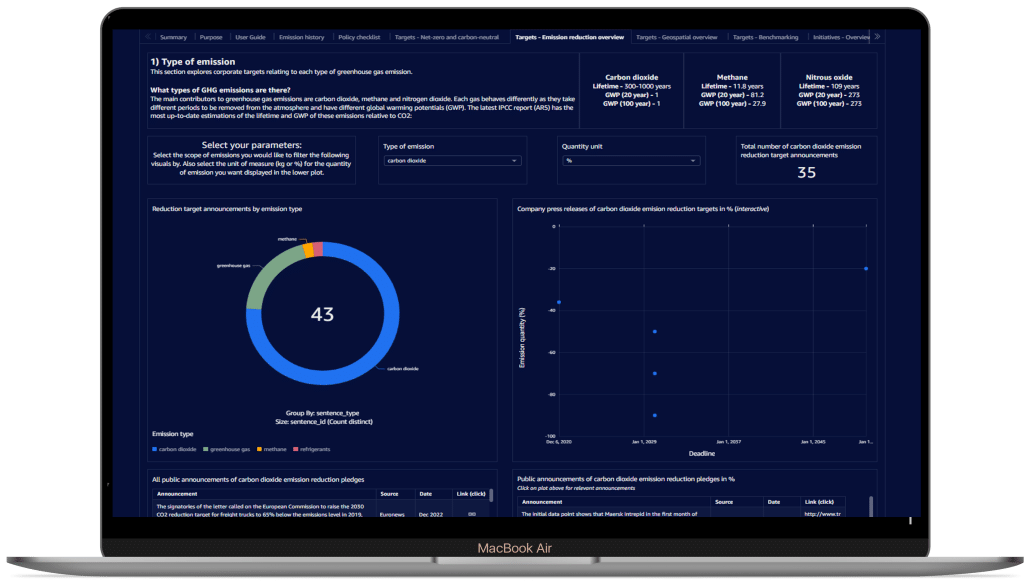
Announcements of future emission reduction targets, including net-zero and quantitative-based targets.
Offsetting initiatives
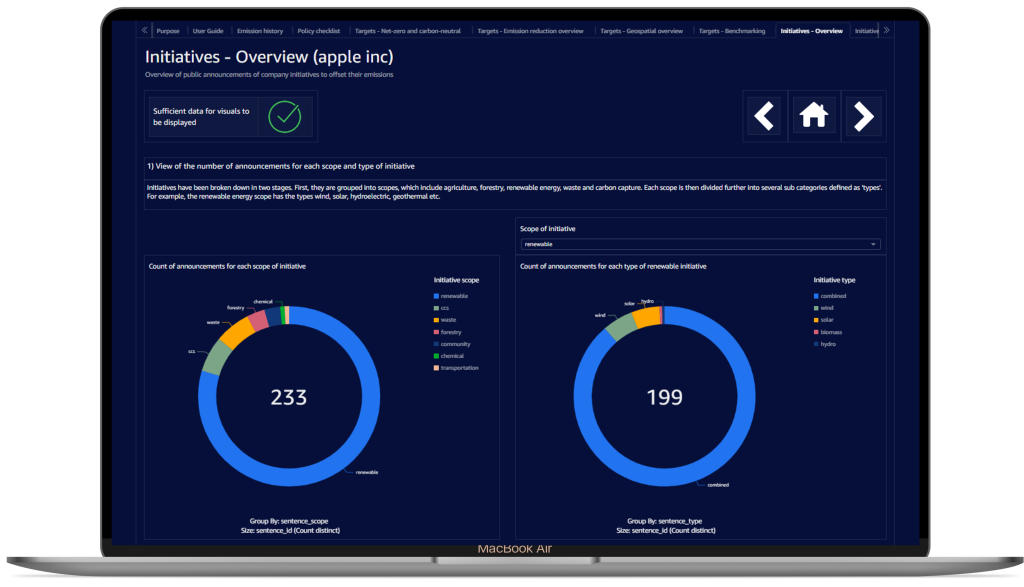
Announcements of future and ongoing emission offsetting initiatives.
The combination of these three sections gives a deep understanding of its past emissions, and how it is looking to reduce/offset these in the future. Multiple different cloud-based data sources have been pooled together to create one streamlined dashboard that covers all bases for corporate emissions analysis.
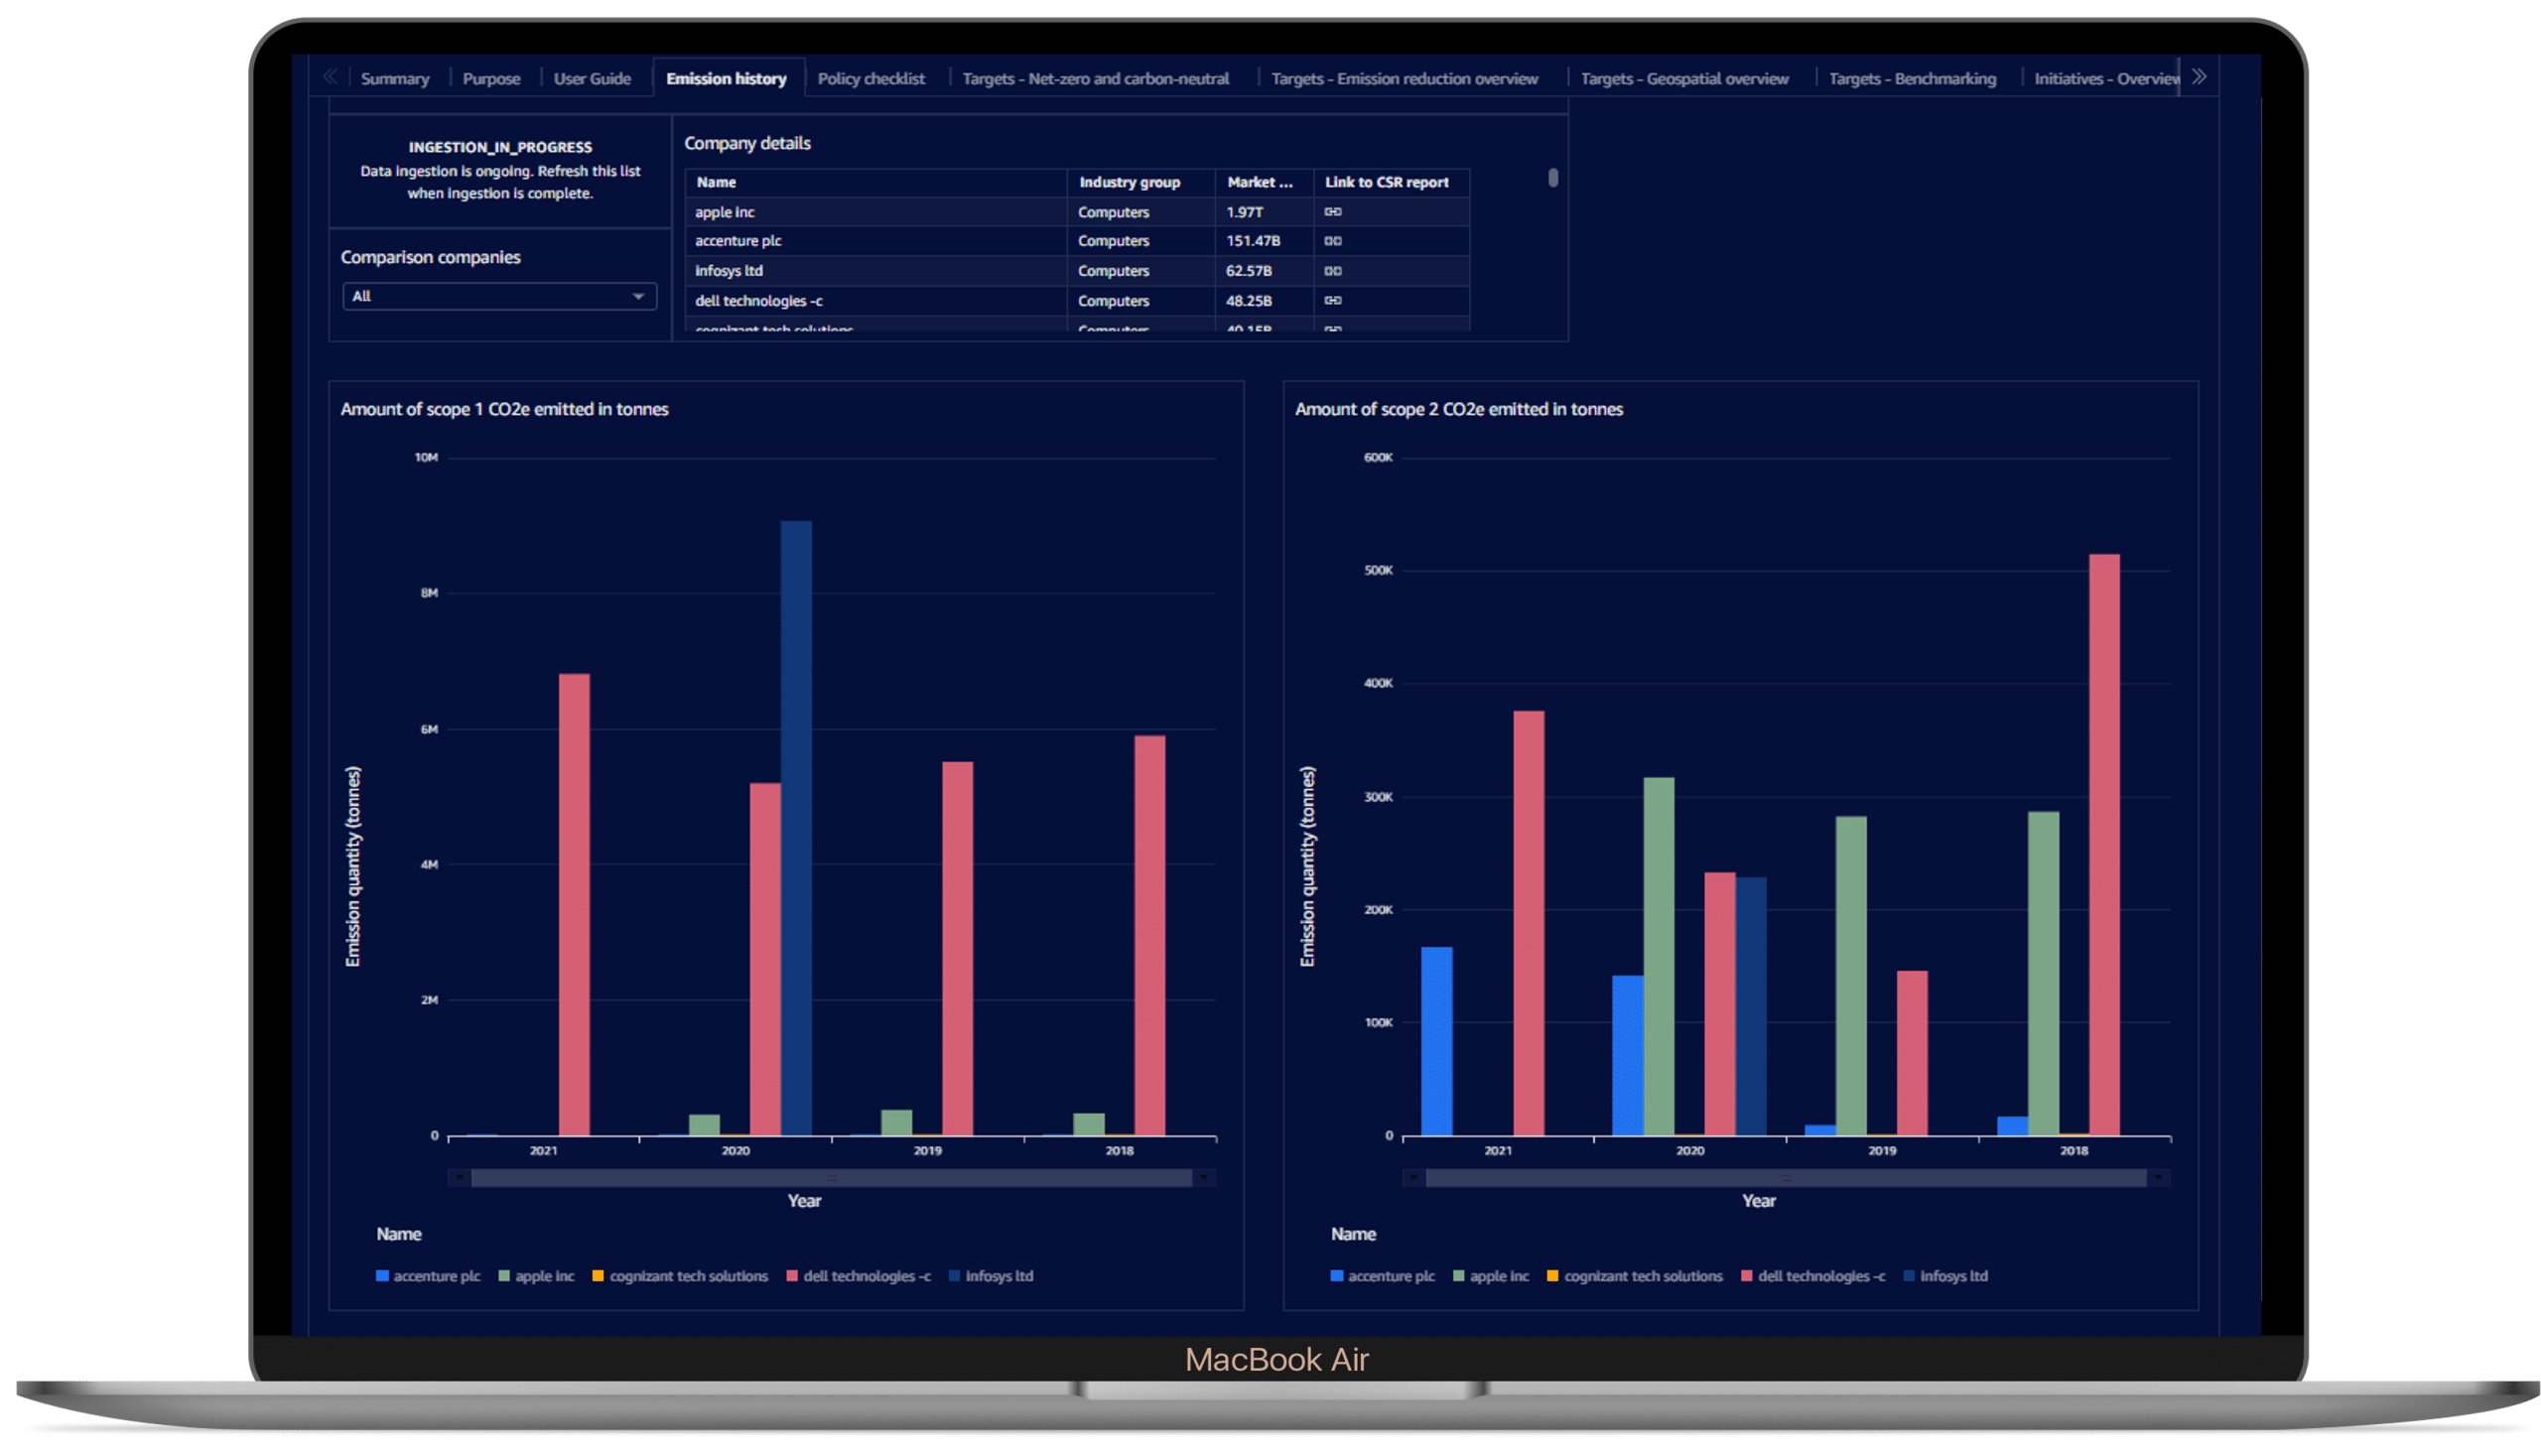
1. Examine historical emissions
The dashboard includes a rich dataset of historical emissions across 1000s of corporate entities. This includes detailed scope 1, 2 and 3 emission statistics.

2. View ESG policy checklists
A checklist is available that indicates whether the selected company has shown evidence of adopting a particular policy, target or action. These include energy efficiency policies, emission reduction targets, and policies set for the supply chain.
3. Access quantitative data
Announcements for initiatives relating to offsetting. Quantities have been extracted from announcements and visualised to provide an alternative way for users to view data. Investment figures and emission quantities can be compared for individual instances.

4. Review industry benchmarking
Allows users to compare statistics between companies in fluid visualisations, to gain an understanding of how a company appears relative to its competitors.
5. Analyse company emissions reduction targets
A section of the dashboard is dedicated to corporate announcements of emission reduction targets. There is analysis of specific net-zero and carbon-neutral targets, as well as quantitative targets. The targets can be analysed according to the type of emission (eg. CO2, general greenhouse gas) or scope of emission.

6. Inspect offsetting initatives
Announcements for initiatives relating to offsetting corporate emissions can be visualised according to user customisation. For example, the user can filter to display only renewable or CCS projects. Users can also drill down into the specific announcement if they wish to explore the initiative in further detail.
7. Understand provenance of data
There is metadata to hand for each announcement in the targets and initiatives datasets, such as the source, date of announcement and link to the source from which the data was extracted. From this users can understand the provenance of the source.
8. Conduct geo-spatial analysis
Mapping software allows users to visualise data as it appears across the globe. Emission targets and offsetting initiatives are mapped globally, with interactive plots enabling users to identify specific announcements on the map.
