*This article is aimed primarily at professional traders, portfolio managers, commodity traders, and institutional investors and explain how our AI-powered market intelligence platform can help traders and portfolio managers understand complex market dynamics using seven specific use cases.
Market volatility has reached new heights in recent month, creating unprecedented challenges for those navigating market dynamics under Trump 2.0. The fall out from the rapid pace of information flow, geopolitical uncertainties, and complex intermarket relationships demands sophisticated AI-driven tools that can process and analyse vast amounts of data and deliver actionable insights in real-time.
At Permutable AI, we have responded to this need with our Trading Co-Pilot, a state-of-the-art LLM-based agentic market analysis system that’s garnering attention from top commodity houses and some of the world’s largest systematic funds. Having been voted among the top 100 AI fintechs in 2023, our award-winning research and development team has developed a solution that addresses challenges not currently met by traditional market analysis tools. With that, let’s explore seven ways our Trading Co-Pilot and data feeds can be used in navigating market dynamics.
Table of Contents
Toggle1. Real-time thematic decoupling for clearer market signals
One of the most challenging aspects of navigating market dynamics is distinguishing between overlapping themes and drivers. Our Trading Co-Pilot excels at this through continuous analysis that effectively de-couples key layered themes affecting prices.
For instance, when looking at crude oil markets, our system identifies and separates distinct drivers such as geopolitical tensions, supply constraints, and technical factors. This thematic decoupling enables traders to understand not just what is moving the market, but why it’s moving, which is key for making informed decisions. This capability is particularly valuable when multiple narratives compete for attention, as was evidenced in our recent analysis of Brent crude, where supply concerns from the Iraq-Turkey pipeline disruption were isolated from broader market sentiment.
2. Geo-located event mapping across global markets
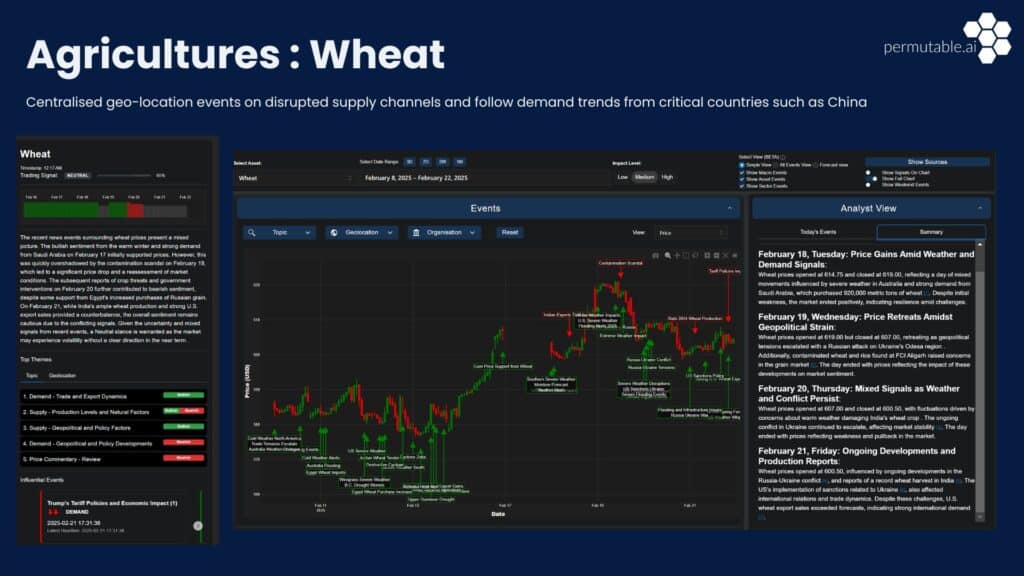
In a world where events in one region can have cascading effects globally, understanding geographical impacts is essential for effectively navigating market dynamics. Our Trading Co-Pilot centralises geo-location events, providing a visual representation of how regional developments influence market prices.
This feature proves especially valuable for assets like wheat, where our system tracks disrupted supply channels while simultaneously monitoring demand trends from critical countries such as China. By mapping these relationships visually, traders can quickly identify which regions are driving price movements and anticipate potential ripple effects across interconnected markets.

Above: Navigating market dynamics using Geo-Location decoupling on our Trading Co-Pilot: Wheat
3. Sector-specific intelligence with customised taxonomies
Fundamentally, different asset classes respond to different drivers, which is why we’ve developed specialised taxonomies for each market sector. Whether you’re trading agricultural commodities, energies, metals, or currencies, our Trading Co-Pilot calibrates its analysis to the specific factors that matter most within that sector.
For example, within natural gas, our AI agent focuses on US-centric drivers such as weather patterns and storage data for Henry Hub contracts, while our currency analysis incorporates broader macroeconomic factors like interest rate differentials. This sector-specific approach ensures that you’re always receiving the most relevant insights for the markets you’re navigating.
4. Unified market overview with dynamic relationship tracking
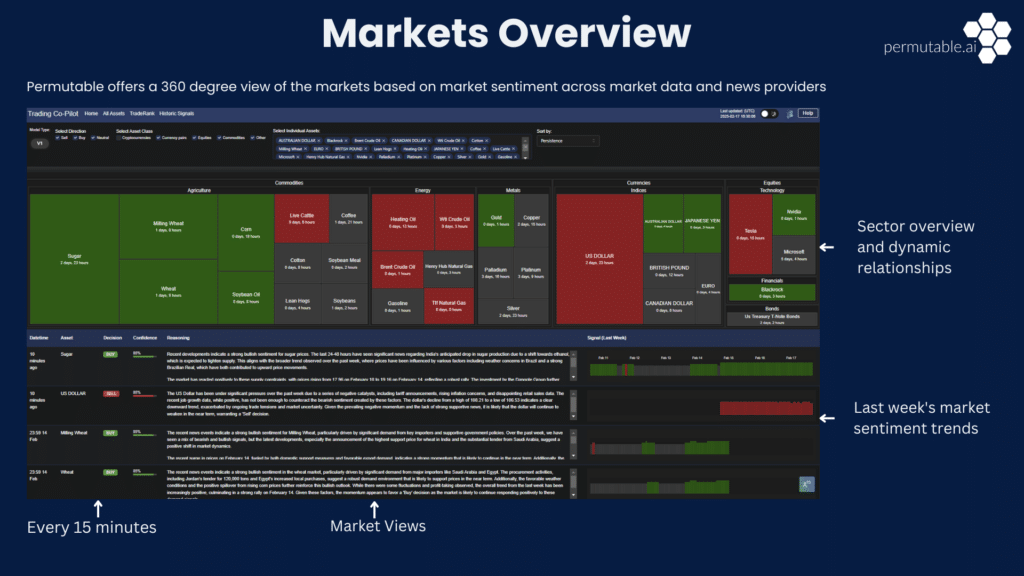
Navigating market dynamics successfully means understanding not just individual assets but how they relate to one another. Our Market 360 overview feature provides a comprehensive 360-degree view based on sentiment across various data and news sources, updated every 15 minutes.
The system visually maps sector relationships and trends, helping traders spot divergences and correlations that might otherwise remain hidden. For instance, our recent analysis highlighted the relationship between a weakening dollar, declining crude prices, and rallying agricultural markets – connections that can be instrumental for developing effective cross-asset trading strategies.

Above: Spotting asset correlations and divergences using our Market 360 feature
5. Adaptive theme mapping for evolving market narratives
Markets are constantly evolving, with dominant narratives shifting as new information emerges. Our Trading Co-Pilot adapts to these changes through dynamic theme mapping that tracks how different factors gain or lose influence over time.
For gold, this means monitoring how the balance between inflation concerns, safe-haven demand, and interest rate expectations shifts day by day. For crude oil, it means tracking the relative importance of geopolitical tensions versus inventory data. This adaptive approach ensures you’re always focused on what’s currently driving prices, rather than being anchored to outdated narratives.
6. Sentiment analysis with confidence indicators
When navigating market dynamics, understanding the conviction behind market movements can be as important as the direction itself. Our Trading Co-Pilot incorporates sophisticated sentiment analysis that not only identifies bullish or bearish trends but also measures their strength and reliability.
Each market insight comes with visual indicators showing confidence levels and potential impact, helping traders differentiate between strong signals and market noise. This feature proves particularly valuable during periods of high volatility, when distinguishing meaningful trends from temporary fluctuations becomes especially challenging.
7. Integrated event tables for contextual understanding
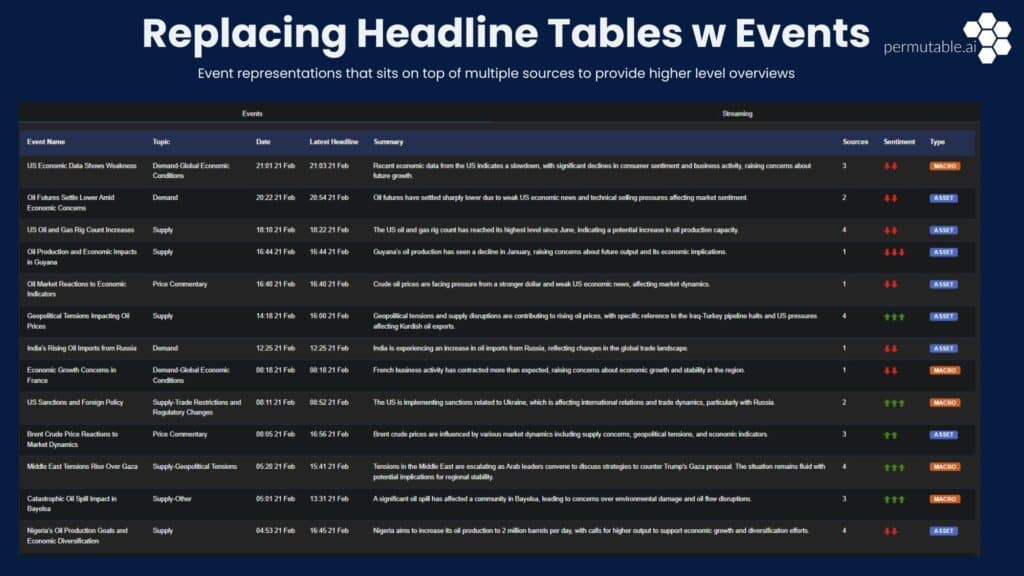
Rather than presenting disconnected headlines, our system synthesises information into coherent event representations that provide higher-level overviews. These event tables connect related developments, showing how they collectively influence market sentiment and price action.
This contextual approach to information helps traders see the bigger picture when navigating market dynamics, identifying how seemingly disparate events might be part of broader economic or geopolitical patterns. By organising information this way, our Trading Co-Pilot helps to surface more nuanced and comprehensive market perspectives.

Using our Trading Co-Pilot to get a higher level overview of market dynamics through event representations
The future of navigating market dynamics is here
As financial markets grow increasingly complex, having sophisticated tools for navigating market dynamics is no longer a luxury but a necessity. Our Trading Co-Pilot represents the cutting edge of what’s possible with next gen technologies combine into a single powerful solution.
Our commitment to continuous innovation means we’re constantly enhancing these capabilities with new roll outs taking place on a continuous basis, helping traders and analysts stay ahead in an ever-evolving landscape. Whether you’re managing risk, seeking opportunities, or simply trying to make sense of turbulent markets, our Trading Co-Pilot provides the clarity and insight needed to navigate with confidence.
Contact our team today at enquiries@permutable.ai or simply fill in the form below to discover how our award-winning technology can be implemented within your strategy.
