Turn global reporting into structured commodity intelligence – with live and historical asset and contract-level indices, driver signals, events and source-level evidence across energy, metals and agriculture.
Built for systematic research, market monitoring, cross-commodity analysis and institutional workflows.
Commodity markets respond to different combinations of physical supply, demand, inventories, policy, weather and geopolitical risk. Permutable applies a consistent intelligence structure across markets while preserving the distinct drivers of each commodity.
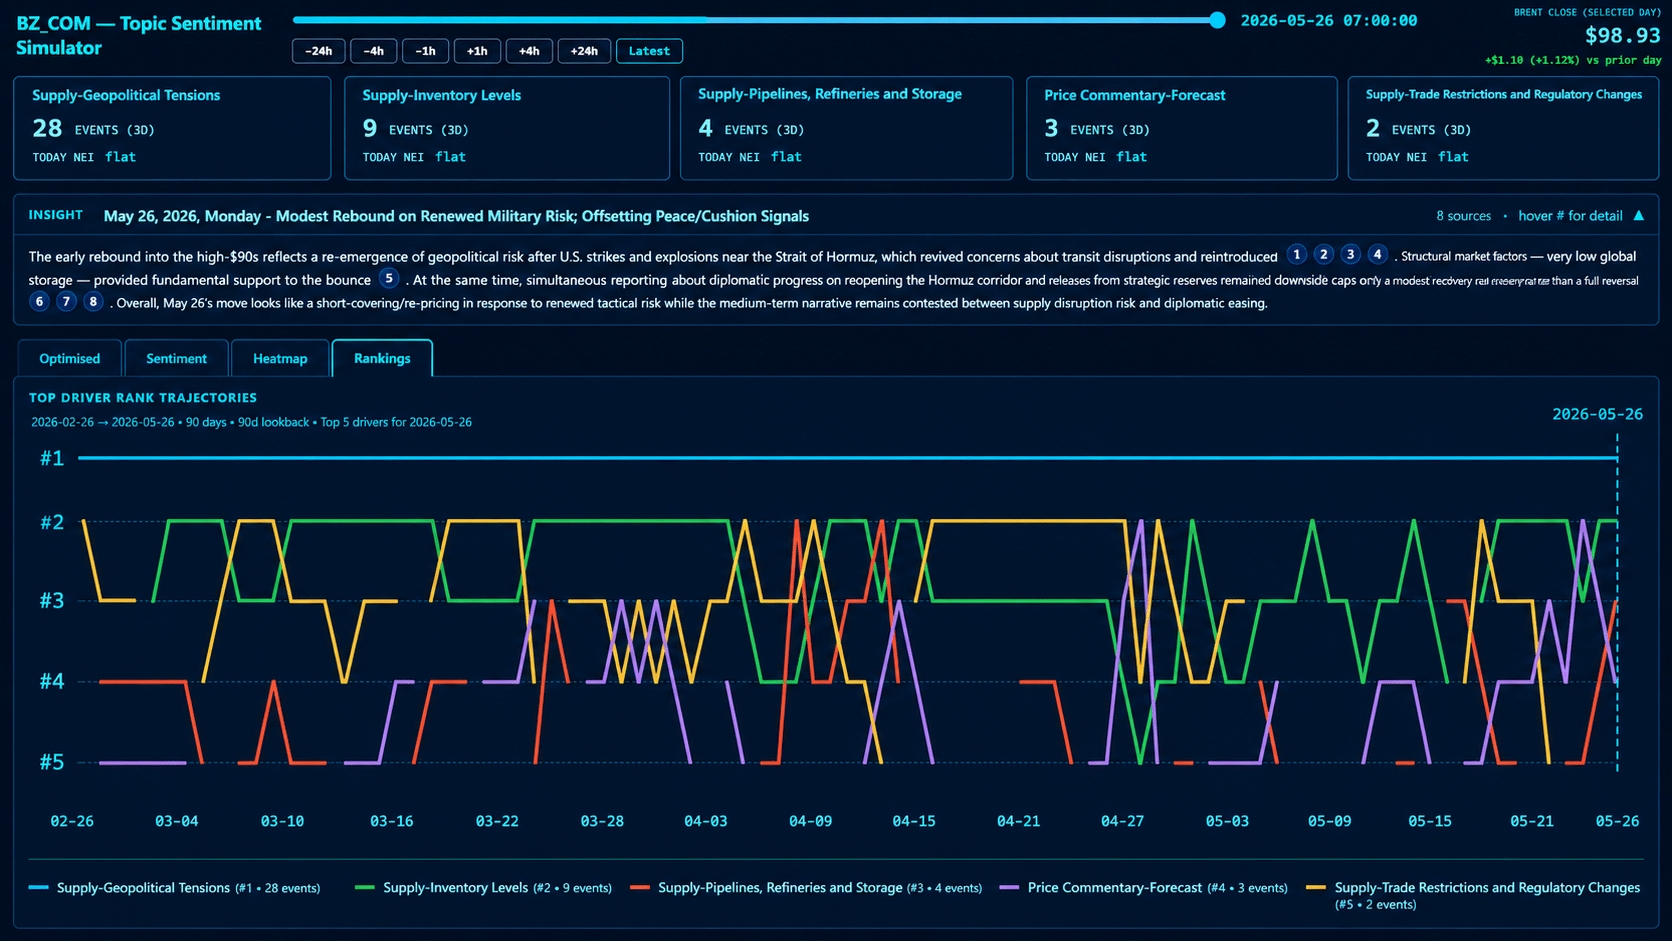
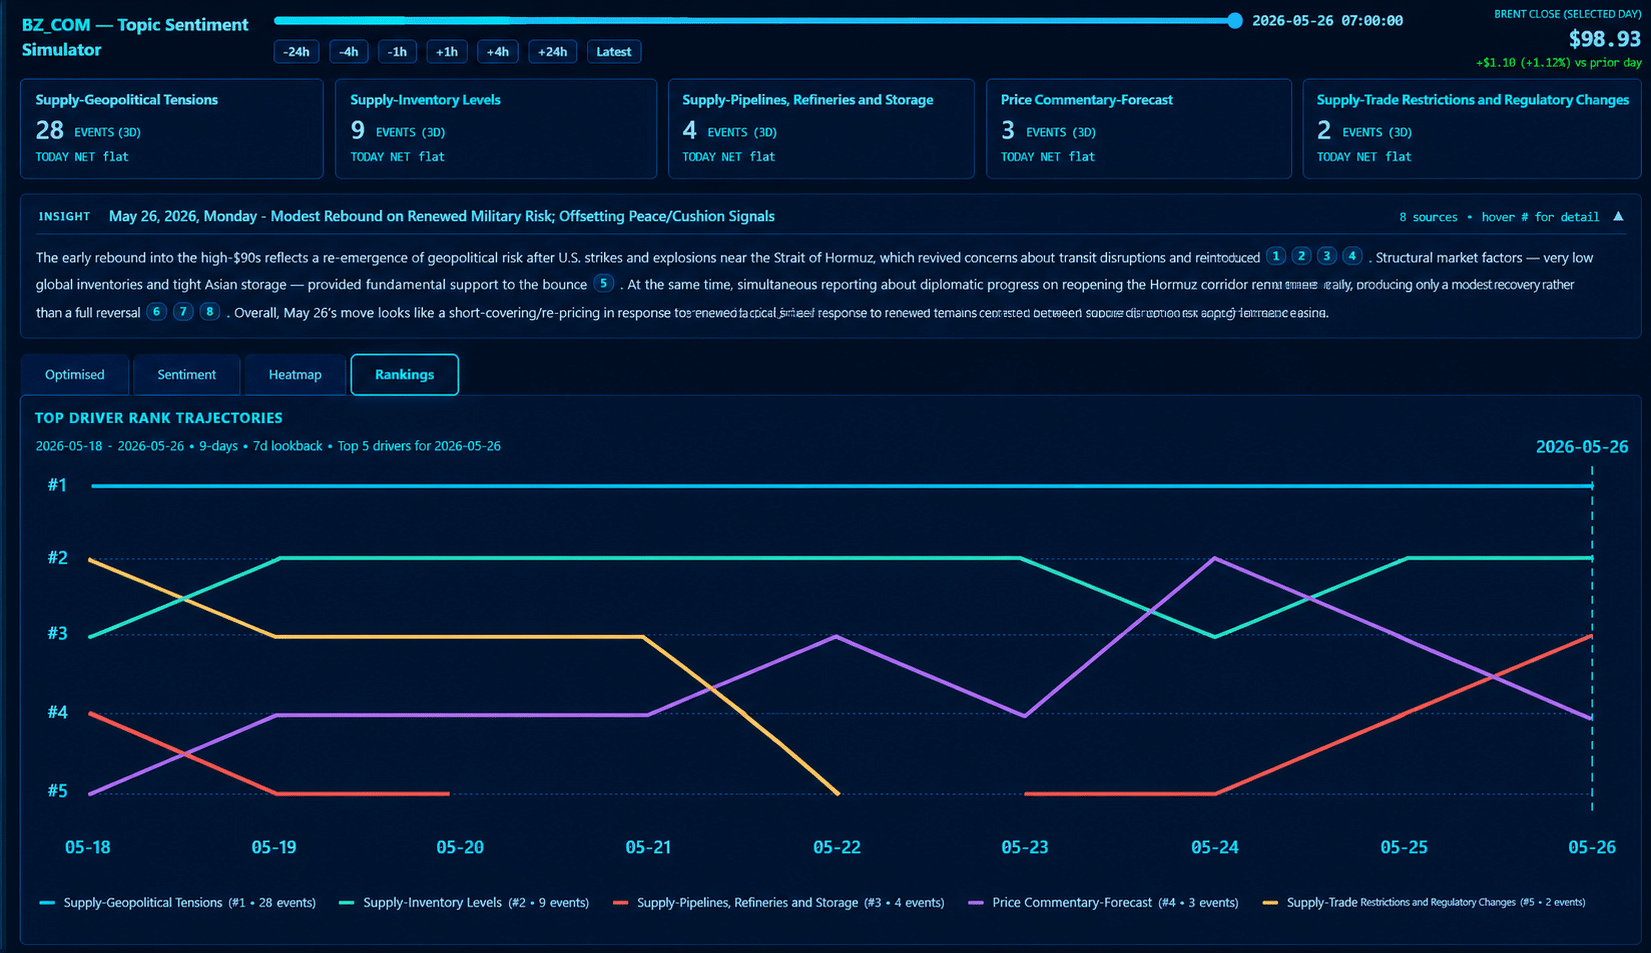
Permutable separates Brent market pressure across supply, inventories, OPEC policy, geopolitical risk, trade restrictions and demand. The view shows which drivers are gaining or losing influence rather than reducing the market to one aggregate oil-sentiment score.
Signals shown: Brent price, geopolitical tensions, inventories, supply, forecasts and trade restrictions
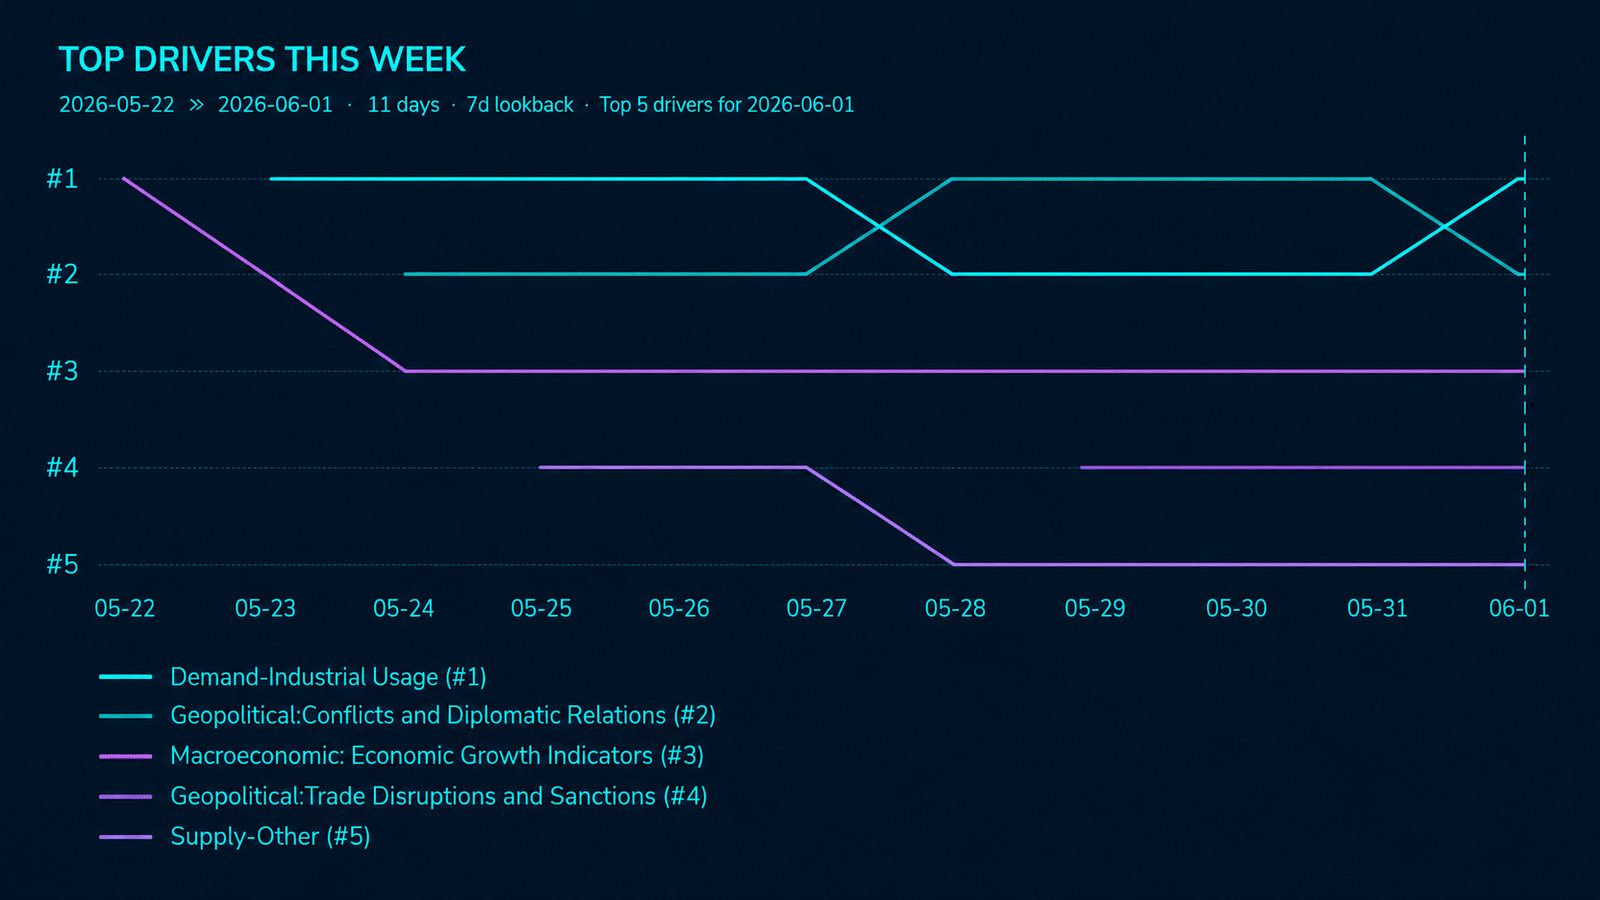
Permutable ranks demand, production, energy, trade, geopolitical and supply-related narratives influencing aluminium. The view allows users to see how the relative importance and direction of individual market drivers change across the analysis window.
Signals shown: Industrial demand, production, economic growth, trade disruption, sanctions, geopolitical developments and supply pressure
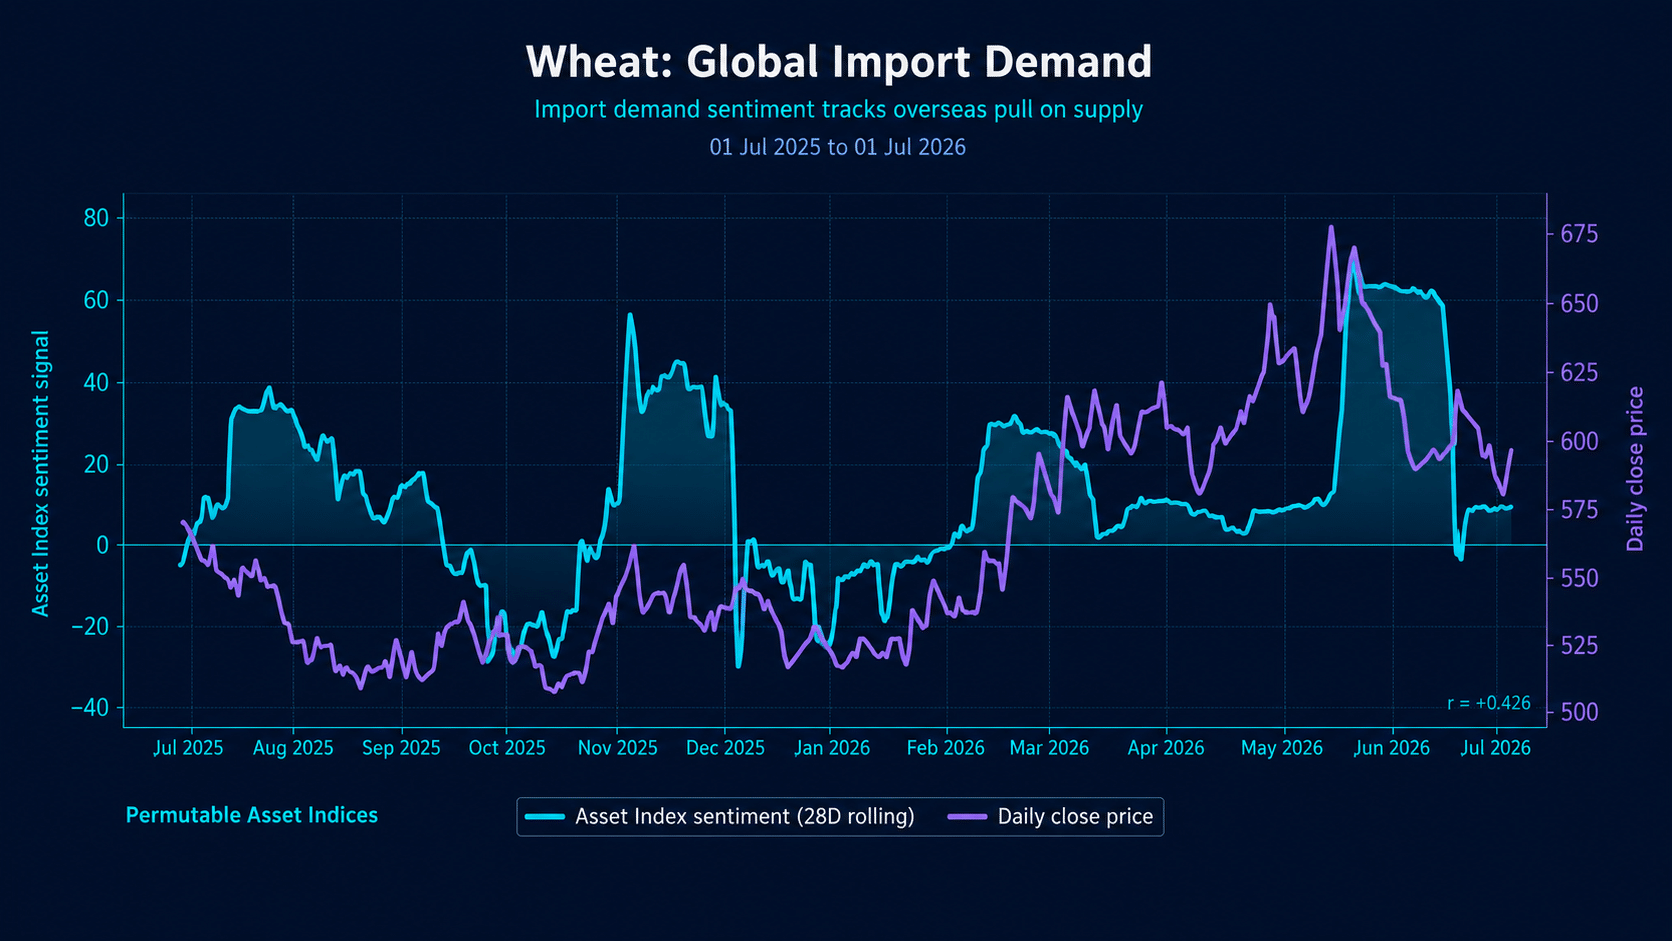
Permutable tracks point-in-time wheat import-demand sentiment alongside daily market prices. This allows users to examine how changes in the demand narrative developed at the correct historical timestamp.
| Global commodity trading house | “The useful part is being able to see what sits behind the move. Permutable links the commodity signal back to the drivers, events and sources, which makes it easier to judge whether the move has real support.” |
| European asset manager | “Permutable gave us more confidence to stay in the silver trade. The price action was noisy, but the underlying signals still pointed to support from investment demand and macro policy.” |
| Multi-strategy hedge fund | “Permutable helped us see when a commodity story was becoming more persistent. The market often reacts first to the headline, but the trade depends on whether the driver keeps building.” |
| What is measured? | What explains the move? | How is it used? |
| Asset, contract and driver-level indices | Supply, demand, inventories, production, weather, infrastructure, shipping, trade, policy, sanctions and geopolitics | Research, monitoring, systematic models and risk workflows |
| Direction and magnitude | Source-linked events and story development | Historical replay, alerts, API, Excel and data feeds |
| Energy, metals and agricultural markets | Narrative persistence, cross-commodity divergence and market transmission | Portfolio analysis, scenario testing and custom configurations |
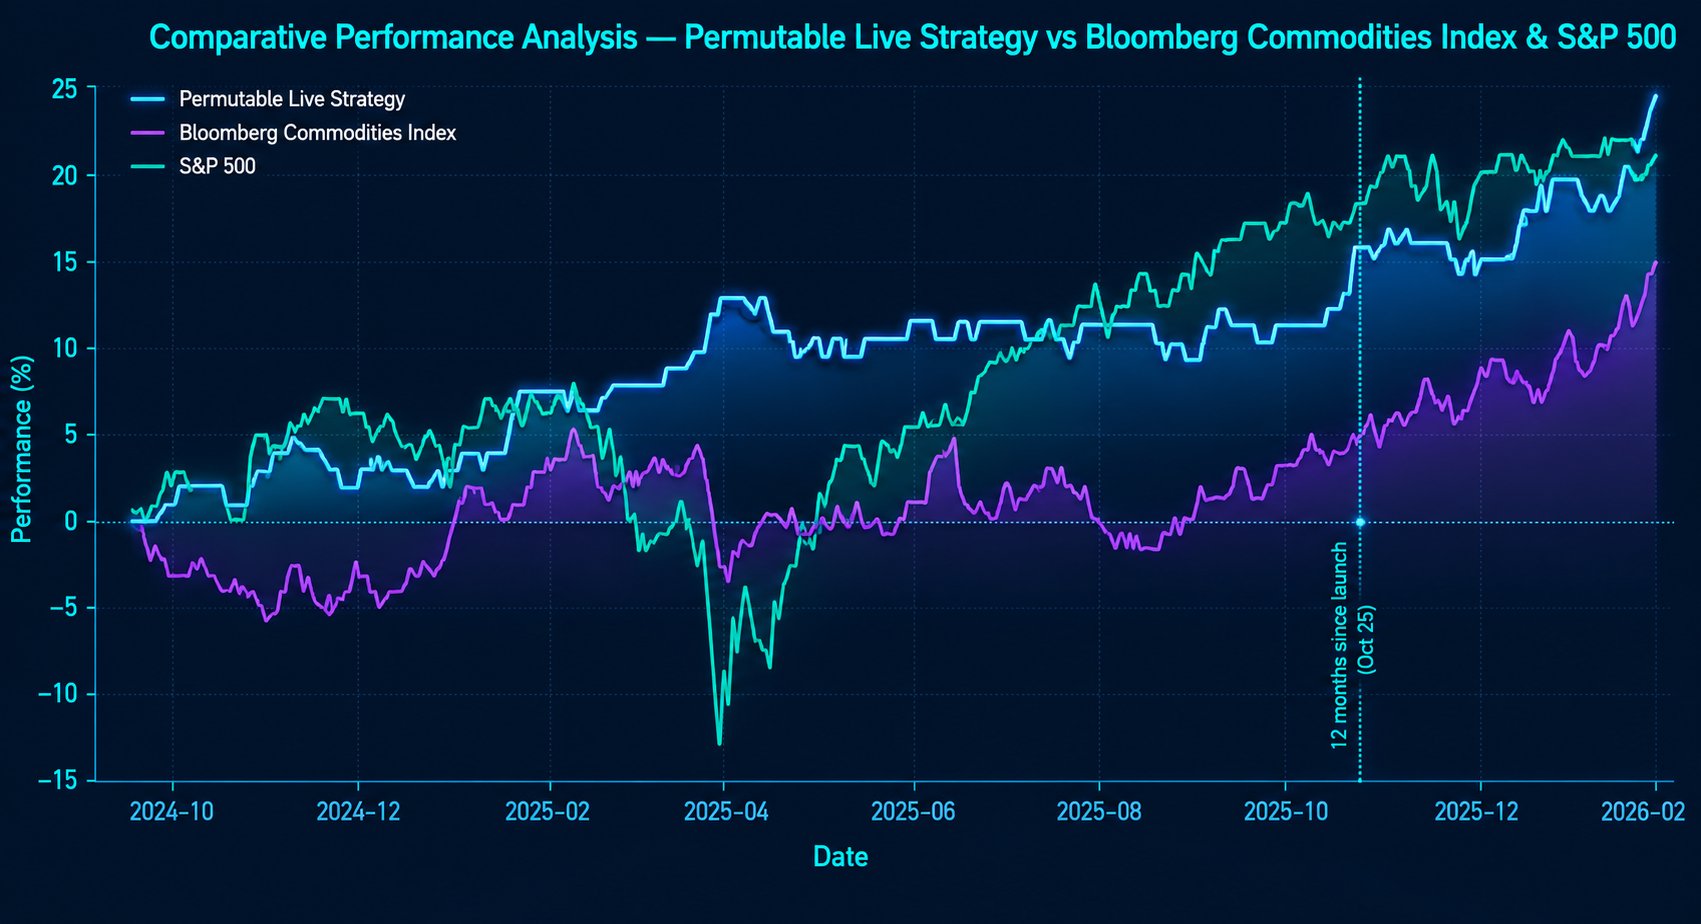
Across a 16-month live commodities futures experiment, a balanced long/short strategy trading highly liquid front-month contracts across energy, agriculture and metals delivered a 28.54% total return, 20.86% annualised return, 7.01% annualised volatility and a −2.95% maximum drawdown.
The results reflect one defined implementation of Permutable’s sentiment signals under fixed portfolio and risk rules, rather than the expected performance of the underlying data in every application. Get in touch for the full methodology, including contract selection, signal timing, position sizing, rebalancing, roll treatment, costs and risk controls.
| Capability | Indices and signals | Events and sources | Custom commodity intelligence |
| Energy, metals and agricultural signals | ✓ | ✓ | ✓ |
| Asset and contract-level intelligence | ✓ | ✓ | ✓ |
| Driver-level intelligence | ✓ | ✓ | ✓ |
| Live updates | ✓ | ✓ | ✓ |
| Historical point-in-time series | ✓ | ✓ | ✓ |
| Underlying event records | ✓ | ✓ | |
| Source-linked observations | ✓ | ✓ | |
| Custom assets, contracts and driver views | ✓ | ||
| API, Excel and files | ✓ | ✓ | ✓ |
Permutable provides historical and live asset-level indices, driver signals, event records, narrative data and source metadata. The dataset captures changing pressure across supply, demand, inventories, infrastructure, policy, geopolitics, weather, shipping and wider macroeconomic conditions.
Coverage spans energy, metals and agriculture, including Brent and WTI crude, refined products, Henry Hub, TTF, LNG, gold, silver, copper, aluminium, iron ore, steel, wheat, corn, soybeans, cocoa, coffee and sugar. Driver coverage includes production, consumption, inventories, trade, transport, weather, policy, geopolitical risk and macroeconomic demand.
Most commodity intelligence is available with more than 11 years of point-in-time history. Each observation preserves the information available at the time, supporting historical research and backtesting without introducing later reporting or revised interpretations.
Permutable goes beyond positive and negative media tone. It identifies the direction, strength and persistence of specific market drivers, maps them to individual commodities and separates forces such as supply, demand, inventories, policy and geopolitical risk. Signals can also be traced to the events and sources beneath them.
Yes. Users can move from an asset-level signal to its contributing drivers, events, narratives and underlying sources. Source records preserve publication time, language, entity mappings and relevant context, supporting validation and explainable research.
Historical and live intelligence can be delivered through API, Excel, structured files, institutional feeds or customised integrations. The same point-in-time structures can be used across quantitative research, discretionary monitoring, model development and production workflows.
Yes. Institutions can request sample signals and supporting documentation for relevant commodities, drivers and time periods. Permutable can also discuss evaluation requirements, integration options and how the data could fit an existing trading, research or risk workflow.