
Commodity signal evaluation: from information flow to portfolio evidence
07 Oct 2026
07 Oct 2026
This article examines Permutable’s commodity signal evaluation across 19 futures, covering reported performance. It explains how directional signals connect market narratives with systematic exposure and why sizing, benchmarks and methodology influence interpretation. Aimed at institutional commodity researchers, QIS desks, systematic investment teams and discretionary analysts assessing narrative intelligence within their research and market monitoring workflows.
At Permutable, our live commodity signal evaluation now spans two years across energy, agriculture and metals.
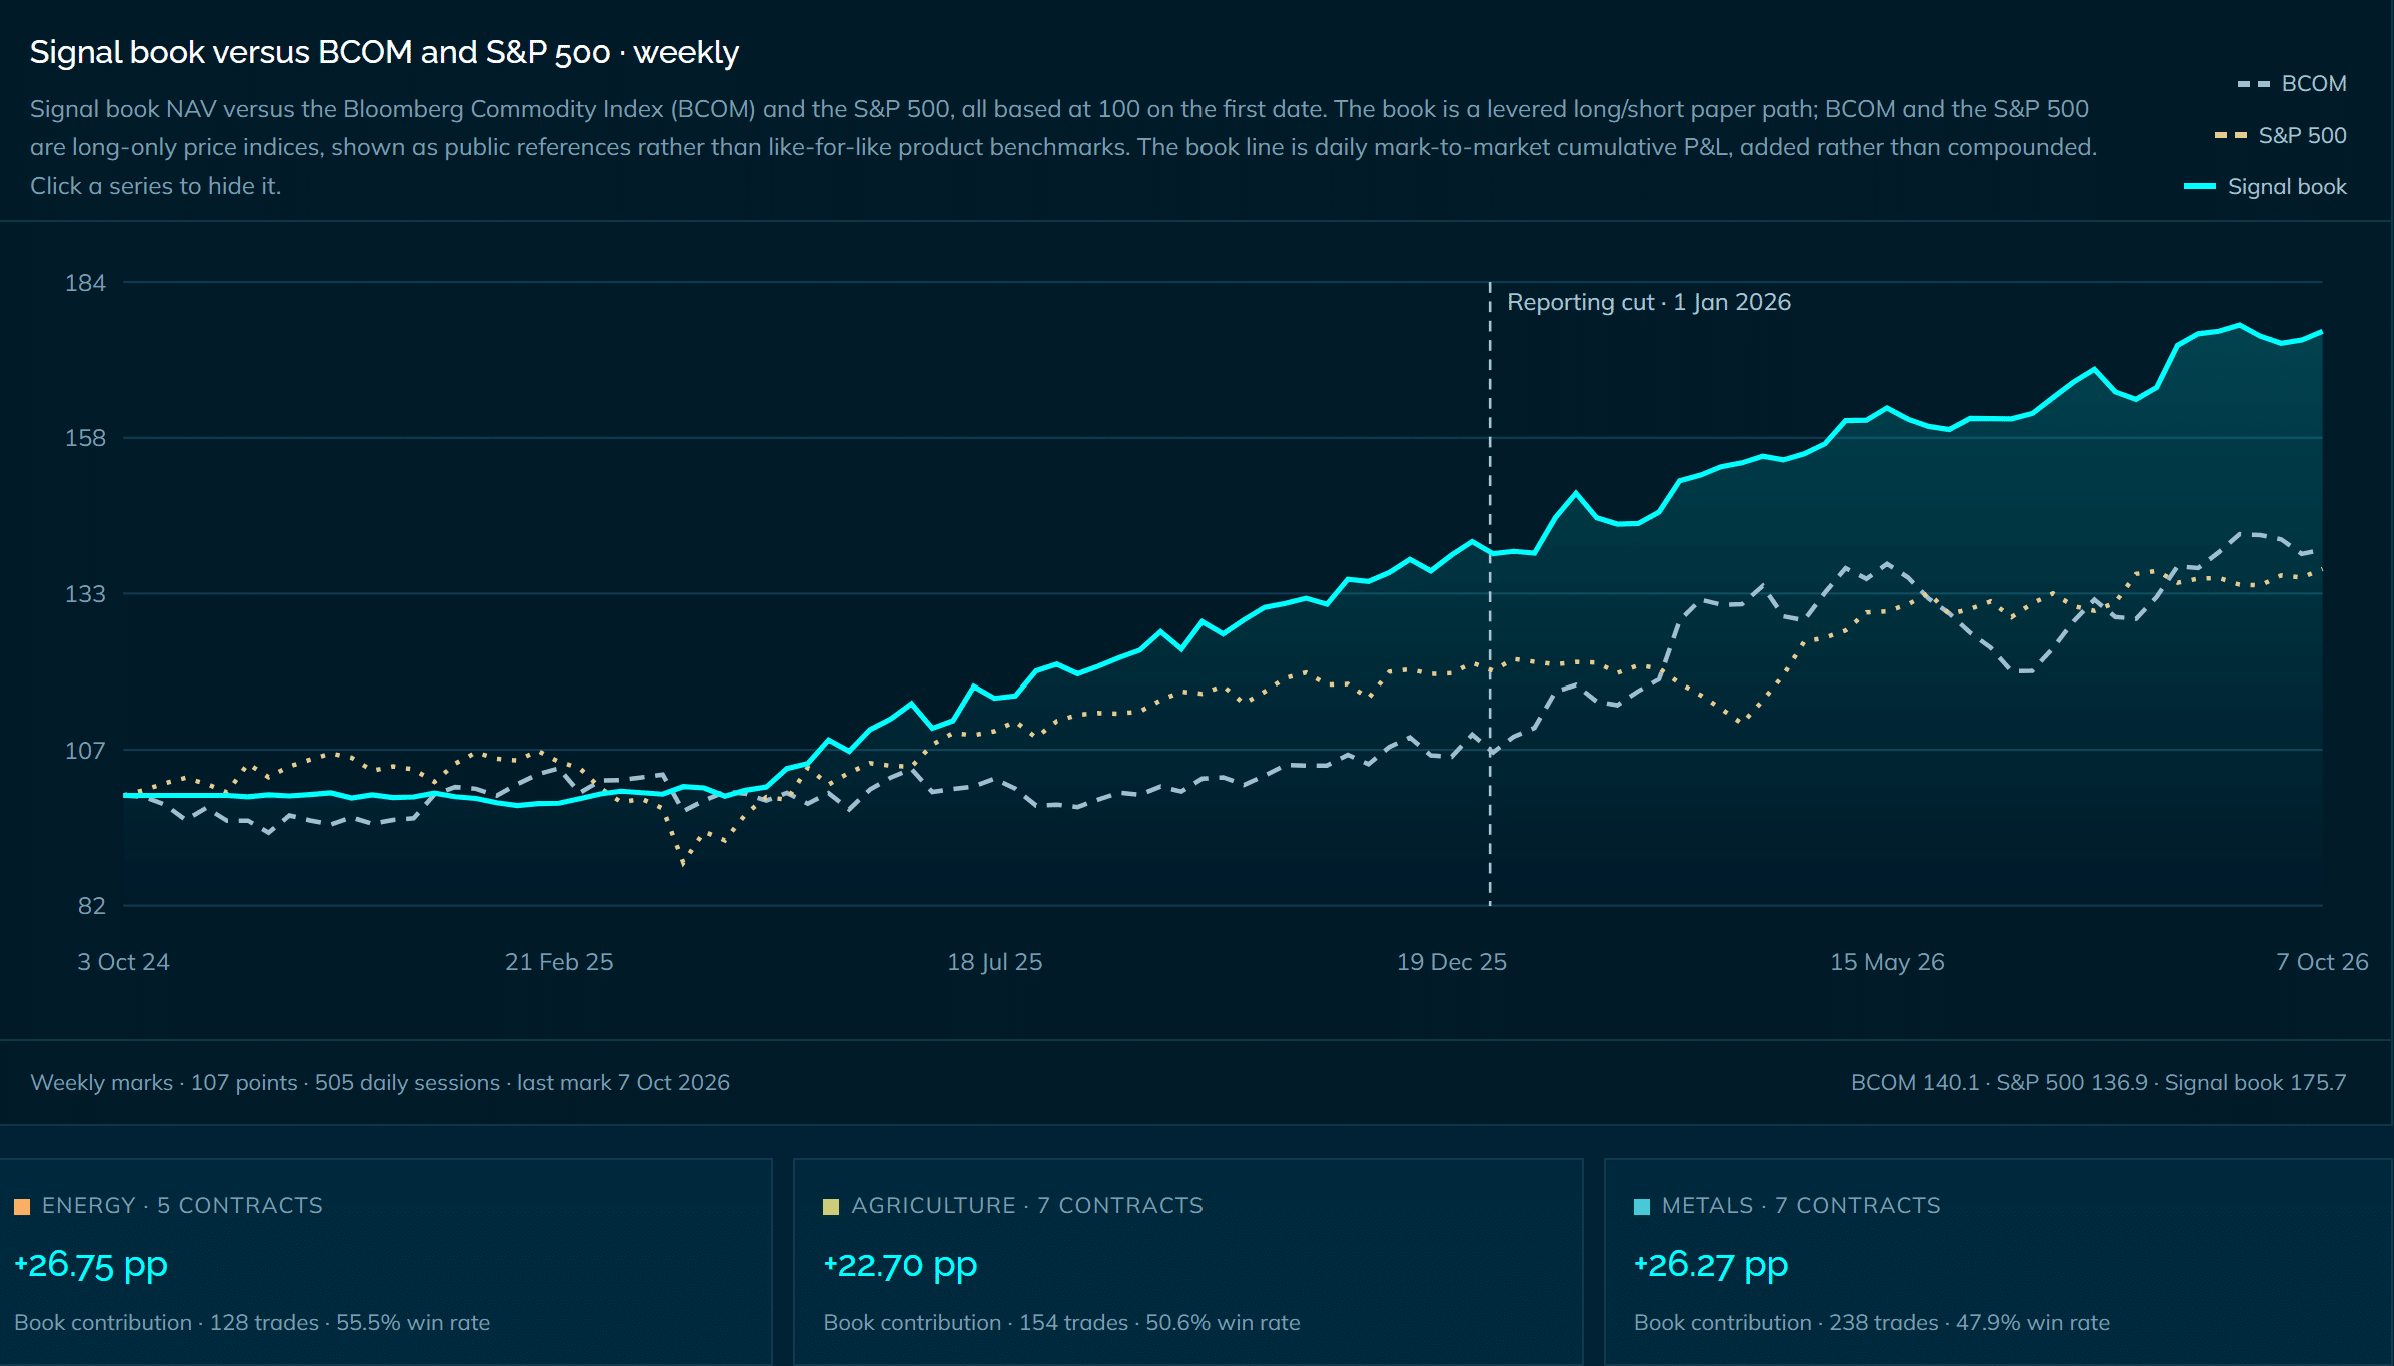
Permutable’s commodity signal evaluation spans two years across energy, agriculture and metals. The long/short book’s performance this year to date has thus far been +26.1% Across the full evaluation window, annualised volatility was 11.9%, maximum drawdown was −5.3%, and the book was positive in 19 of 24 months.
The signals were generated as information arrived. Portfolio results, sector contributions and individual contract performance are published alongside the evaluation methodology, allowing researchers to examine how the information was translated into exposure and how those positions subsequently behaved.
Commodity reporting covers changes in supply, demand and inventories, physical disruption, geopolitical developments and the wider macroeconomic environment. A report’s implications depend on the product, location, entities involved and the relationships through which an event may transmit.
At Permutable, we process this reporting through sector-specific sourcing, entity resolution, relevance classification, topic mapping and sentiment validation. Information is assessed for its bullish or bearish implications for the asset concerned, with individual drivers available for separate examination.
Our commodity intelligence framework cover six sectors and 84 parent products. Structured relationships connect products with benchmarks, contracts, regions and physical-market context.
Systematic teams can use these observations in research, backtesting and QIS applications. Discretionary desks can investigate which drivers are contributing to a changing market narrative.
Within the published evaluation, Permutable’s Copilot models convert commodity driver signals, event flow and source evidence into signed directional signals.
Reporting tone is assessed separately from directional pressure. An alarming account of supply disruption, for example, needs to be interpreted for its implications for the commodity concerned rather than simply classified as negative news.
The framework retains direction, confidence and narrative reasoning for each signal.
Researchers can follow the underlying reporting through its relevance to the asset, the resulting signal and the subsequent market outcome.
Our proprietary knowledge graph links assets, benchmarks, entities and locations. Infrastructure mapping connects reporting with facilities, pipelines, terminals and transport networks.
Using Brent as an example, this brings supply assets, inventories, logistics, policy, downstream demand and associated benchmarks into a single market framework.
These relationships help researchers investigate whether a narrative concerns a potential physical constraint, a change in demand or a broader macroeconomic development, and which exposures may be affected.
The current evaluation uses an equal-volatility long/short allocation with 2× gross leverage. Contracts are scaled to similar risk, while net exposure and sector composition vary with the signals.
Sizing determines how individual positions contribute to the portfolio. A strong directional result in one contract does not necessarily produce an equally large contribution to the book.
Researchers can examine contract-level behaviour separately from allocation, then assess the signals under their own sizing rules and risk constraints.
| Measure | Full evaluation period | Published out-of-sample period |
|---|---|---|
| Reported return | +75.7% | +26.1% |
| Annualised volatility | 11.9% | 12.8% |
| Maximum drawdown | −5.3% | −5.3% |
| Monthly hit rate | 79.2% | 70.0% |
| Sharpe ratio | 2.4 | 2.4 |
Latest mark: 7 October 2026. The published reporting split is 1 January 2026. Sharpe uses a zero risk-free rate.
The book was positive in 19 of 24 months over the full window. The monthly hit rate measures positive months, rather than successful trades.
Signals were generated live throughout. The January 2026 split separates the earlier and later evaluation periods; it does not mark a switch from retrospectively generated signals to live observations.
All three sectors contributed positively over the full evaluation window:
Individual markets varied. Lead and tin made negative contributions despite the positive aggregate result for metals.
The published breakdown separates standalone contract P&L from weighted portfolio contribution. It allows researchers to assess concentration, identify exposures that supported or detracted from performance, and investigate the signals within a narrower commodity universe.
The published path is a live evaluation, not executed trading performance. Fees, roll costs and execution slippage are excluded. Cumulative P&L is added rather than compounded.
The Bloomberg Commodity Index and S&P 500 are shown as long-only market references. Their construction differs from the leveraged long/short signal book, so the chart does not provide a like-for-like comparison of investment strategies.
An institutional evaluation would apply the desk’s own execution assumptions, transaction costs, capacity constraints and risk limits. It would examine weaker markets and periods alongside favourable results, testing how the observed behaviour changes under different research and portfolio rules.
Request Permutable Perspective, Edition 4 to see the commodity framework, knowledge graph and physical-market examples. Read it alongside the latest published results.
Email enquiries@permutable.ai with the subject “Commodity signal evaluation” and the commodities your desk covers. Request the full edition and discuss the historical signals, underlying drivers and evaluation scope relevant to your research.

Analysis
06 Oct 2026
Copper sentiment data for institutional commodities desks: How sentiment Flagged the 2026 supply squeeze early
Read more >
Guide
14 Aug 2026
Measuring narrative momentum across global markets: A guide for institutional investors
Read more >
Analysis
27 Jul 2026
Saudi supply risk and import costs drive energy inflation sentiment higher
Read more >