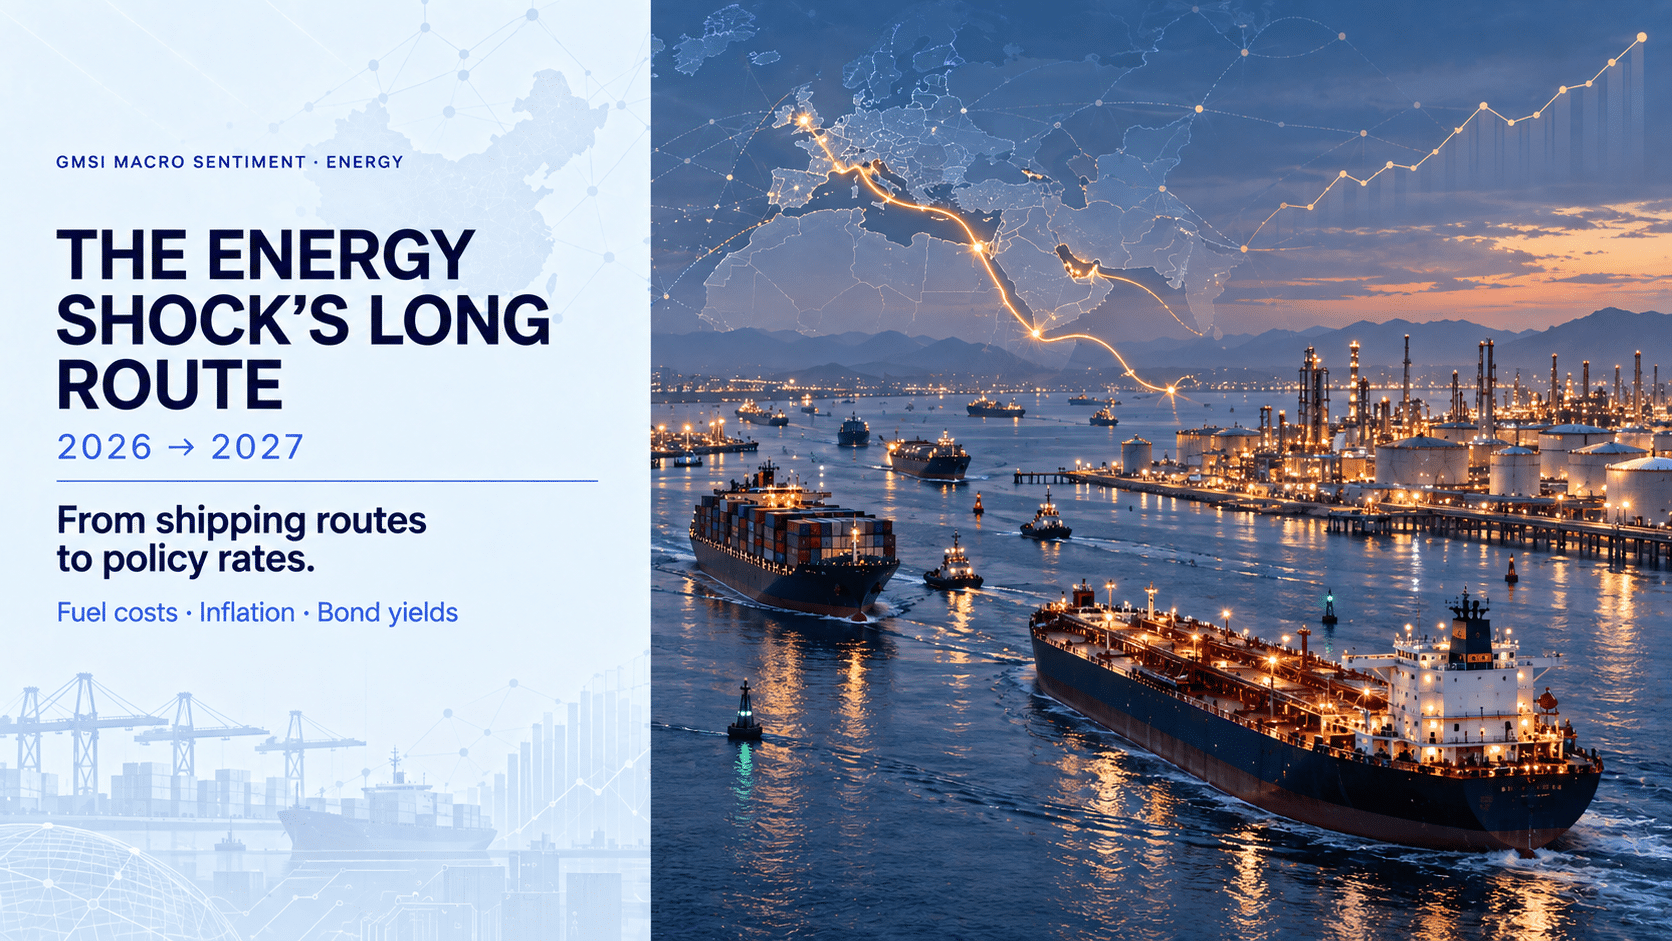
How does the 2026 energy shock reach 2027? From shipping routes to policy rates
23 Sep 2026
23 Sep 2026
Brent crude has slipped back below $100, but the broader energy shock is far from over. What began as logistics frictions in Gulf shipping lanes has evolved into a multi-stage macro contagion, cascading from refined fuel markets straight to the global yield curve.
While crude gains have moderated to 36% since 28 February, European diesel has surged by 98%, amplified by EU natural gas inventories well below their five-year seasonal lows. To absorb these lingering cost-push pressures and preempt second-round inflation, central banks are gearing policy towards restrictive territory. This stance has pushed US real interest rates to their highest level since 2008, accounting for 90% of the total rise in 10-year borrowing costs.
With investors demanding higher term premiums on debt extending into 2027, Permutable’s Global Macro sentiment indices map this multi-stage transmission channel step-by-step, surfacing structural policy shifts long before backward-looking economic releases capture the damage.
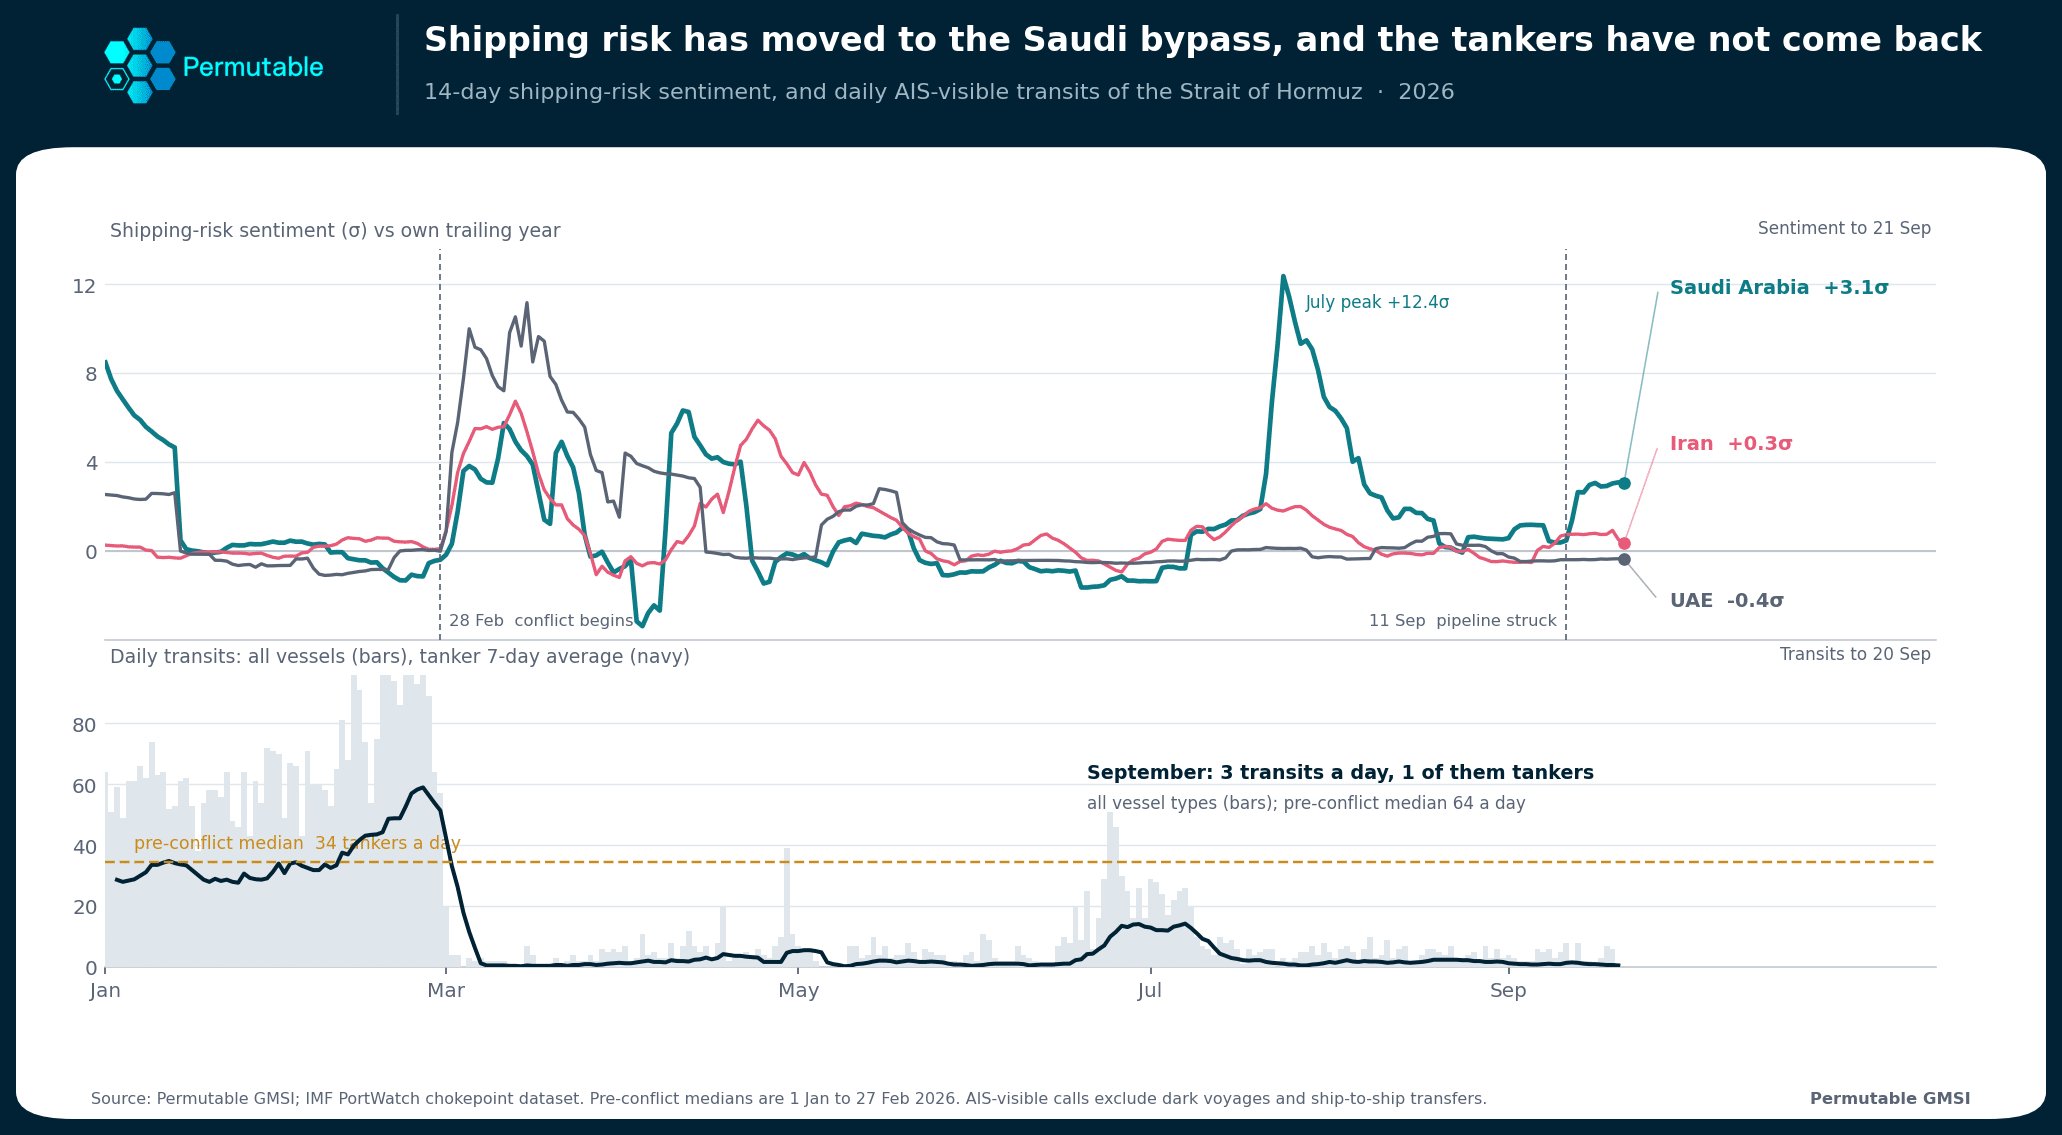
Permutable shipping-risk sentiment for Iran, Saudi Arabia and the UAE alongside daily transits of the Strait of Hormuz. Sentiment to 21 September, transits to 20 September.
Our shipping-risk index moved sideways rather than spiking, and that sideways drift was the true signal. While Iranian risk coverage subsided to 0.3 standard deviations above its trailing-year norm, Saudi Arabia climbed to 3.1. Attention had already pivoted west to bypass routes long before any physical disruption occurred.
Then the bottleneck snapped. On 11 September, drone strikes disabled the East-West pipeline, the vital 1,200 km line from Abqaiq to Yanbu designed to bypass Hormuz. With the line forced offline, Saudi Aramco alerted European refiners that October crude allocations would be cut to zero.
Meanwhile, the Strait of Hormuz remains effectively closed. Average daily transits have collapsed from 64 vessels (34 tankers) to just three per day, only one being a tanker. The barrels have not vanished, they have been redirected east onto longer, costlier Asian trade routes that European refineries cannot practically absorb.
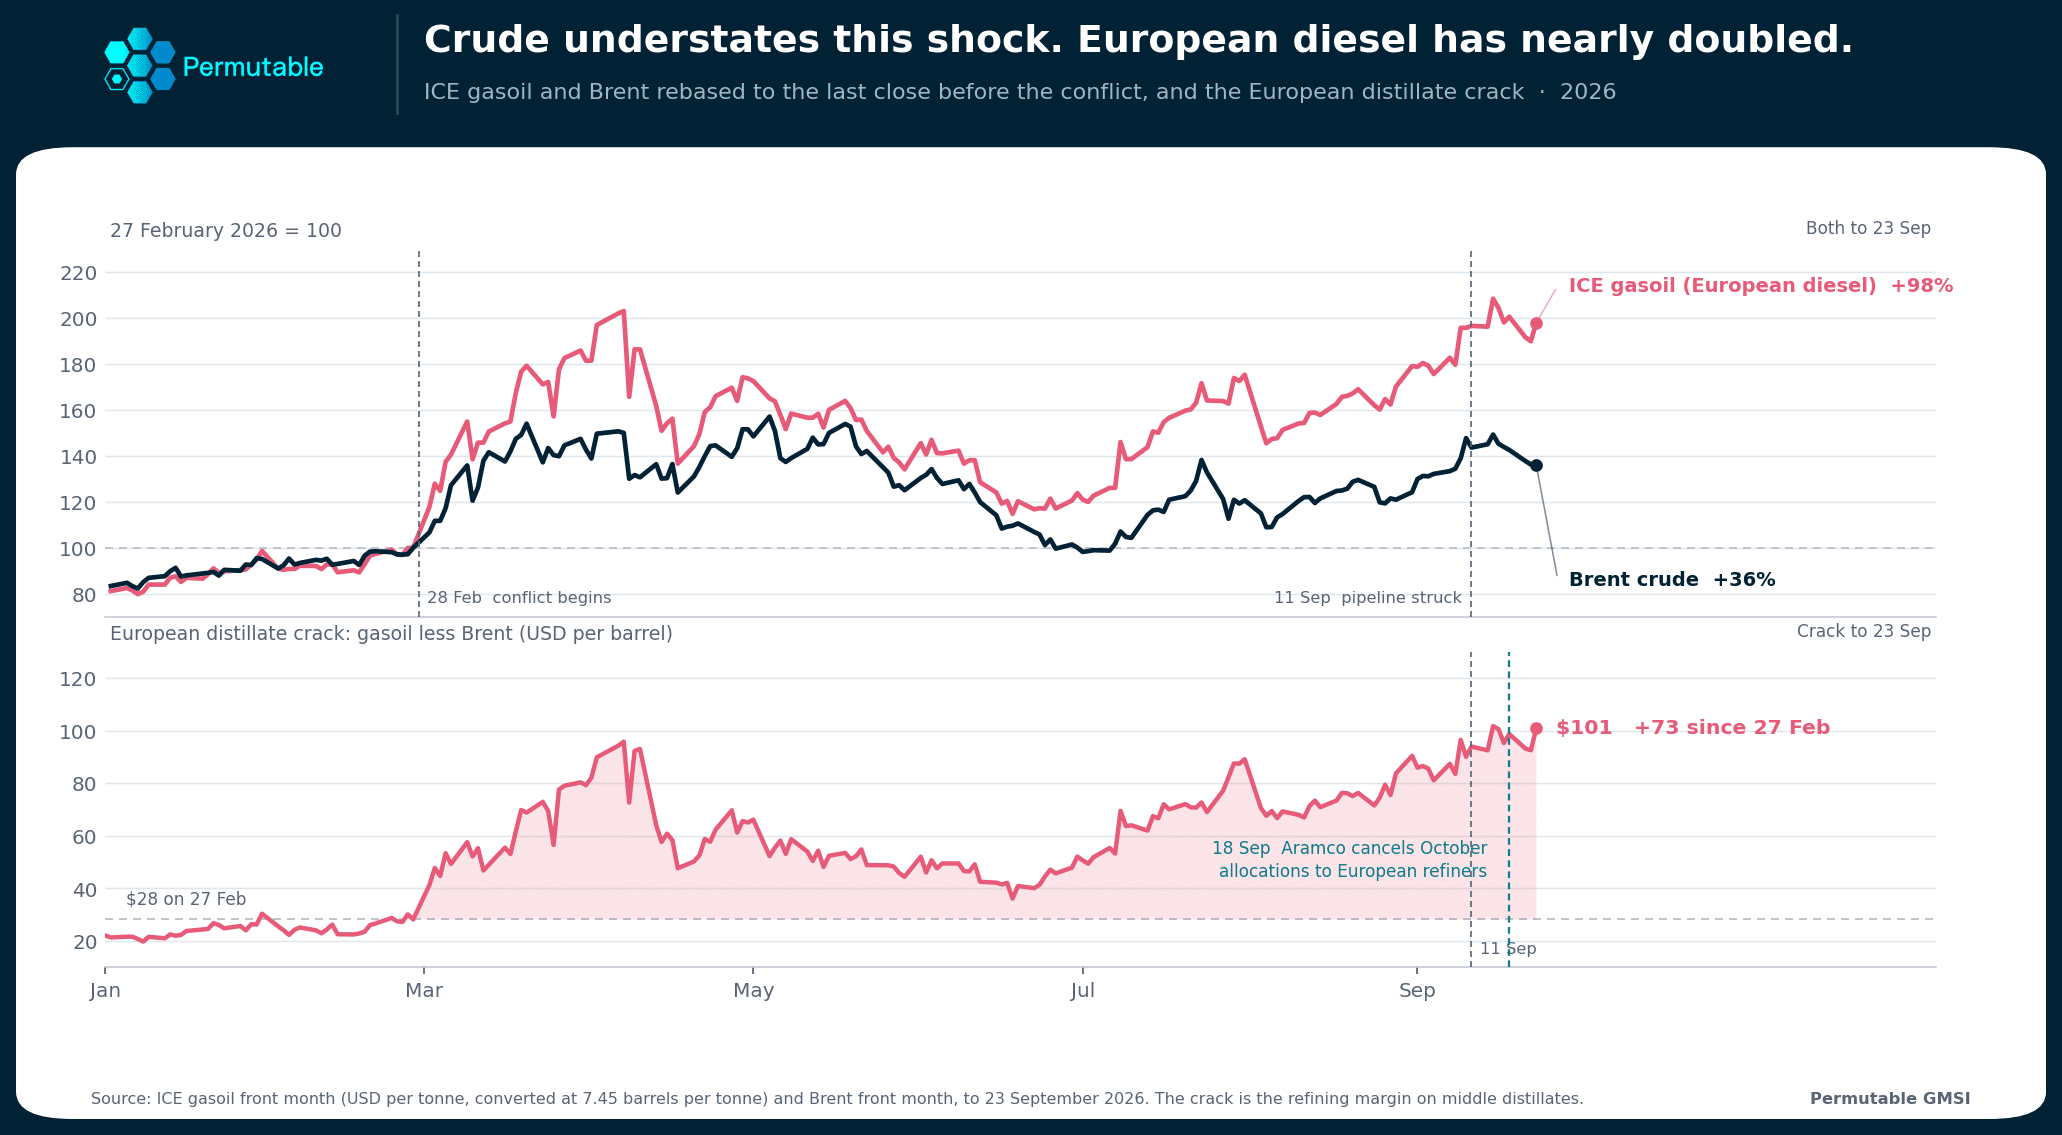 ICE gasoil and Brent rebased to the last close before the conflict, plus the European distillate crack at $101 a barrel. To 23 September.
ICE gasoil, Europe’s diesel benchmark, has gone from $753 a tonne to $1,490. The refining margin over Brent, the distillate crack, has widened from $28 to $101 a barrel. That spread is the part of the energy shock the crude price hides.
Diesel is an industrial input that moves freight fleets, agricultural yields, and construction equipment rather than consumer retail baskets. With European diesel up 98% against a 36% rise in crude, the cost burden reaching European enterprise is approximately double what crude benchmarks indicate. This transmission mechanism converts an upstream energy shock into downstream goods-price inflation, manifesting across supply chains through freight surcharges, transport tariffs, and quoted delivery lead times.
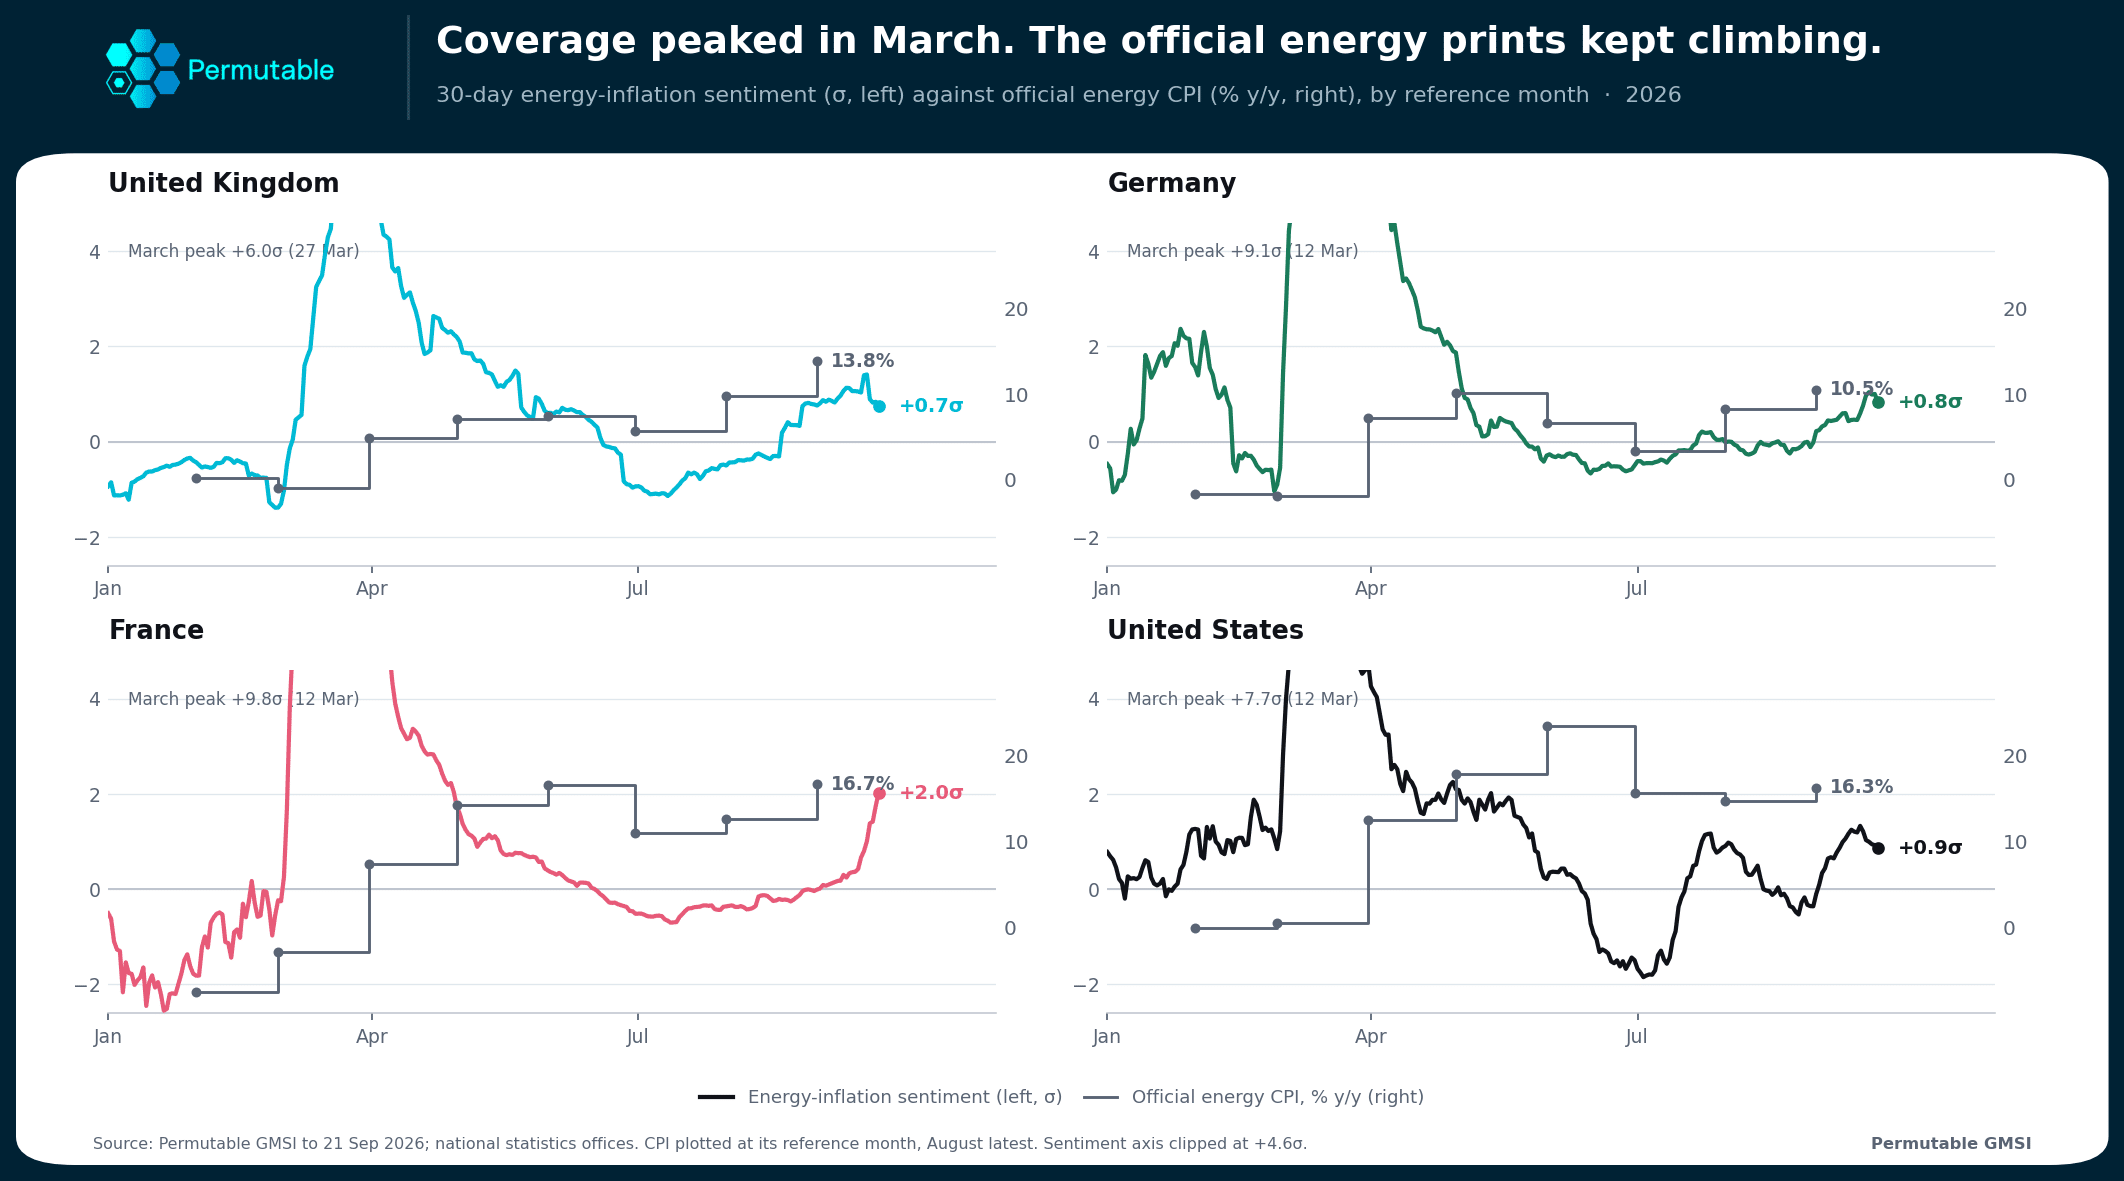
Permutable energy-inflation sentiment plotted against official energy CPI for the UK, US, Germany and France. Sentiment to 21 September, CPI to the August reference month.
So far the cost has stayed roughly where it landed. Energy inflation ran at 13.8% in the UK and 16.7% in France in August. UK services inflation held resilent at 3.4%, euro-area inflation excluding energy and food at 2.1%.
Our energy-inflation coverage peaked in March, faded through the spring, and turned higher again in July as natural gas climbed. While six months of elevated energy input costs have hit business operations, broader domestic inflation layers, food, manufactured goods, services, and wages, have not fully caught up. Soft private-sector wage growth and a loosening labor market continue to suppress consumer demand, but cost pressures are mounting. Upstream fertilizer price spikes are already nudging food prices higher, while structural demand for AI infrastructure, from semiconductors to raw industrial metals, is adding a layer of supply-chain friction.
Policymakers know the tipping point is near; once businesses stop swallowing margin compression and pass cumulative input costs downstream, a localized energy spike becomes a systemic inflation shock. With energy-inflation sentiment sitting between 0.7 and 0.9 standard deviations above norm across the UK, US, and Germany, policy-outlook coverage in those same markets reads far higher: 1.9, 1.4, and 3.0, respectively. In three of these four major economies, the policy tightening case now outpaces the inflation data that sparked it. Central banks are not following current statistics, they are moving in front of them.
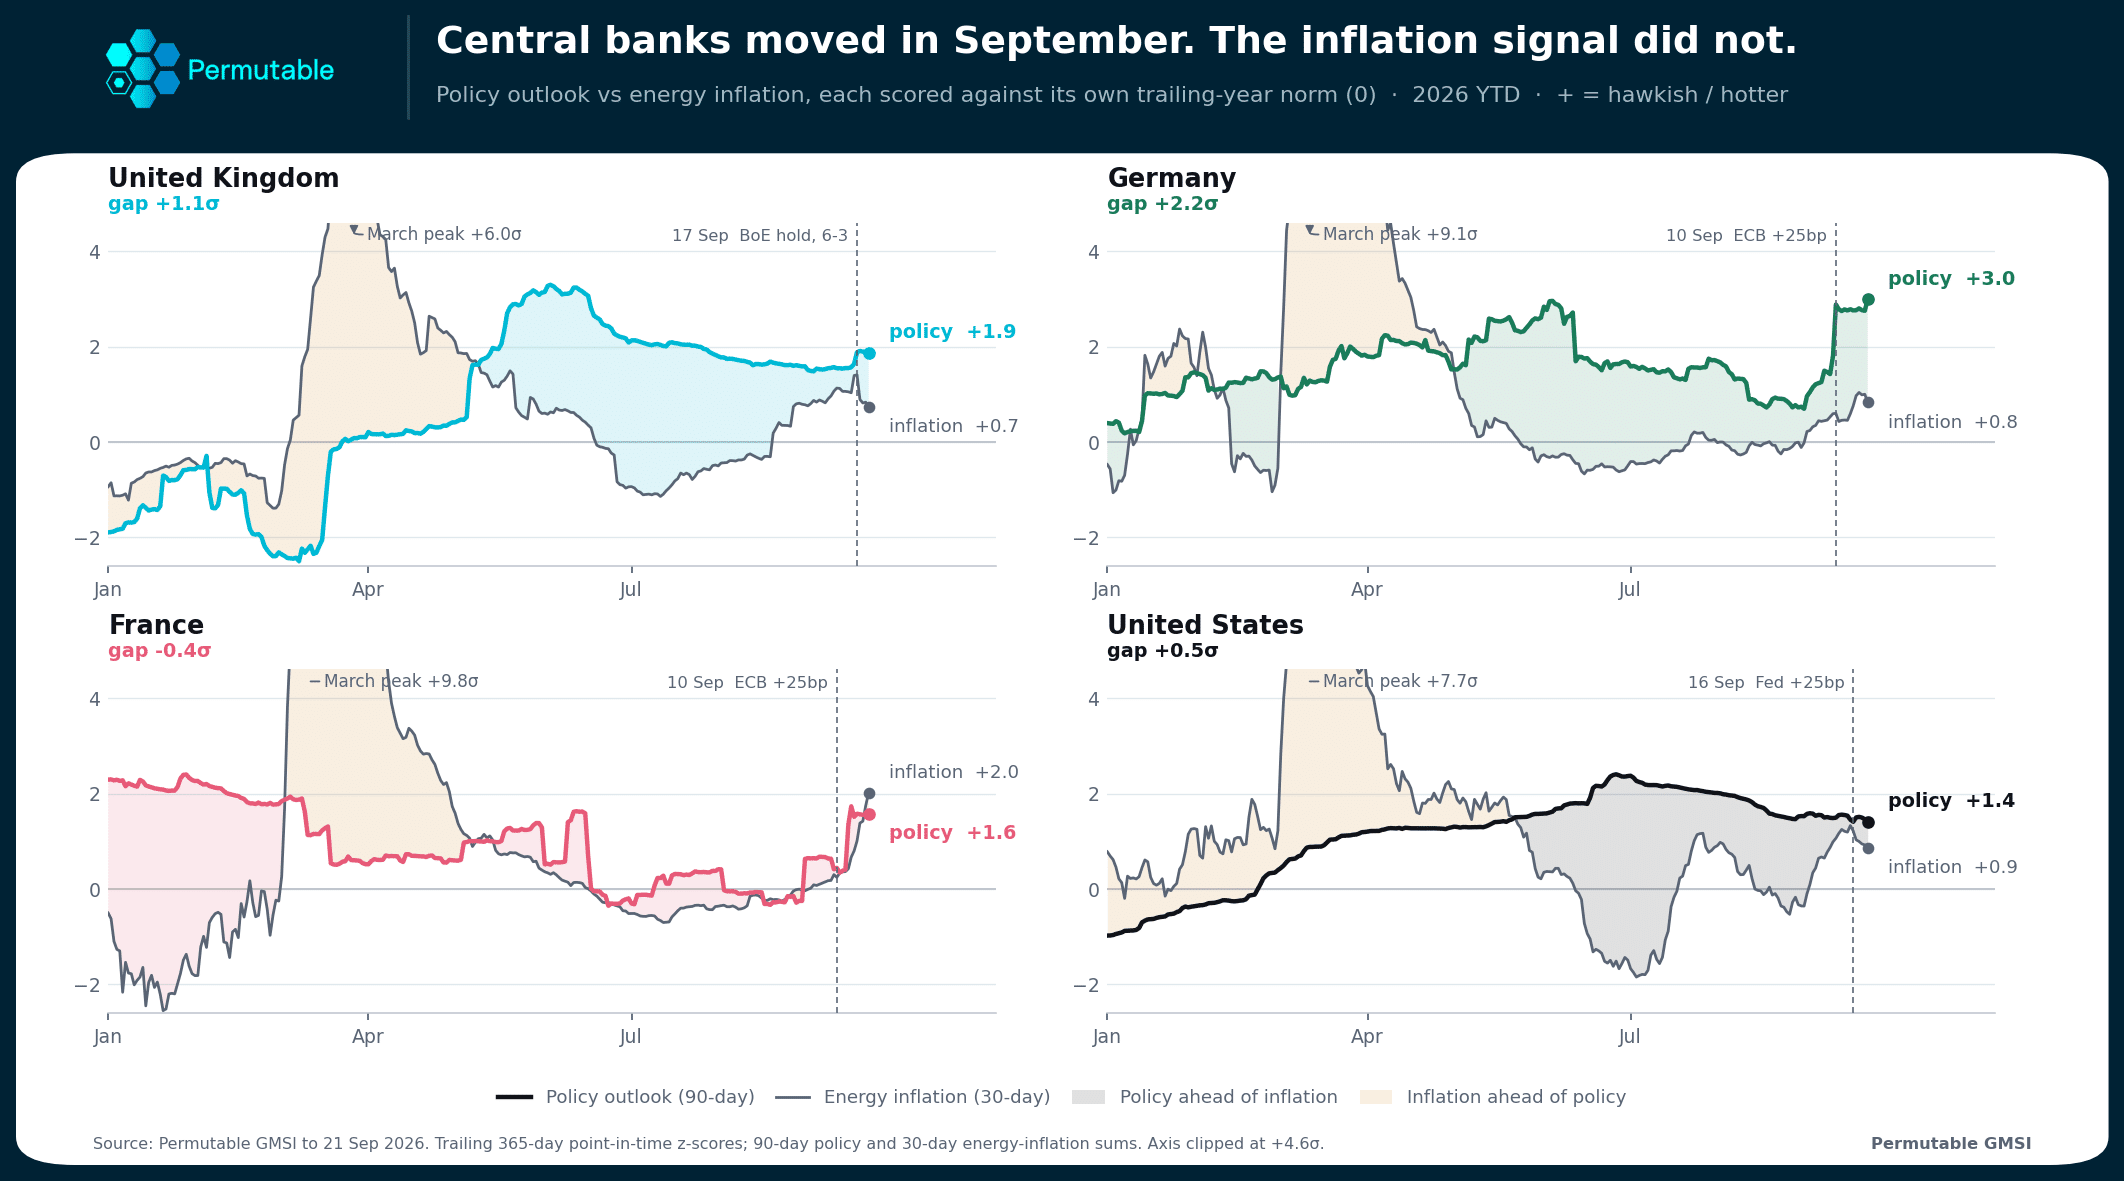
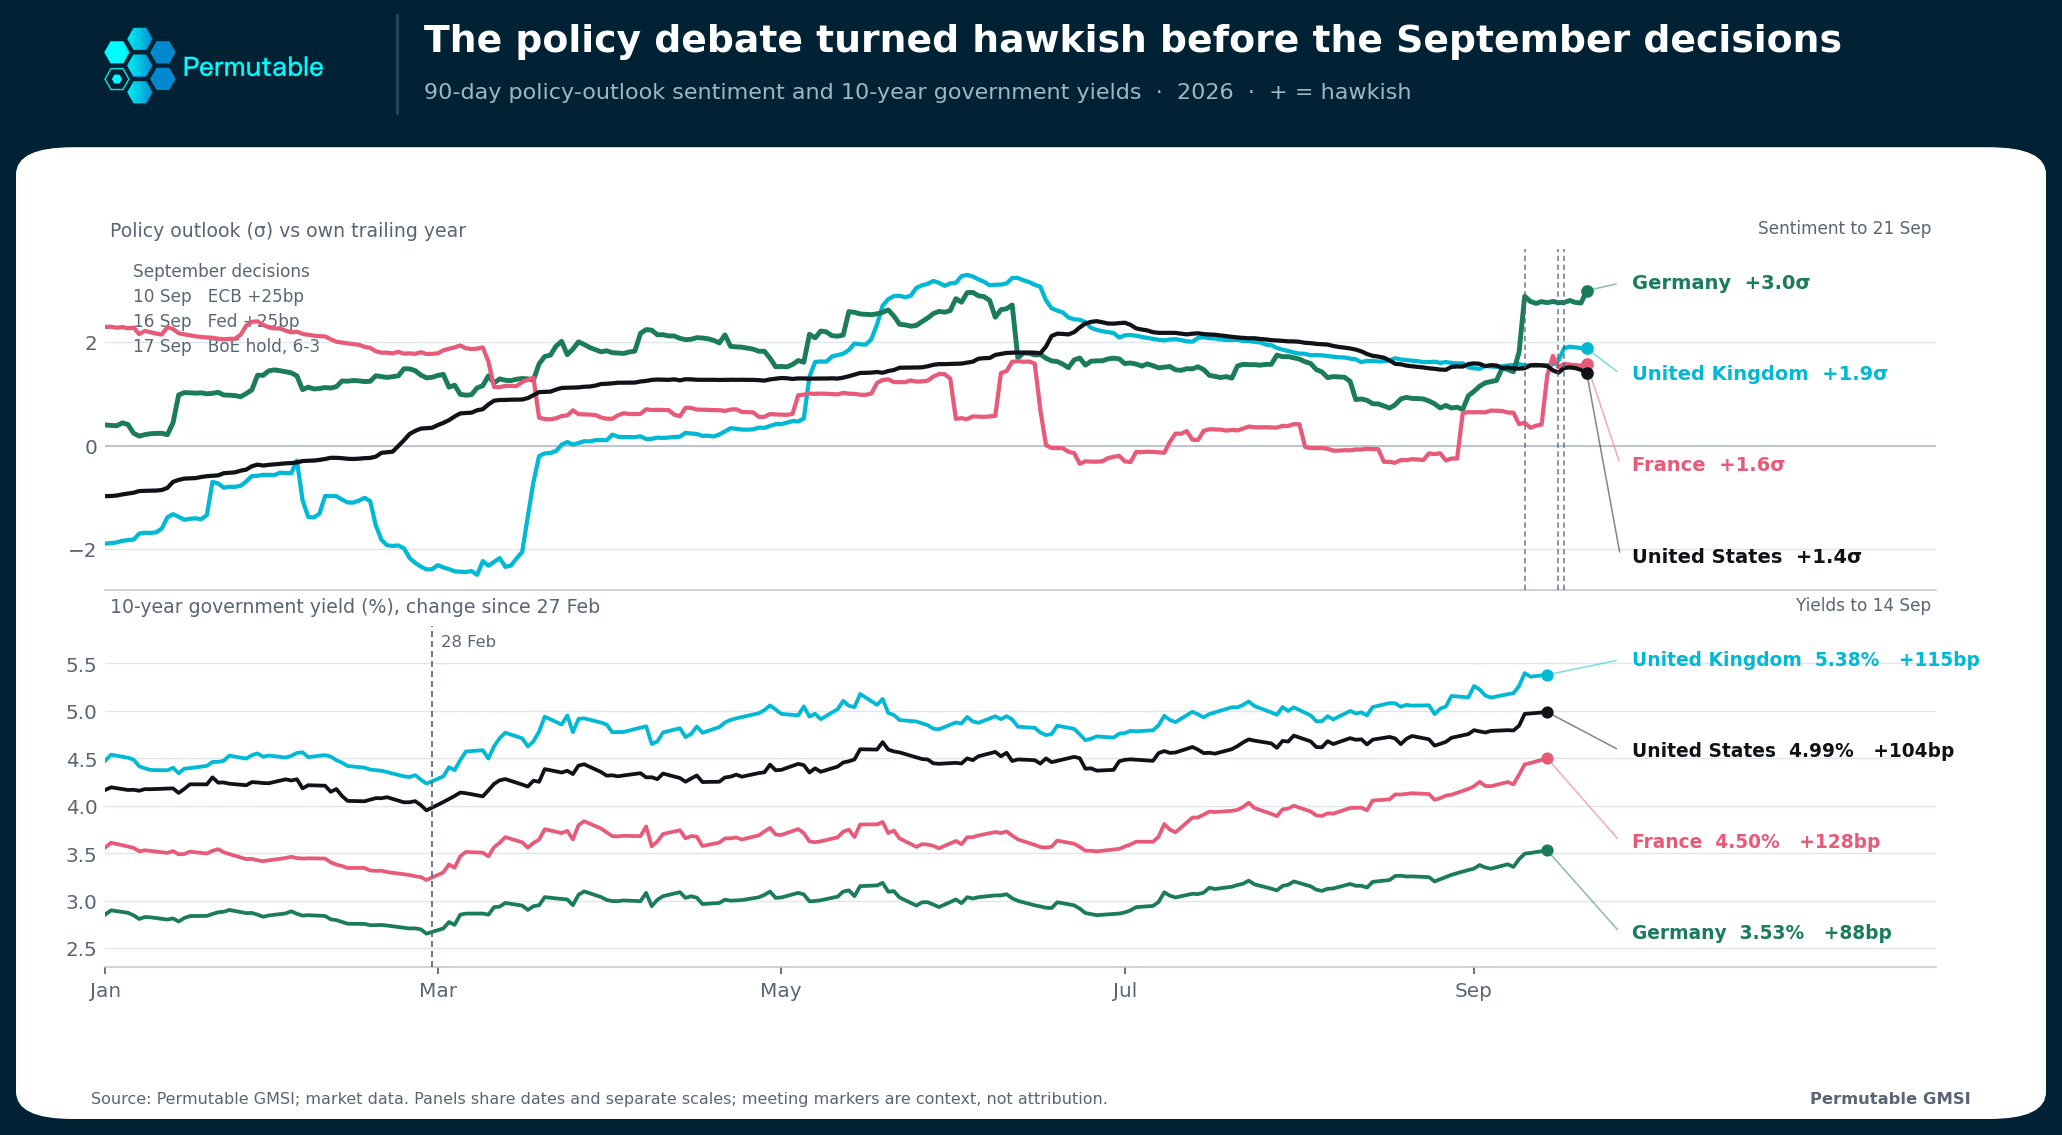
The ECB went to 2.50% on 10 September and the Federal Reserve to 3.75-4.00% on the 16th. The Bank of England held at 3.75%, with three of nine members voting to raise, and set out its reasoning with unusual candour: little evidence of second-round effects so far, a rising risk if energy prices persist, and inflation peaking above 4% in early 2027, precisely when the main wage round is settled.
That is pre-emption, not reaction. Our policy-outlook index measures how firmly the tightening case is held rather than how loudly it is stated. It reads 3.0 standard deviations above norm in Germany, 1.9 in the UK and 1.4 in the US. All three sit well clear of the inflation coverage that set the argument off.
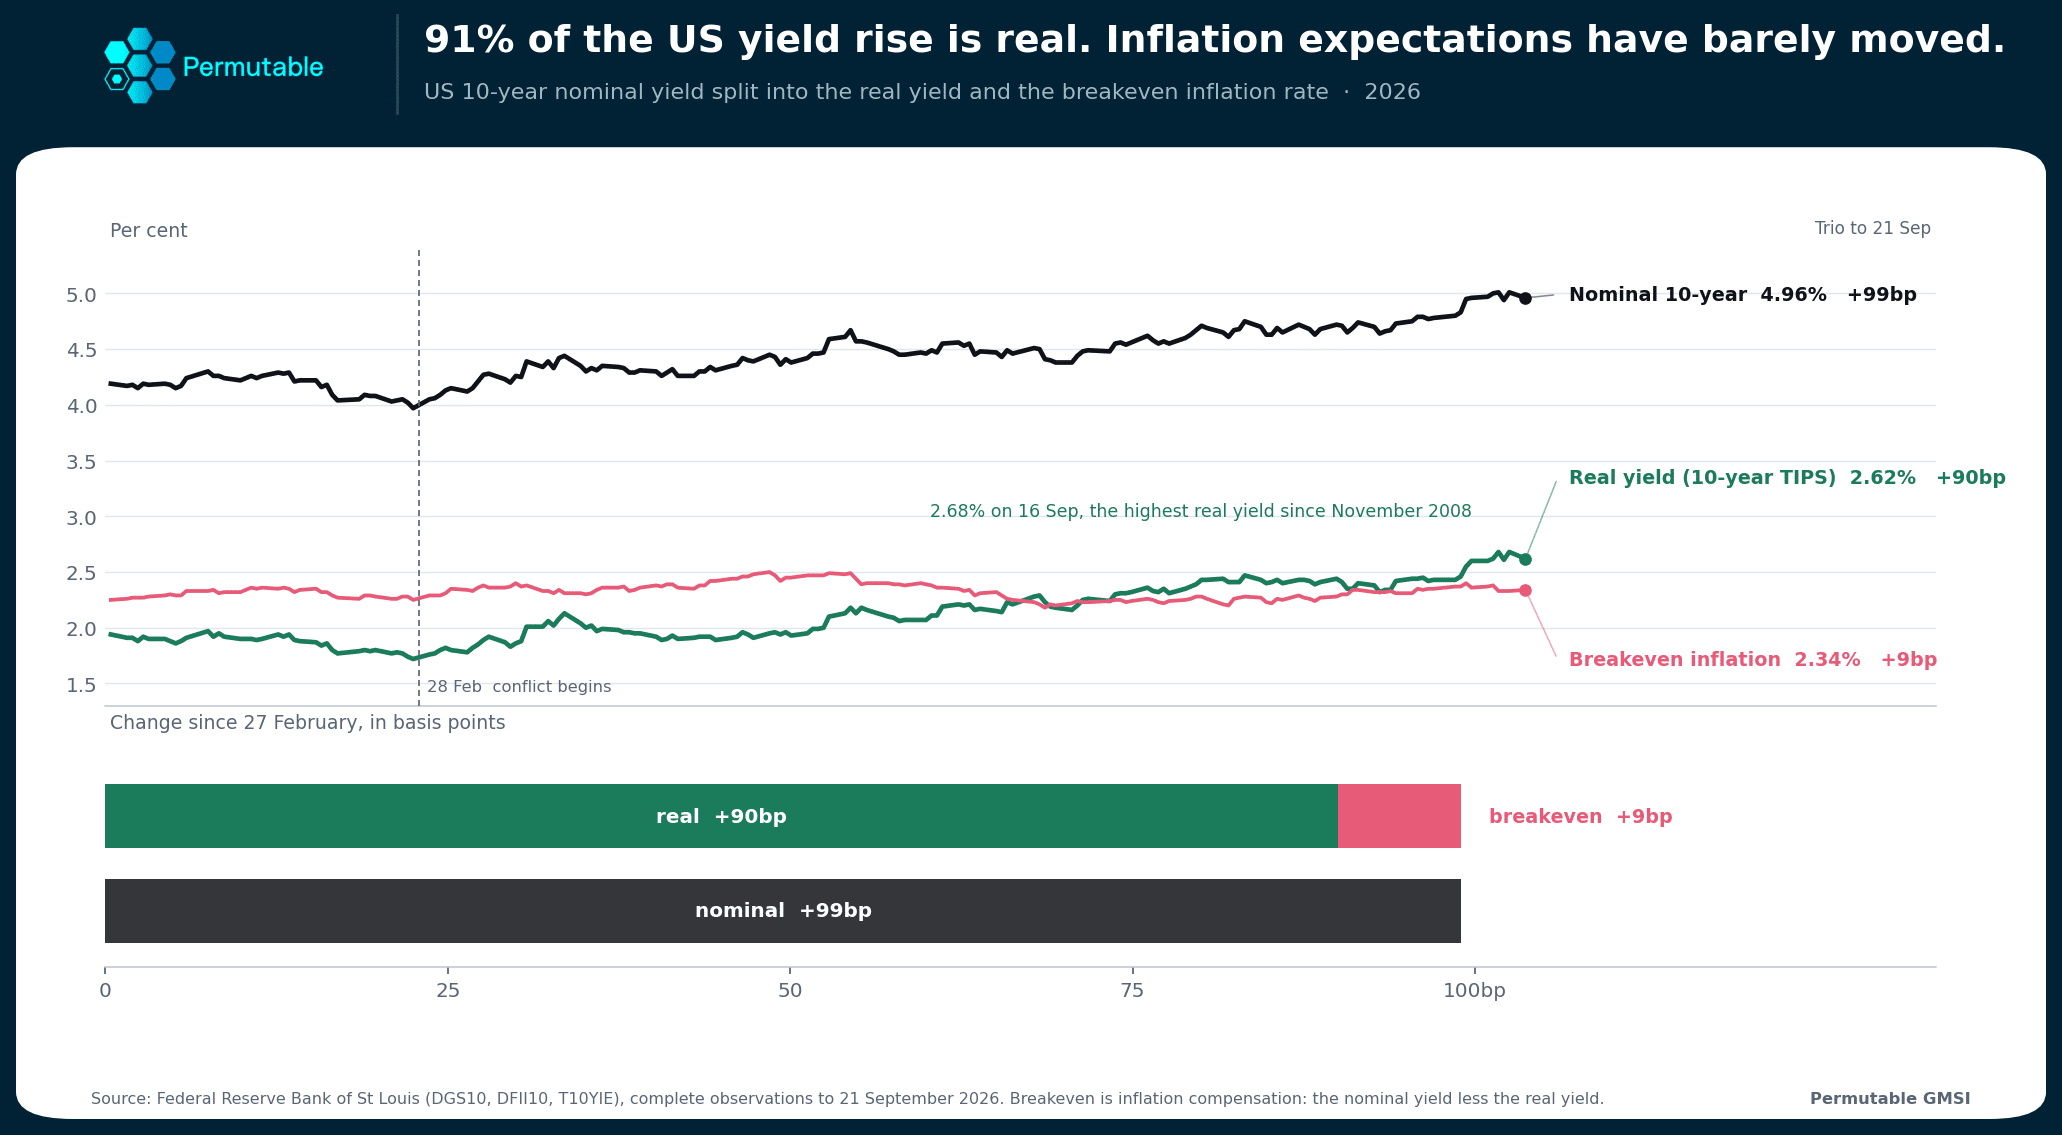
Between 27 February and 21 September the US 10-year yield rose 99bp to 4.96%. Ninety of those basis points came through the real yield, which touched 2.68%, its highest since November 2008. Inflation compensation supplied just 9bp.
That split is worth reading slowly, because it inverts the intuitive story. Investors are not buying protection against inflation. They are demanding a higher real return simply to part with their money, and demanding more of it the further out the loan runs. French 10-year yields are up 129bp since February, gilts 99bp, Bunds 81bp.
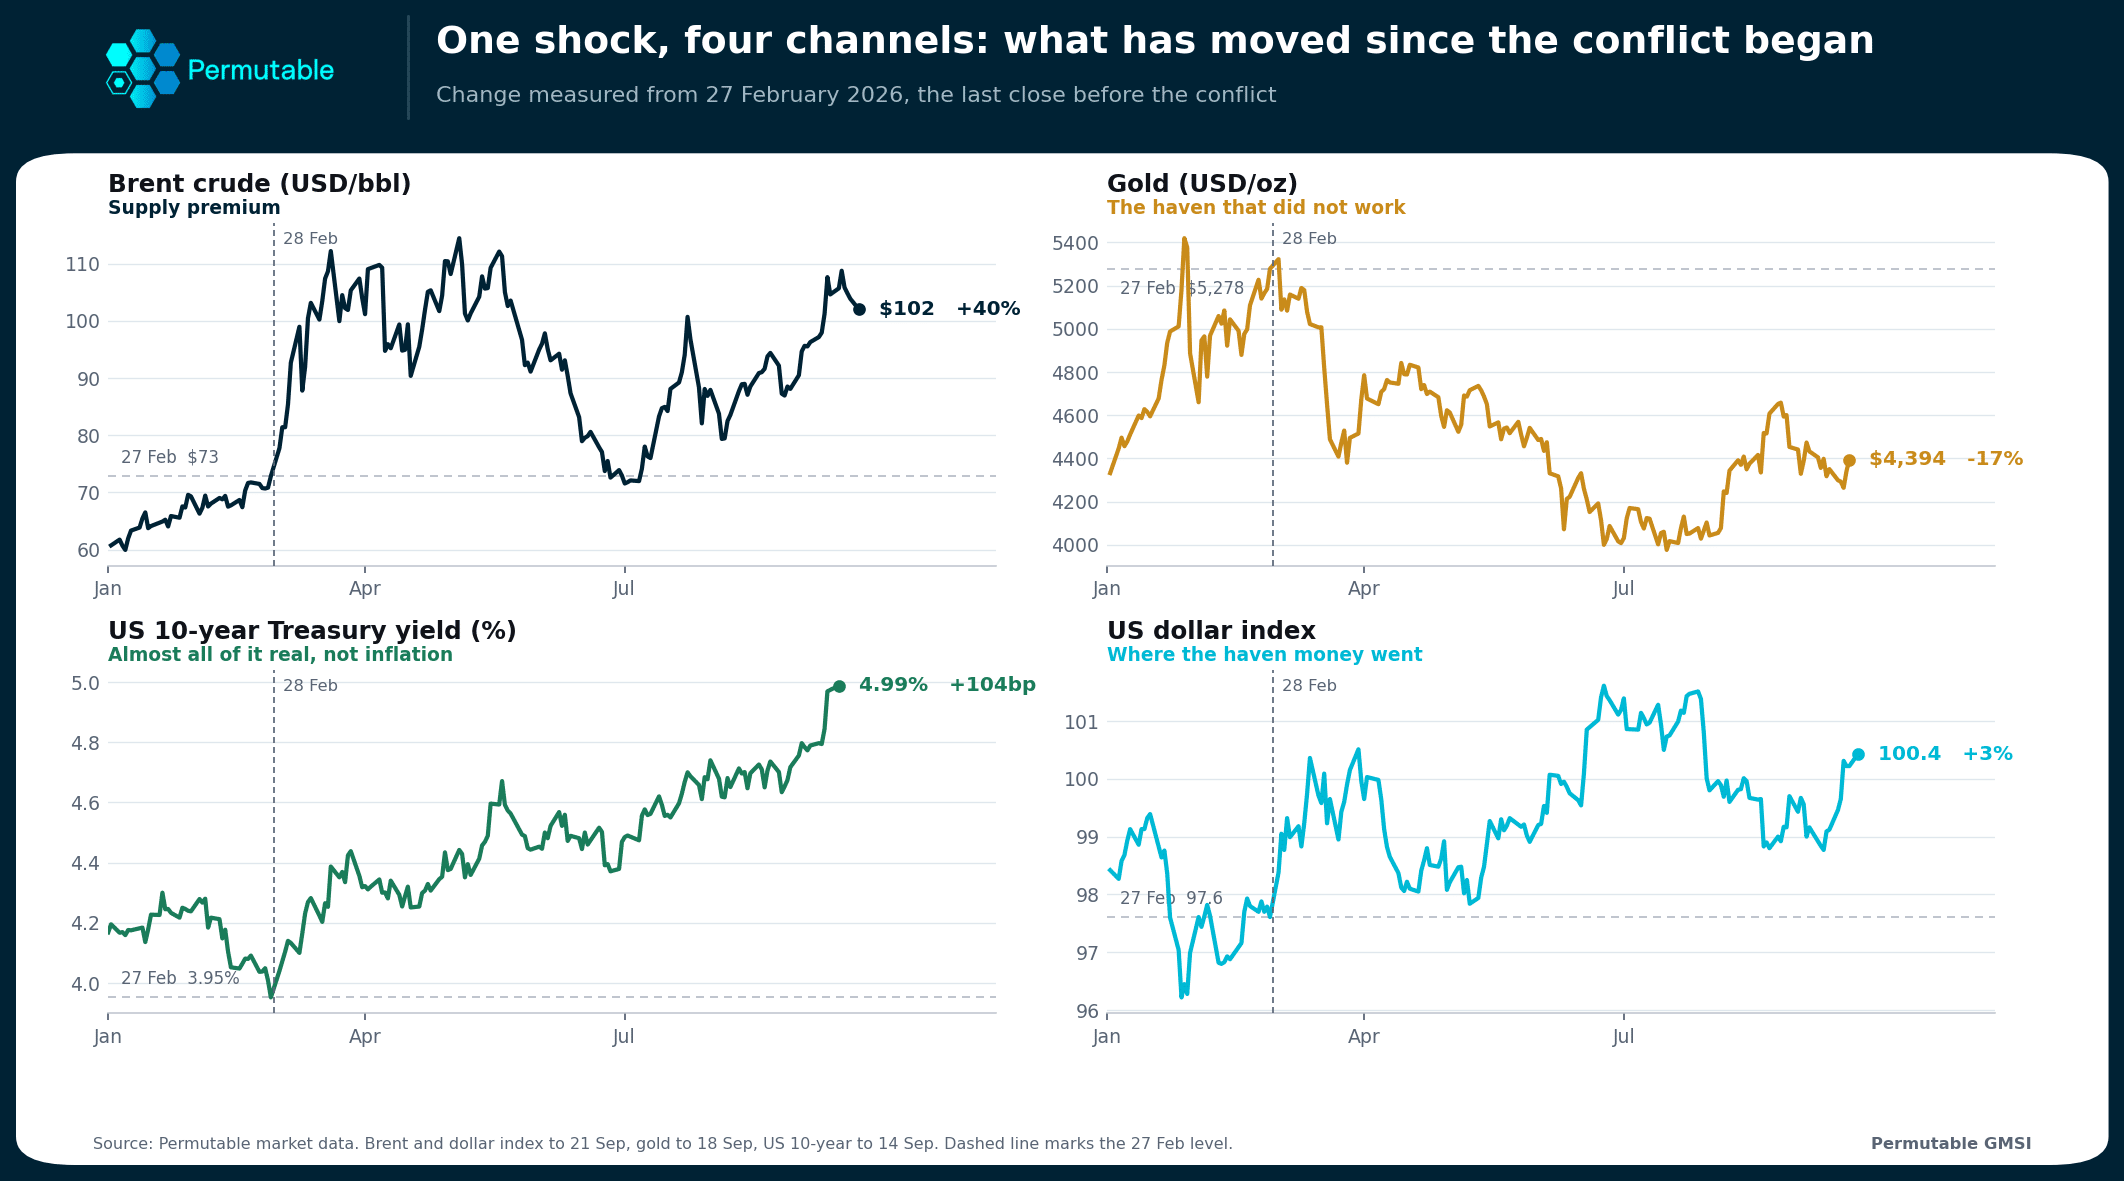
The repricing has sorted the traditional hedges too, and not in the order most would expect during a period of heightened geo-political tension. Gold, is 17% below where it started before the conflict. The dollar is up 3.3%. And the S&P 500 is up 12.9%, an equity market treating this as a rates event rather than a growth one as the tech and energy industry gathers pace.
The next stage is governed by a calendar rather than a chart.
In addition, Europe meets the coming winter 15.6pp short of its five-year average gas storage, and below the five-year low for the date. The shortfall widened through the refill season instead of closing: 12.9pp in April against 15.6pp now. A cold drawdown books an expensive refill, and that bill lands in 2027 as well.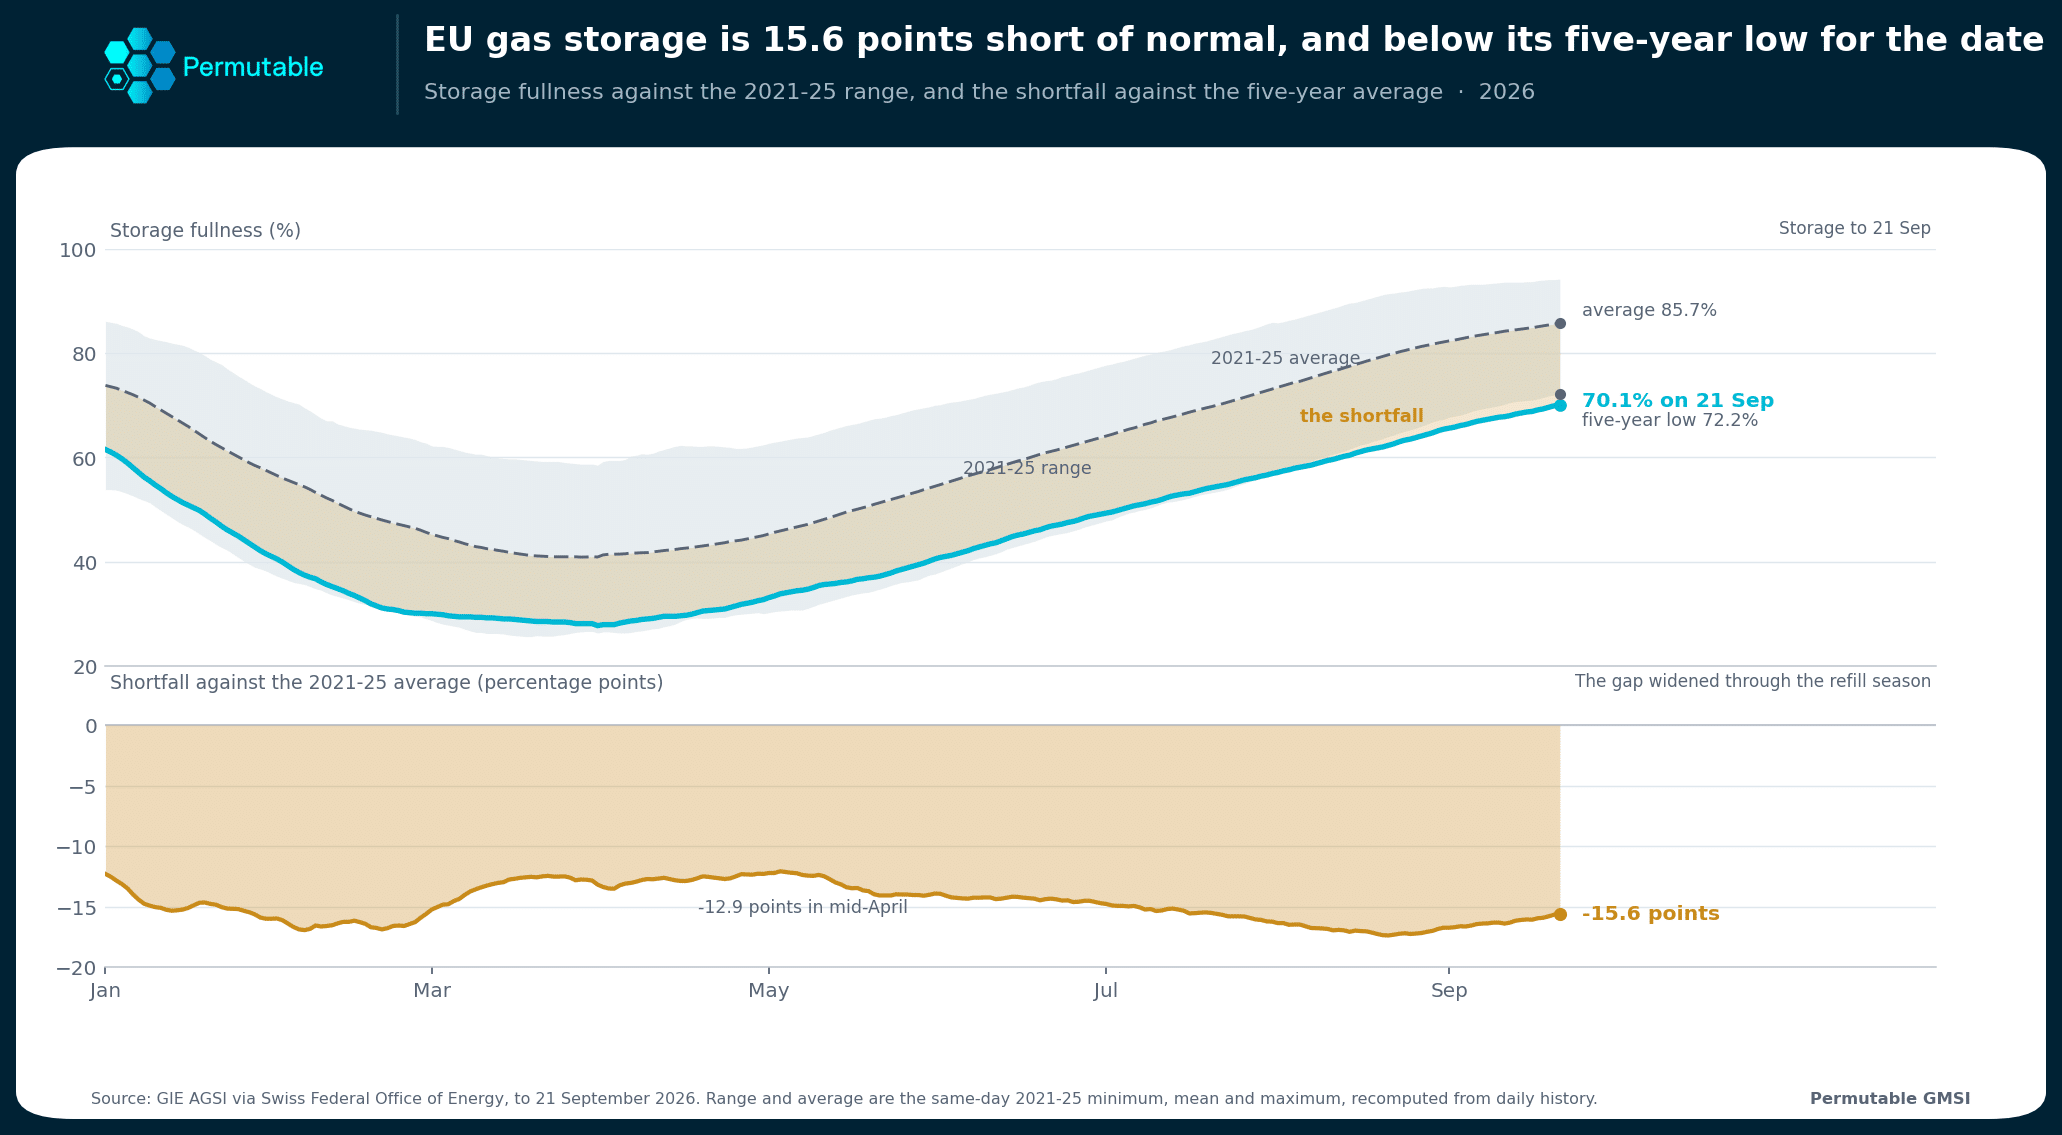
Four signals would tell you the chain is breaking rather than lengthening.
Every phase of this shock operates on a different timeframe, from real-time shipping logs to quarterly CPI releases. By mapping them simultaneously, sentiment data reveals structural macro shifts months before they reach official statistics.
See the shock before the data does. Permutable’s Global Macro Sentiment Indices score directional sentiment across 95+ economies and 70+ topics against each market’s own trailing year, point-in-time, with 11 years of history.