
This analysis examines an unprecedented rise in news attention to US sovereign creditworthiness during 2025. Permutable’s index reached 21.9 standard deviations, more than twice its previous decade high, before the dollar and gold produced historically unusual moves. It is aimed at macro investors, FX and rates desks, economists, strategists and researchers assessing sovereign credibility, market narratives and cross-asset risk.
In 2025, news attention to American sovereign creditworthiness moved far outside anything recorded in Permutable’s previous decade of data.
Our sovereign-credibility index – part of Permutable’s Global Macro Sentiment Indices – counts and scores coverage relating to US sovereign creditworthiness, aggregates it over a rolling 30-day period and measures the total against the preceding year. A reading of four indicates that coverage is four standard deviations above what the previous 12 months would have suggested.
Since the beginning of 2016, the index crossed that four-standard-deviation threshold on 193 of 3,469 days, grouped into eight separate episodes. Most were comparatively short and contained.
The episode beginning on 27 February 2025 was different.
Its peak reached 21.9z on 20 May, compared with a previous decade high of 9.5z. It remained an identifiable episode for 103 days, against 34 days for the longest previous episode.
The four-standard-deviation threshold itself was not unprecedented.
Our series had crossed it during seven previous episodes since 2016. What changed in 2025 was the magnitude and persistence of the move.
The reading reached 21.9z on 20 May, more than twice the previous decade high of 9.5z. The episode ran for 103 days.
Crucially, the dollar had not yet registered a comparable market move when the signal first crossed the threshold on 27 February. The US dollar index stood at 107.24, only 0.7% lower than 60 days earlier and 2.5% below its January high.
The rolling 30-day coverage total stood at 239 when the index crossed the threshold on 27 February.
By 4 June, it had reached 5,427 — an increase of almost 23 times.
The steepest acceleration came during the second half of May. Moody’s withdrew the United States’ remaining triple-A credit rating on 16 May, becoming the final major agency to do so. The index reached its maximum four days later.
The episode did not consist of a single rating event generating a one-day spike. The index had already entered unusual territory well before the May downgrade, and attention continued building for more than three months.
Market prices shifted sharply during the same episode, but the timing did not line up neatly with the maximum in news attention.
The US dollar index fell from 107.24 on 27 February to 96.88 by 30 June, a decline of 9.7%.
Gold rose from 2,876 to 3,434 by 21 April, a gain of 19.4%.
Both moves were therefore largely complete before the index reached its maximum in late May.
That distinction should remain prominent on the website. It prevents an unusual contemporaneous relationship from being presented as a simple lead-lag trading signal.
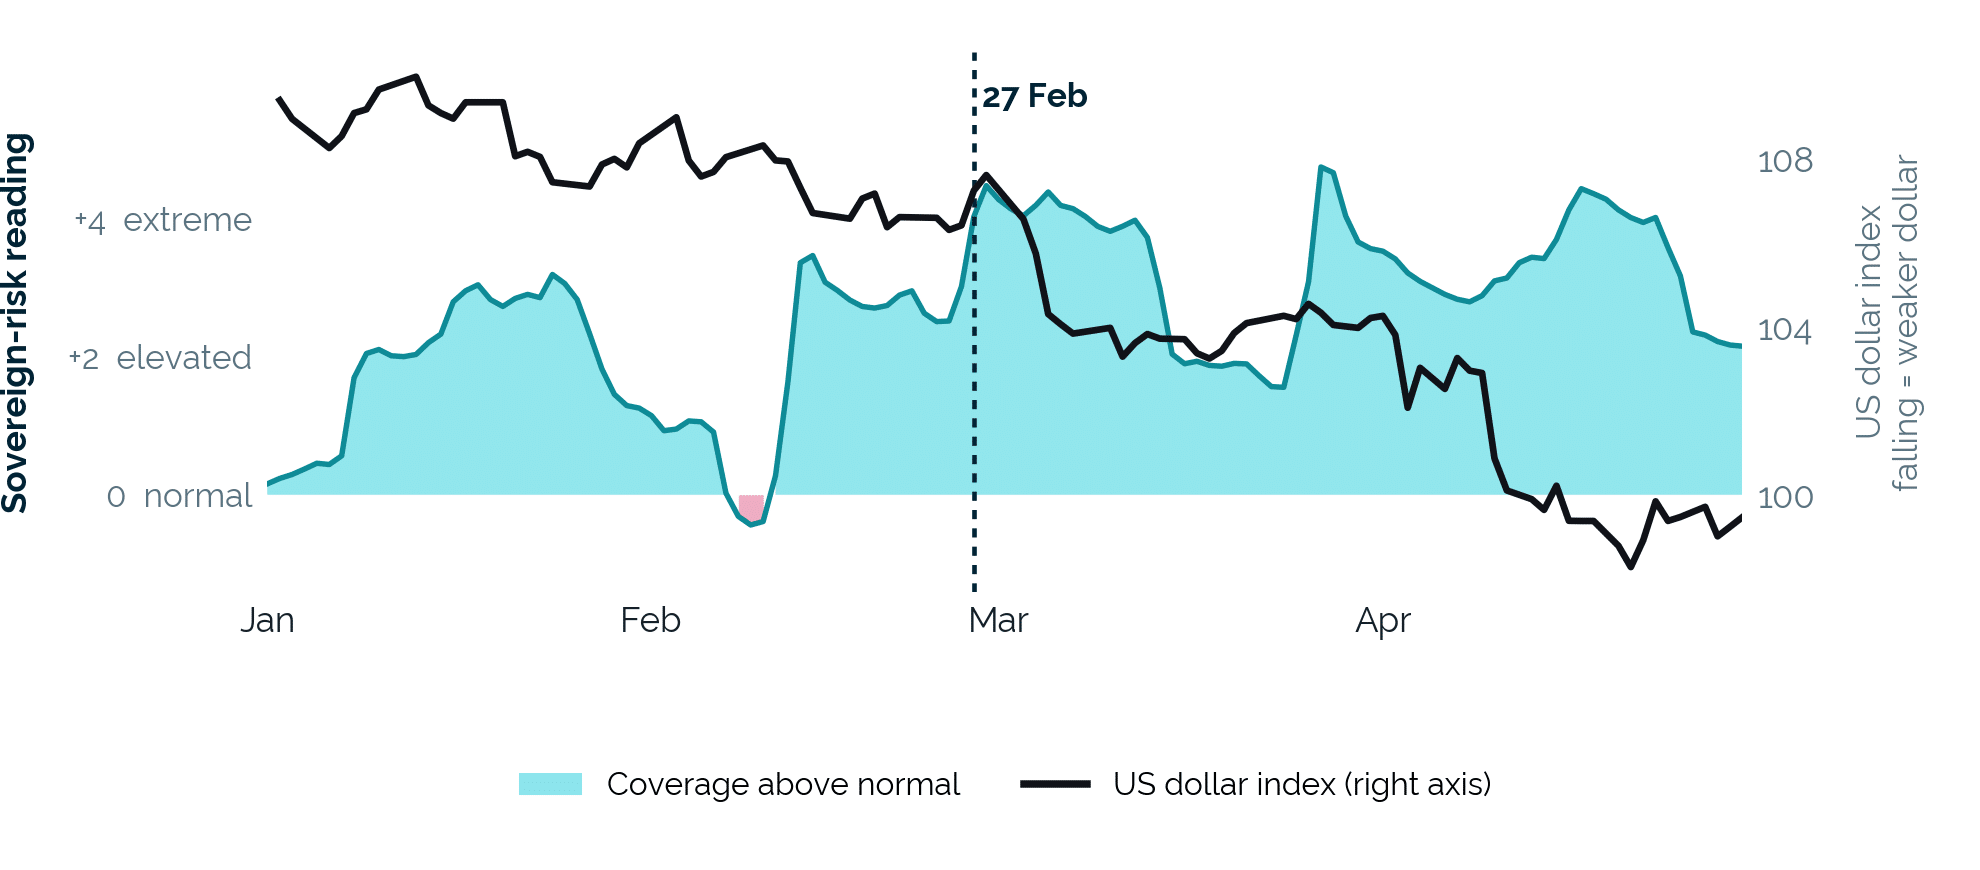 Above: US sovereign-creditworthiness coverage increased almost 23-fold between late February and early June; the dollar’s decline was largely complete before coverage reached its maximum.
The historical comparison makes 2025 more interesting — but also argues for caution.
Six earlier episodes have corresponding market data. Across the 63 days following those episodes, the dollar moved between −0.7% and +3.5%.
It rose in five of the six, with a median gain of 1.5%.
Historically, unusually elevated sovereign-creditworthiness readings had therefore coincided with mild subsequent dollar firmness, not major dollar weakness.
February 2025 fell outside that historical range.
Sixty-three days after the episode began:
Both outcomes were beyond those observed across the preceding episodes.
Our sovereign-credibility index recorded, using a fixed rule and in real time, that attention to American sovereign creditworthiness had reached a level without precedent in the history of the series.
It did so while the US dollar was still relatively close to its high for the year.
Permutable’s US sovereign-credibility index counts and scores news coverage relating to American sovereign creditworthiness. Coverage is aggregated over a rolling 30-day window and measured against the preceding 12 months.
Readings are expressed in standard deviations relative to that prior-year history. A value of +4 indicates that current coverage is four standard deviations above what the preceding year would have suggested.
For the episode analysis, readings above +4 occurring within 45 days of one another are treated as part of the same episode.
The analysis is descriptive and historical. The 2025 relationship between the sovereign-credibility reading and subsequent market moves is not presented as evidence of predictive causality or a standalone research signal.
Access the three-page analysis covering the scale of the 2025 sovereign-creditworthiness episode, the timing of the dollar and gold moves, comparison with previous episodes and the limits of what the evidence can establish.

Analysis
16 Oct 2026
Gold outlook 2026: Why US rates outweigh geopolitical risk
Read more >
Analysis
14 Oct 2026
Beneath US headline inflation: tracking pressure across energy, food, services and housing
Read more >
Analysis
13 Oct 2026
France’s debt alarm hits a decade high and drowns out the rest of the G20
Read more >