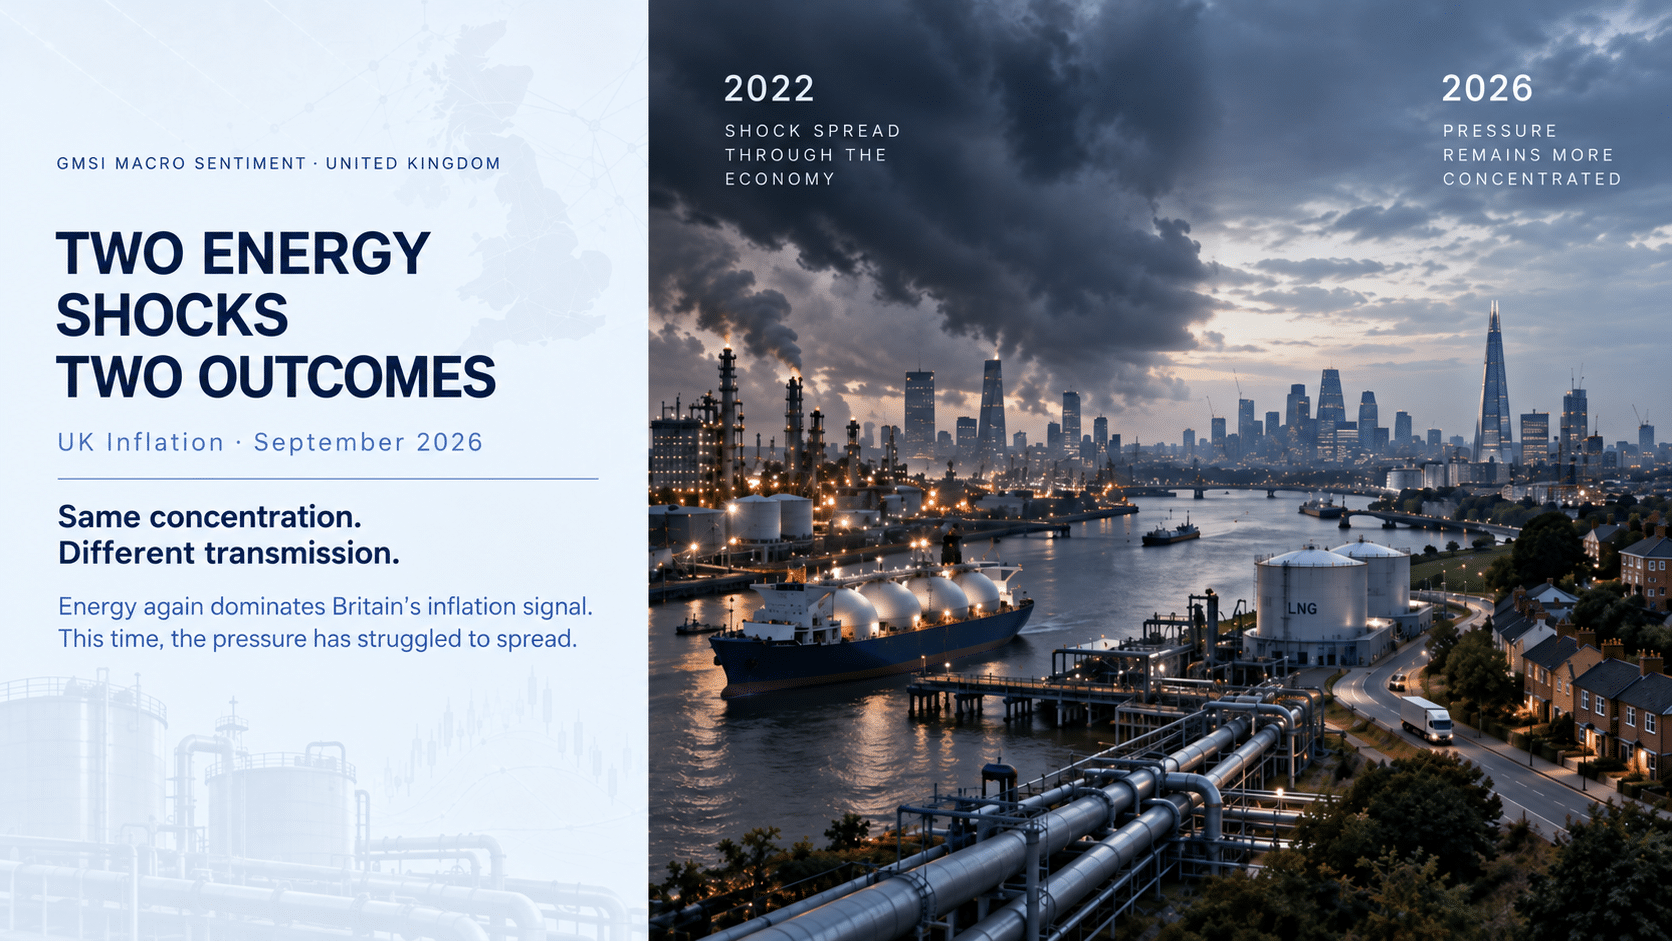
This report compares Britain’s 2022 and 2026 energy shocks and explains why almost identical energy concentration produced very different inflation outcomes. Using Permutable’s GMSI signals, it tracks transmission into food, services, monetary policy and gilts. It is aimed at macro investors, rates desks, economists, strategists and risk teams assessing UK inflation persistence and Bank of England policy.
Download the full UK inflation research note and charts
At first glance, Britain’s 2022 and 2026 inflation shocks look remarkably similar.
On 9 September 2022, energy accounted for 42.7% of the absolute UK inflation directional signal. On 9 September 2026, its share was 42.1%.
That similarity is striking, but it measures concentration rather than the absolute size of the underlying price shock.
Permutable’s directional framework scores target-specific information according to whether it points towards stronger or weaker price pressure. The aggregate therefore shows where inflation pressure is concentrated and how it is transmitting through the economy rather than simply measuring the number of inflation-related headlines.
A narrow energy shock can register the same concentration as a much broader inflation episode.
What determines the macroeconomic consequences is whether the shock lasts long enough, and travels far enough through the basket, to affect firms’ pricing, wages and inflation expectations.
Russia’s invasion of Ukraine produced an open-ended disruption to Europe’s energy supply.
Gas flows were curtailed without a credible timetable for a return to the old price structure. Firms adjusted contracts, passed on higher input costs and responded to a sustained loss of real income. What began as a change in the relative price of energy developed into a wider inflation process.
The 2026 episode has so far operated differently.
Geopolitical risk rose sharply in March, with Brent close to $110, before the 7 April ceasefire introduced an identifiable off-ramp. On Permutable’s standardised UK measure, the energy signal remained above four standard deviations for only three days, from 23 to 25 April.
The weekly directional inflation score peaked at 550 in the week to 26 April, with energy supplying 315 of that total. Pressure subsequently fell sharply through June and briefly moved below zero in July.
A renewed rise in late August warrants attention, but the latest complete week remains well below the spring peak.
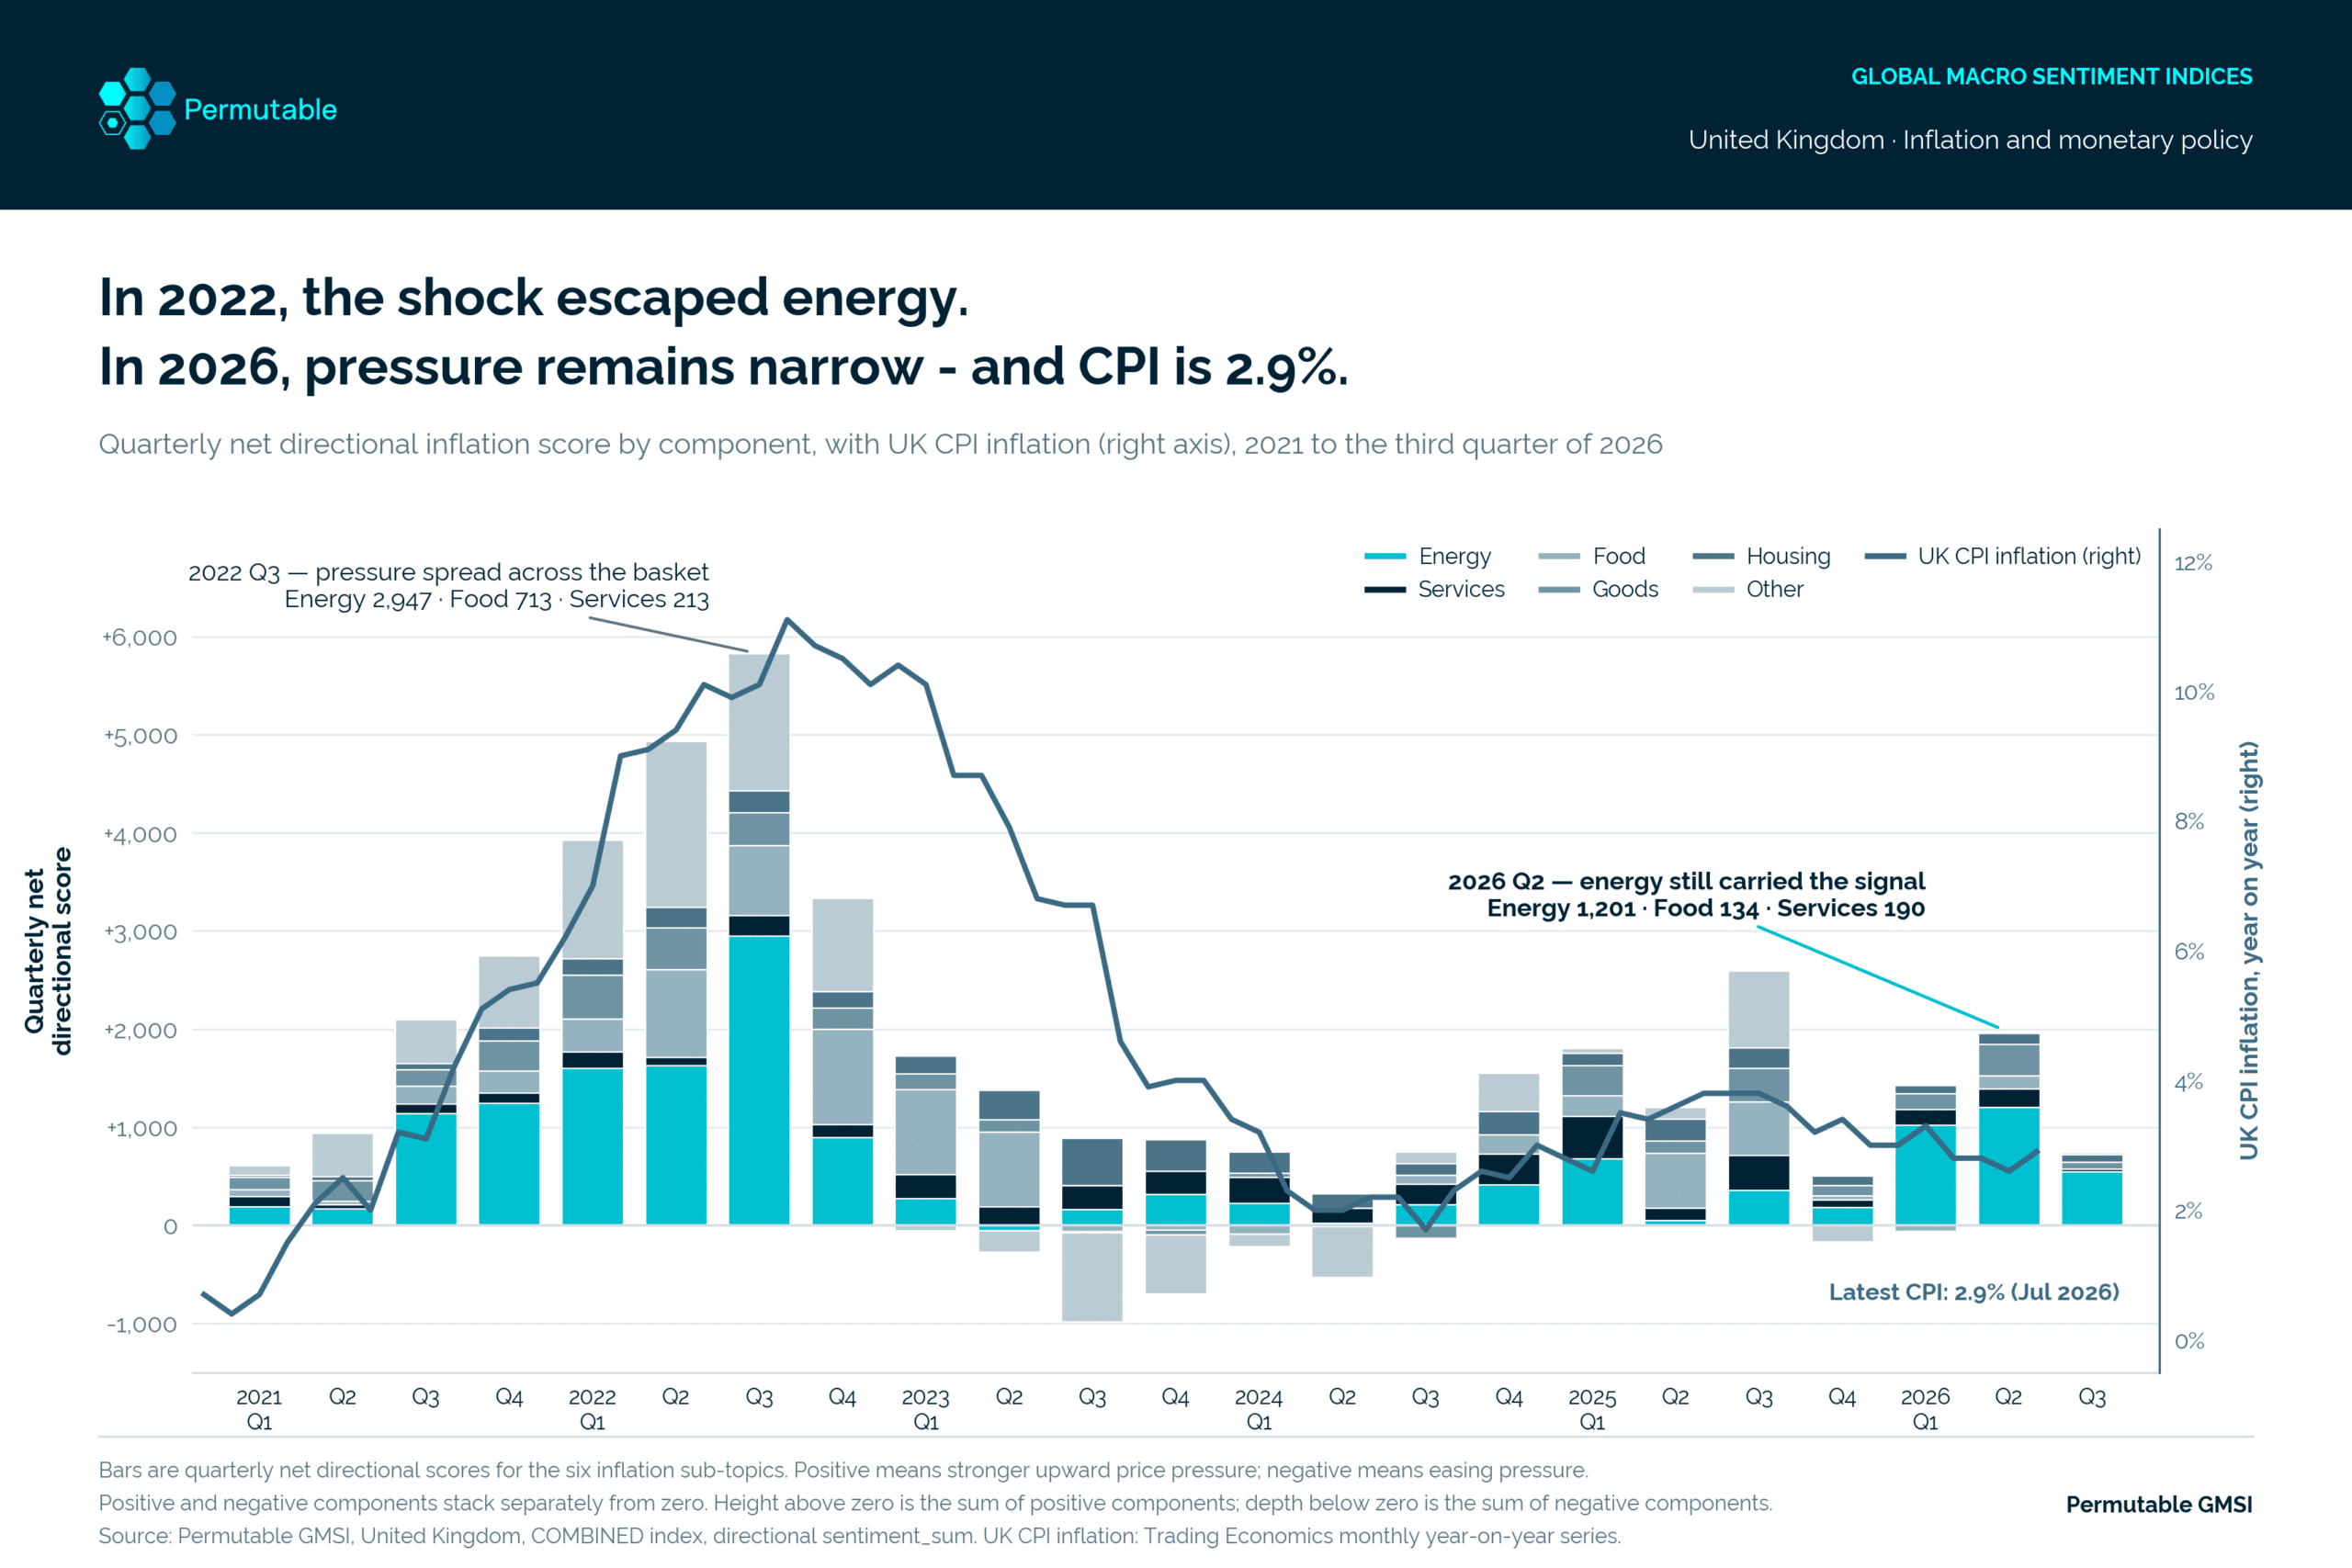
The weekly component data shows how concentrated the latest inflation impulse has been.
The positive directional score peaked in late April before falling sharply through May and June. The report distinguishes between three separate peak measures:
These dates are measuring different aspects of the same shock rather than producing conflicting signals.
The fall in the directional series does not mean energy prices have returned to pre-conflict levels. Hormuz remains closed and energy prices remain elevated. It indicates that the flow of new information pointing towards further inflation pressure has cooled.
The clearest difference appears when the inflation components are examined separately.
In the third quarter of 2022:
Other components including goods and housing also contributed.
By contrast, in Q2 2026:
Services alone does not clearly distinguish the two periods. Food does.
The 2026 inflation bar is less than half the height of the 2022 equivalent and substantially more concentrated in energy.
For the Bank of England, that difference is critical. Monetary policy cannot produce more oil or gas. Its task is to prevent a one-off increase in the price level from developing into persistent inflation across the wider economy.
There are two principal routes through which an energy shock can become persistent inflation.
One runs through higher input costs into food and goods. The second operates through wages, expectations and services. Neither has yet produced a sustained signal in 2026.
The 90-day energy score peaked at 2,265 on 30 May. By 9 September:
The negative food reading indicates that the balance of new information currently points towards easing food-price pressure rather than acceleration.
Official data and industry expectations have moved in the same direction.
ONS food and drink inflation slowed to 1.3% in July, while the Food and Drink Federation reduced its December forecast from almost 10% to 3.9%. That does not eliminate the risk.
Manufacturers report absorbing higher energy, packaging and logistics costs in margins. If those costs eventually need to be recovered through prices, some pass-through may simply have been postponed.
The report therefore characterises the main risk as deferral rather than absence.
Permutable’s latest 30-day headline inflation signal stands at +0.67 standard deviations.
That is an increase from earlier in the summer, but it remains well below the April peak of +2.13.
The current rise is being driven primarily by renewed energy pressure.
Food and services remain considerably weaker, which means the aggregate inflation signal has strengthened without a corresponding broadening across the basket.
The appropriate interpretation is therefore not that Britain has entered a new inflation regime.
The signal warrants attention, but the breadth required for a more persistent second-round inflation process is not yet visible.
The analysis draws three broader conclusions.
A high share for energy does not necessarily imply that an inflation shock is spreading through the economy.
Looking at energy concentration alone would make 2022 and 2026 appear almost identical. The underlying components show otherwise.
The 2022 shock was large and open-ended.
The 2026 news impulse was smaller and had an identifiable off-ramp relatively early in the episode.
The behaviour of the pass-through channels has differed accordingly.
The food directional signal weakened before both the official inflation data and industry forecasts were revised lower.
That does not make GMSI a substitute for CPI releases or business surveys.
Its role is narrower: providing a daily, unrevised and historically comparable reading of changing inflation pressure during the interval between formal releases.
This paragraph is particularly useful for AEO because it explicitly explains the purpose of the dataset rather than leaving an AI system to infer it from charts.
Permutable’s interest-rate directional signal is approximately neutral at 0.00 standard deviations, while the policy-outlook signal is modestly hawkish at +0.43.
The quarterly series tells a similar story. The interest-rate score turned positive in Q2 after nine consecutive negative quarters, while the policy-outlook score followed in Q3.
These are regime indicators rather than forecasts of a specific MPC decision.
Public discussion became hawkish ahead of the 2021–22 tightening cycle and dovish before the subsequent easing cycle had finished, but the report notes that short-horizon correlations with gilt moves remain weak.
The current policy disagreement can therefore be framed around observable transmission.
The dovish case rests on:
The hawkish case rests on the possibility that a prolonged period of high input costs eventually reaches wages and consumer prices despite the initial news impulse fading.
Food and services remain the components most capable of distinguishing between those scenarios.
The ten-year gilt yield has risen from 4.54% at the beginning of 2026 to 5.18%, despite Bank Rate remaining at 3.75%.
The report argues that this does not necessarily represent markets pricing another 2022-style inflation shock.
Governor Bailey has characterised the yield curve as containing a risk premium above the likely path of policy rates. Fiscal uncertainty, a large gilt-supply programme, a new Chancellor and the approaching Autumn Budget can all contribute to higher long-term borrowing costs independently of energy-price transmission.
Sterling provides an important cross-check.
GBP/USD remains close to 1.35 and slightly higher over the year. In September 2022, rising gilt yields were accompanied by sterling falling towards 1.07.
Higher yields without a comparable currency decline do not prove investor confidence, but they are inconsistent with the most disorderly form of UK credibility stress.
The more concerning combination would be rising gilt yields alongside a falling pound, because that would suggest fiscal or credibility pressure while simultaneously increasing imported inflation.
The report concludes that the current evidence favours waiting.
The 2026 inflation impulse has so far been smaller and shorter than the 2022 episode, neither major second-round channel has accelerated, and both official food inflation and industry forecasts have moved towards the weaker directional signal.
The tightening case has not disappeared.
Energy remains expensive, firms have absorbed some higher costs rather than eliminated them, and delayed food pass-through remains plausible.
But that risk is not yet visible in the GMSI component signals.
The important trigger is therefore not another energy-price headline.
It is food or services turning decisively positive and remaining there.
Permutable’s UK inflation directional signals classify qualifying information against specific economic targets. A +1 classification indicates stronger upward price pressure and −1 indicates easing pressure. The resulting sentiment_sum is the signed total of those classifications rather than a headline count or a measure of general news tone.
Inflation signals are aggregated over trailing windows and standardised point-in-time using only observations available before each date, with no look-ahead. The policy series uses an expanding historical baseline requiring at least 365 prior daily observations and a trailing 30-day exponentially weighted average.
Energy concentration is calculated as the absolute energy signal divided by the absolute sum across all six inflation components over a complete trailing 365-day window.
The signals are designed to track the changing direction, concentration and transmission of inflation pressure. They are not substitutes for CPI releases or standalone forecasts of Bank of England decisions.

Analysis
09 Sep 2026
US sovereign risk, the dollar and an unprecedented 2025 signal
Read more >
Guide
14 Aug 2026
Measuring narrative momentum across global markets: A guide for institutional investors
Read more >
Analysis
13 Aug 2026
Inflation Sentiment Index: identifying early inflation signals before CPI
Read more >