TAXONOMY

Our ESG taxonomy is a comprehensive, standardized framework for assessing and categorizing environmental, social, and governance (ESG) factors in the investment process. It is designed to provide a common language for investors, companies, and other stakeholders to understand and assess the impact of ESG factors on the financial performance of companies and investments.
Permutable strives to provide the best in ESG taxonomy to allow for full extraction of datapoints from global public data-sources. We use over 1000+ markers to label ESG data. Below are a sample of markers we use on our datasets.
Emissions
Clean Water
Supply Chain
IP
Tax Transparency
Biodiversity
Deception
Staff Health-Care
Corruption
Data Security
Green Energy
Life on Land
Social Equality
Business Ethics
Governance
Mining
Pollution / Waste
Health and Safety
Defamation
Class Action
Natural Disasters
Deforestation
Human Rights
Money-Launder
ESG SENTIMENT SCORING METHODOLOGY
ESG SENTIMENT SCORING METHODOLOGY FAQ
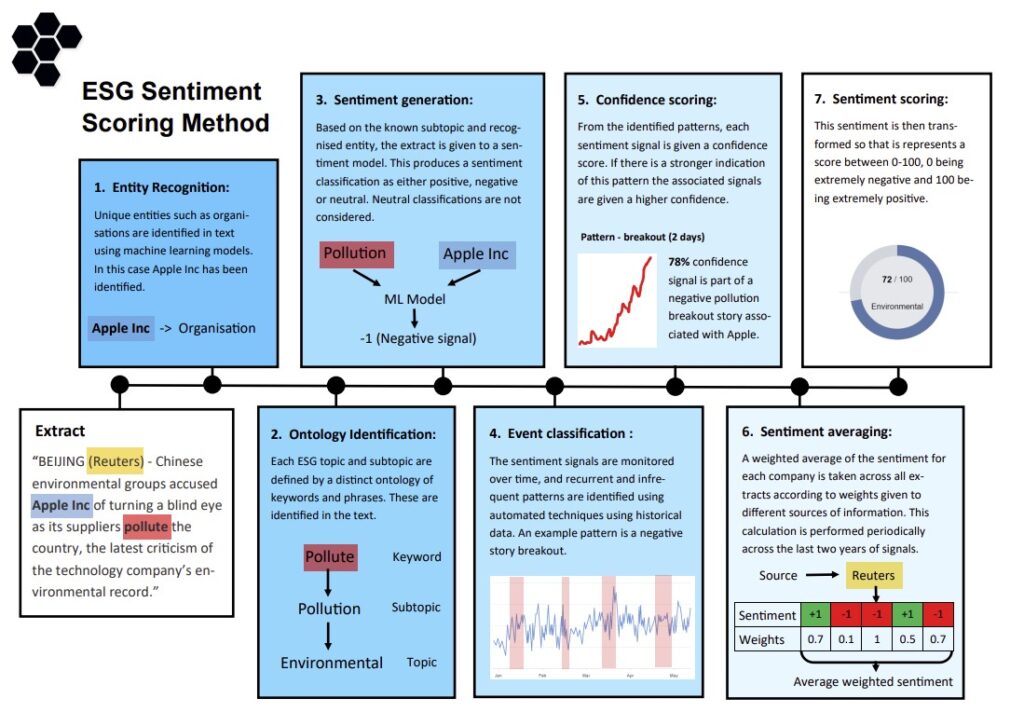
Our methodology for assessing sentiment towards Environmental, Social, and Governance (ESG) factors is both comprehensive and meticulous. It starts with a rigorous daily scan of over 500,000 global articles, utilising advanced AI algorithms and data analytics. Here’s a step-by-step breakdown of our process:
Entity identification – initially, our machine learning models identify unique entities such as organisations within the text.
Ontology definition – we then define ontologies, which include specific keywords and phrases related to each ESG topic and subtopic, and apply these to the text to contextualise the data.
Sentiment analysis – the text, along with recognised entities and subtopics, is submitted to our sentiment model. This model classifies the sentiment as either positive or negative.
Pattern recognition – we monitor sentiment signals over time, identifying both recurrent and rare patterns, such as surges in negative sentiment. These patterns are recognised using historical data to ensure accuracy.
Confidence scoring – confidence scores are then assigned to these signals based on the strength and consistency of identified patterns.
Weighted averaging – the sentiment signals undergo a weighted averaging process across various information sources for each company. This averaging is performed periodically over the last two years to maintain current relevance.
Scoring transformation – finally, sentiment scores are calibrated on a scale from 0 to 100, where 0 indicates extreme negativity and 100 reflects extreme positivity.