
Permutable’s commodity signals gained 24.8% in 2026 as coverage expands to 19 markets
28 Sep 2026
28 Sep 2026
This announcement reports a 24.8% gain during 2026 for Permutable’s commodity model in a live paper evaluation through 22 September, alongside expanded coverage of 19 assets across energy, agriculture and metals using its next-generation of signals. It is aimed at institutional investors, commodity traders, quantitative researchers and portfolio managers assessing explainable market intelligence, signal performance and connections between news, supply risks and commodity prices. Results marked to 22 September 2026
We began live tracking our commodity signals in October 2024 with six markets. We now cover 19 major assets across energy, agriculture and metals. The wider coverage lets us test whether the information we extract from news remains useful beyond the original group of markets.
In our live paper evaluation using our next-generation of signals, the model gained 24.8% in 2026 to 22 September, compared with approximately 13.2% for the S&P 500 over the same period. Its cumulative gain since live tracking began was 74.0%. The model recorded 13.1% annualised volatility and a 5.3% maximum peak to trough decline during 2026.
These results are evidence from a live paper evaluation of our signals; not returns earned by clients or an investment product.
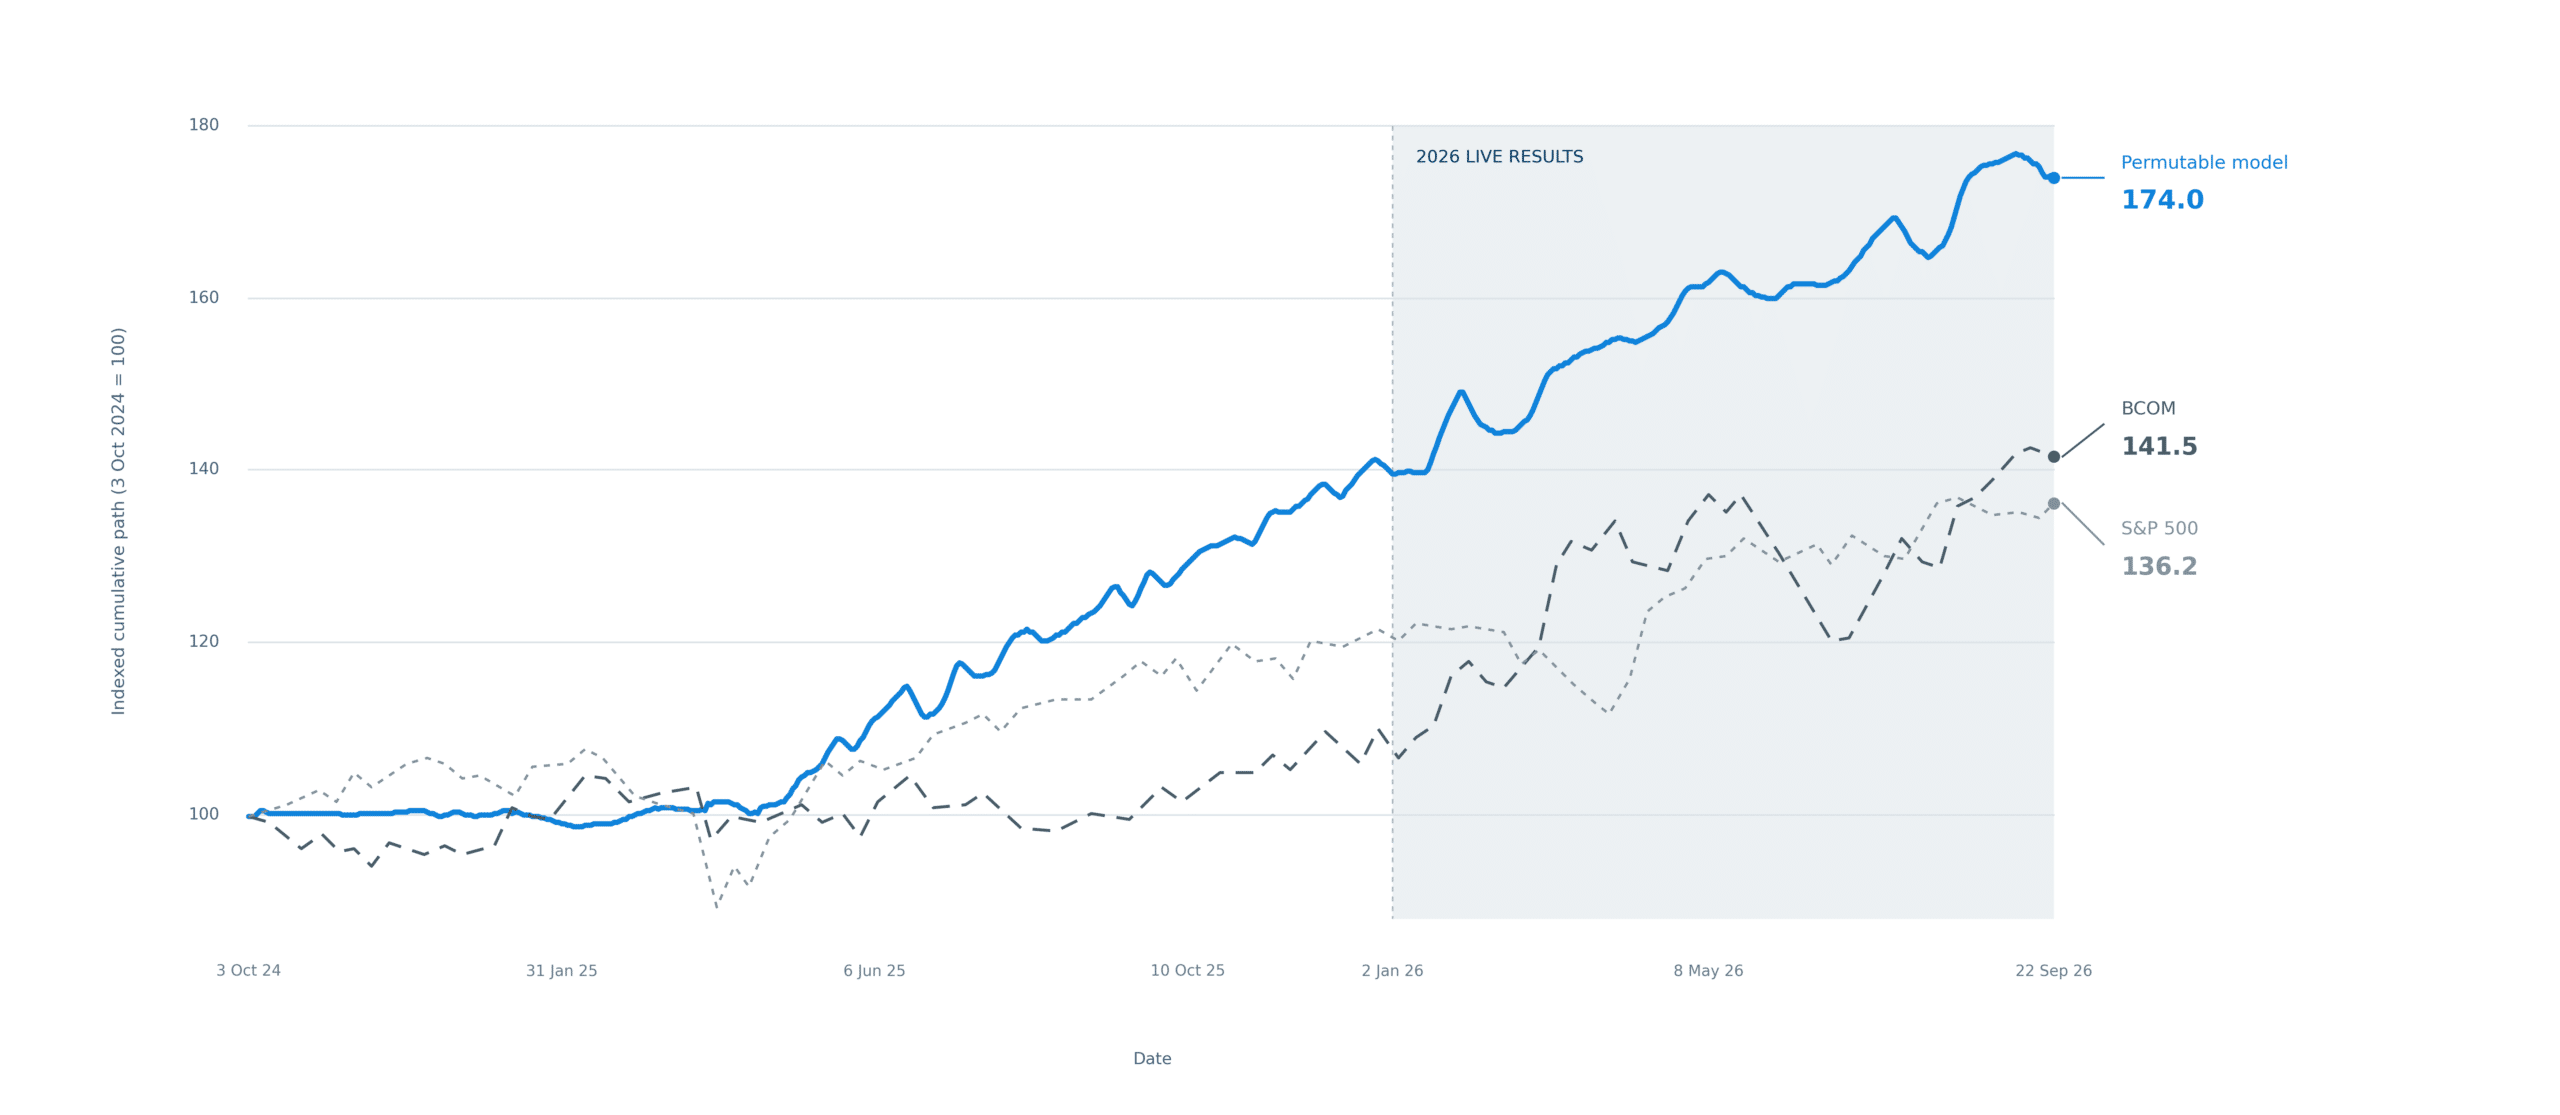
105 weekly marks · Indexed cumulative path · 3 October 2024 = 100. Source: Permutable live results · Marked 22 September 2026
How to read this chart: over the full live period, Permutable’s model reached 174.0, versus 141.5 for BCOM and 136.2 for the S&P 500. During 2026, it remained ahead of the S&P 500 but trailed a sharp rise in commodity prices represented by BCOM. These are reference comparisons, not like-for-like products.
The six markets in our earlier work gave us a way to test how news about supply, demand, policy and geopolitics translated into commodity signals. Expanding to 19 assets puts that approach under a broader test.
A disruption in oil or gas can raise costs for metals producers and farmers. Poor weather can cut crop supply, while sanctions can change where cargoes go and what buyers pay. With coverage across energy, agriculture and metals, we can track when pressure in one market starts to show up in another and trace the news behind it.
Positive contributions in 2026 came from all three groups. That breadth is useful to examine alongside the overall result: it shows where the model’s performance came from, rather than leaving investors with a single headline number.
On an index starting at 100 on 3 October 2024, our live paper model stood at 174.0 on 22 September 2026. The Bloomberg Commodity Index (BCOM) stood at 141.5, and the S&P 500 at 136.2.
Our model was ahead of the S&P 500 during 2026, but behind the sharp rise in commodity prices represented by BCOM that year. These indices provide familiar reference points. They are not directly comparable products: our paper model takes both positive and negative views and uses leverage, while BCOM and the S&P 500 are long-only indices.
For us, the purpose of the live evaluation is to keep testing the signals against market outcomes as events unfold. Our intelligence is available to institutional teams through our API with the underlying narrative drivers and sources available for examination.
“Expanding from six markets to 19 gives us a much tougher test of the signals. Oil, metals and crops respond to different forces, but the news affecting them often overlaps. We want investors to be able to follow those links back to the underlying evidence and judge where the signal is coming from.”
Wilson Chan, Founder and CEO, Permutable
“Our live paper results give clients a way to assess the signals over time. The wider coverage gives them more to work with day to day: they can examine a move across commodity markets, see the narratives behind it and decide whether it is relevant to their own view.”
Michael Brisley, Chief Commercial Officer, Permutable
Explore the live results and methodology or speak to our team about using the signals in your own research and investment workflow.
Performance disclosure: This is a live paper evaluation of point-in-time signals, not a traded or marketed product return. Prices use rolling front-month contracts and are subject to capacity. Results exclude transaction costs, roll costs, fees and execution slippage. The modelled portfolio can take both positive and negative views and uses leverage. BCOM and the S&P 500 are long-only indices shown as reference points, not directly comparable investment products. Past or simulated performance is not a reliable indicator of future results.
Tell us which commodity markets and decisions you’re focused on. We’ll show you the signals, the news behind them and the live results, then help you assess how they could fit into your research or investment process.

16 Oct 2026
Permutable wins AI Innovation of the Year: Europe at the Euromoney Markets Awards 2026
Read more >
Analysis
16 Oct 2026
Gold outlook 2026: Why US rates outweigh geopolitical risk
Read more >
15 Oct 2026
Permutable brings inflation sentiment data across 95 countries to Macrobond
Read more >