Permutable is enhancing the user experience of their ESG analytics company database with the addition of the latest functionality within their ESG toolkit with the addition of geolocation functionality.
Access to accurate real-time data is the key to unlocking actionable ESG analytics for businesses to identify and tackle ESG risks as they happen. This latest product enhancement allows clients to access ESG data via location tagging including country data source, geo location-specific details on the origin of the incident as well as ESG category. This is in addition to the existing full suite of ESG ratings, markers, and insights already provided by the company’s ESG analytics.
Reports can be accessed on all countries and all major cities, helping businesses identify potential ESG issues within a particular location and offering an in-depth analysis of a company’s ESG impact by geographical area.
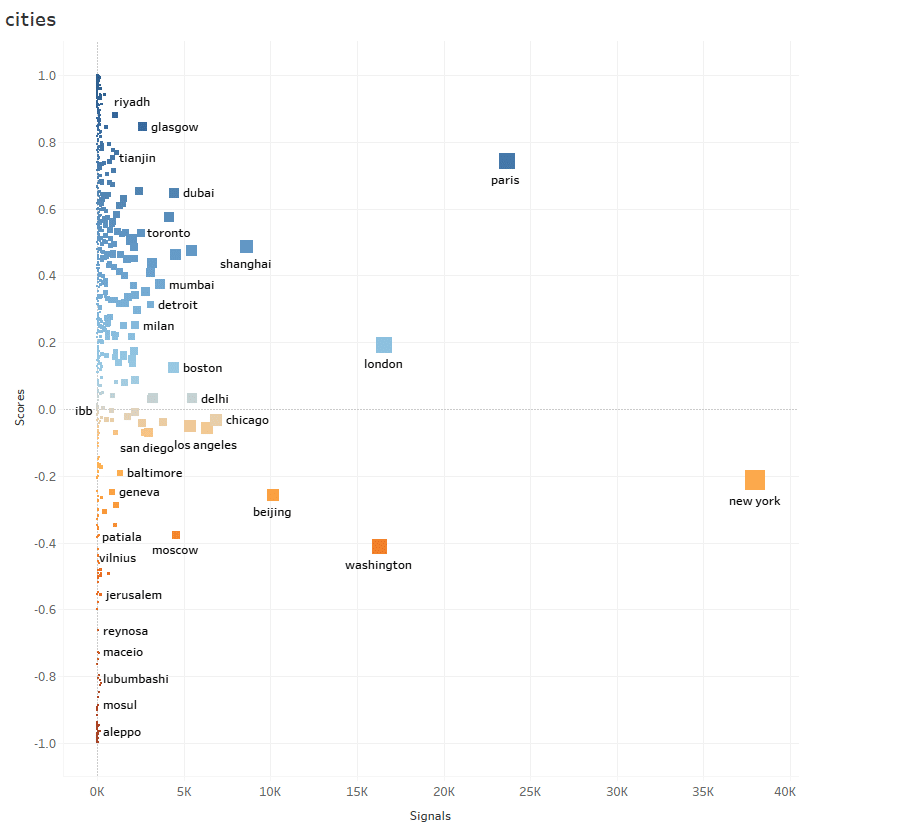
The chart above shows ESG scores for each major city. Vertical axis represents the ESG scores, horizontal axis represents number of data points.
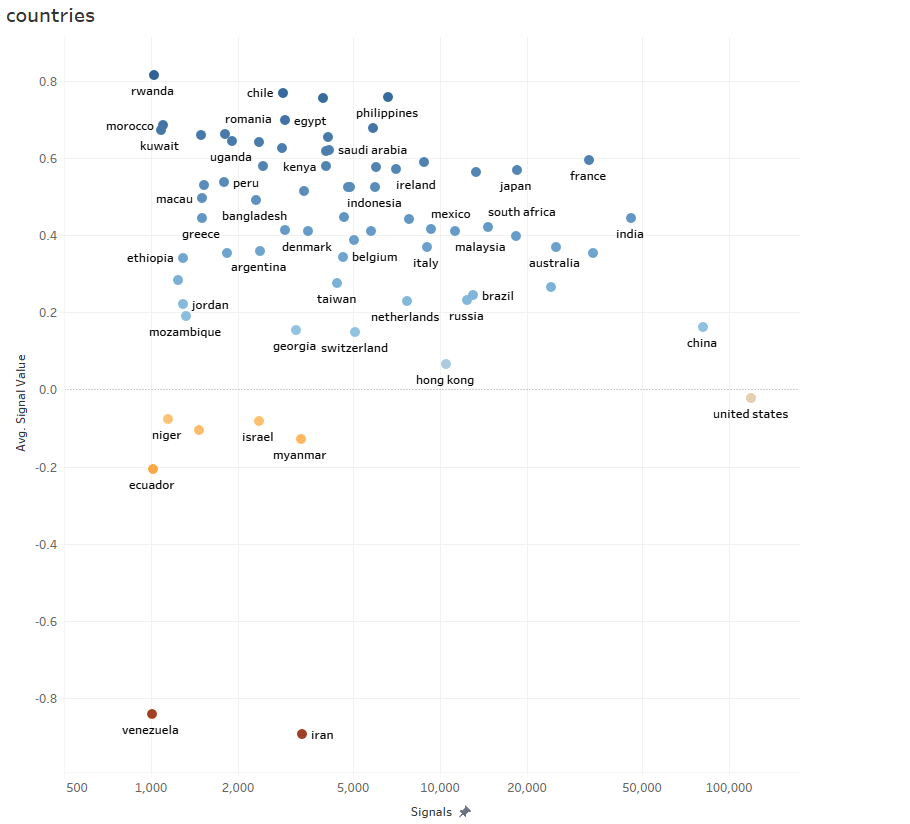
The chart above shows ESG scores for each major country. Vertical axis represents the ESG scores, horizontal axis represents number of data points.
A geographic view of ESG analytics can reveal important nuances that businesses in all sectors can use to navigate regional variations in their business activities. With this mapping and location data, clients can move from global generalisations to using geographic ESG analytics to identity spatial trends and issues. This in turn will help to visualise and contextualise areas of concern across global markets and reflect and act on regional and national differences that businesses must capitalize on to compete and report back to their shareholders with complete confidence and attain a competitive advantage.
The above two ESG maps, show the composition of ESG topics most pertinent to the respective city. Colours represent the ESG score and size indicates the number of data points.
To organise a trial of Permutable’s geo location functionality or to talk to us more about how we can help you with your ESG analytics please request a demo below.
We use cookies to ensure that we give you the best experience on our website. If you continue to use this site we will assume that you are happy with it.