In this article we examine how US sanctions on Iran have moved Brent crude prices, using our point-in-time sentiment indices. Between February and August 2026 the premium moved off the possibility of lost barrels and onto the price of finding somewhere to put them. Permutable’s geopolitical sentiment indices caught the handover.
Washington called it the harshest economic campaign ever mounted against an adversary. Brent fell anyway, settling at $89.40 on 25 August, 4.7% below where it sat on 20 August. The announcement named no countries and set no dates.
Our energy market sentiment indices had the shape of it first. They score the global information flow around Brent into separate sentiment themes, so the question is never how much Iran is in the news, but which part of the Iran story the market is being asked to price. Global Trade & Sanctions turned bullish into the escalation, while Geopolitics & Conflict and Physical Supply went the other way and outweighed it.
Iran risk is rotating back towards sanctions
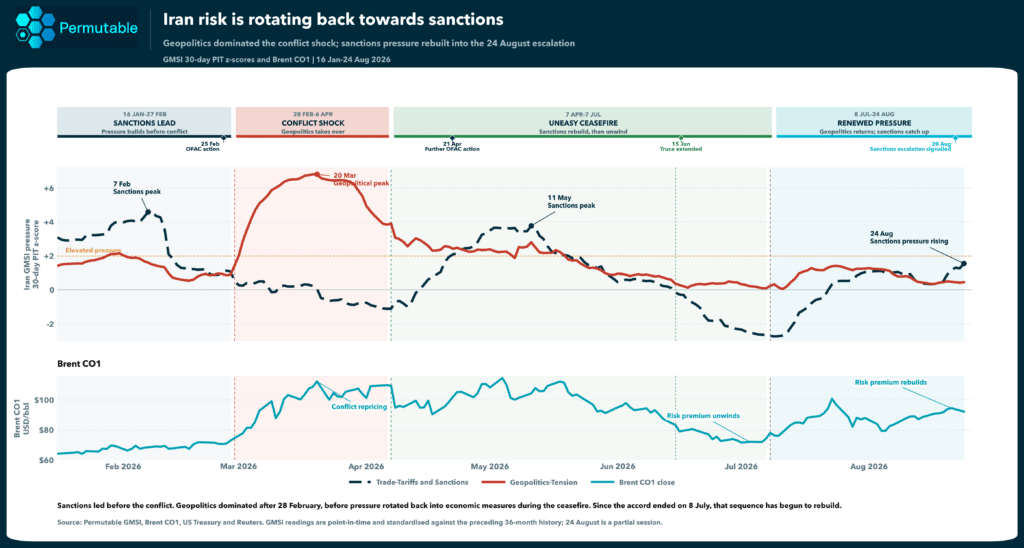
Iran GMSI pressure, 30-day point-in-time z-scores, against Brent CO1 | January to August 2026
The chart runs two macro directional Iran sentiment themes from the Global Macro Sentiment Indices against the CO1 close, standardised on the preceding 36 months. Positive is bullish for Brent, negative bearish, and each value carries only what was known on the day.
A sanctions listing counts for Brent only when it raises the odds that a cargo stops being lifted. Most do something smaller: they move the barrel to a different buyer at a worse price.
Trade-Tariffs and Sanctions moved first, reaching +4.6z on 7 February, three weeks before open conflict and following the 25 February OFAC action. Geopolitics-Tension took over, peaking at +6.8z on 20 March as Brent approached $110. The spring bid sat on that one theme, which is why it drained once the shooting stopped.
The 7 April ceasefire reversed the balance without flushing out the pressure. Sanctions rebuilt to +3.8z by 11 May. Both themes eased after the 15 June truce extension, then turned up again once the accord ended on 8 July.
By 24 August, Trade-Tariffs and Sanctions had risen to while Geopolitics-Tension kept sliding. The Brent panel beneath says the same thing in price: the premium that unwound through late June has rebuilt, and it has rebuilt on the economic leg.
The change since March is one of channel rather than intensity. Pressure now travels through Iran’s access to buyers, banks and shipping, rather than through an immediate threat to production or to passage through Hormuz. That matters for how long it lasts. A ceasefire can strip an escalation premium out inside a week, while a sanctions premium takes weeks to draft and months to unwind.
Markets are pricing trade enforcement, not an immediate supply shock
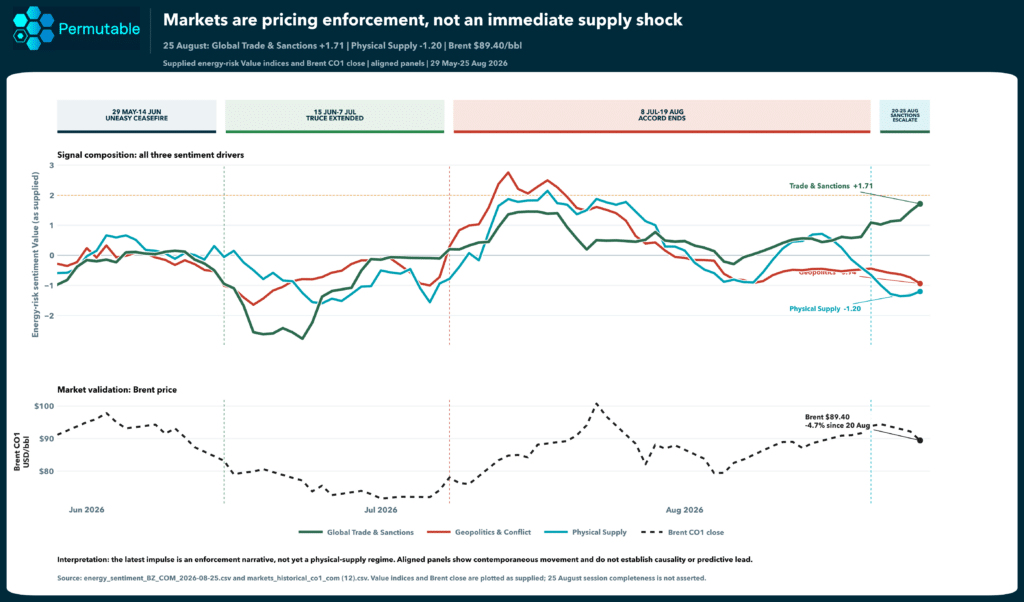
Energy-risk value indices and Brent CO1 close, aligned panels | 29 May to 25 August 2026
Between early July and early August the three drivers rose together. Brent moved from about $72 to a peak near $101 as the market rebuilt a broad Iran risk premium, with no single theme doing the pulling.
Since the 20 August escalation they have separated. Global Trade & Sanctions is at +1.71, Geopolitics & Conflict at −0.94, Physical Supply at −1.20. This is the first time since July’s repricing began that sanctions pressure has risen while the geopolitical and supply signals have fallen. The panels move contemporaneously and are not presented as evidence of a predictive lead.
A bid held up by one driver is easier to walk away from than one held up by three.
Two workings at play sit behind the recent pullback.
The near-term outlook for Hormuz has improved on the corridor framework, not on the traffic. Iran and Oman have set out a temporary joint corridor and a de-mining programme, and with no secondary sanctions in force the risk of a material interruption to Iranian flows has receded. Transits themselves remain depressed, down to a handful of commodity vessels a day against a ten-day average nearer fifteen, with a slice of what remains running dark. The market is pricing the framework rather than the tape.
Emergency releases have provided a second cushion, and it is thinning. US strategic reserves stand at 289.7mn barrels, the lowest since 1982 and around 41% of authorised capacity, so the stock draw that absorbed the spring shock is a weaker option now.
Our view is that the market is right to look past the traffic numbers while the corridor talks hold, and wrong from the moment a round fails. On the evidence to date it is pricing greater friction around trade, not an imminent shortage of crude.
China takes the large majority of Iranian crude and receives around two-thirds of everything leaving Hormuz. Independent refiners handle most of that barrel and roughly a quarter of Chinese refining capacity, which makes them the constituency a serious campaign has to reach. Nothing announced so far reaches them.
Estimated Chinese imports have fallen to roughly 0.53mn barrels/day in August from 1.57mn in February. Handle that with care, because a fall in observed volume looks identical to a fall in observable volume. Relabelled cargoes, ship-to-ship transfers and dark tonnage all remove barrels from the data without removing them from the market. Iran has also met tighter restrictions with steeper discounts, and a discount is a reason for an independent refiner to lift more.
Two readings fit. If Chinese buyers have stepped back, barrels are leaving the balance and supply pressure should build within weeks. If they have gone dark at a wider discount, nothing has left the market and the sanctions leg is a toll on the trade rather than a constraint on it.
Energy-inflation pressure and Brent across the Iran risk cycle
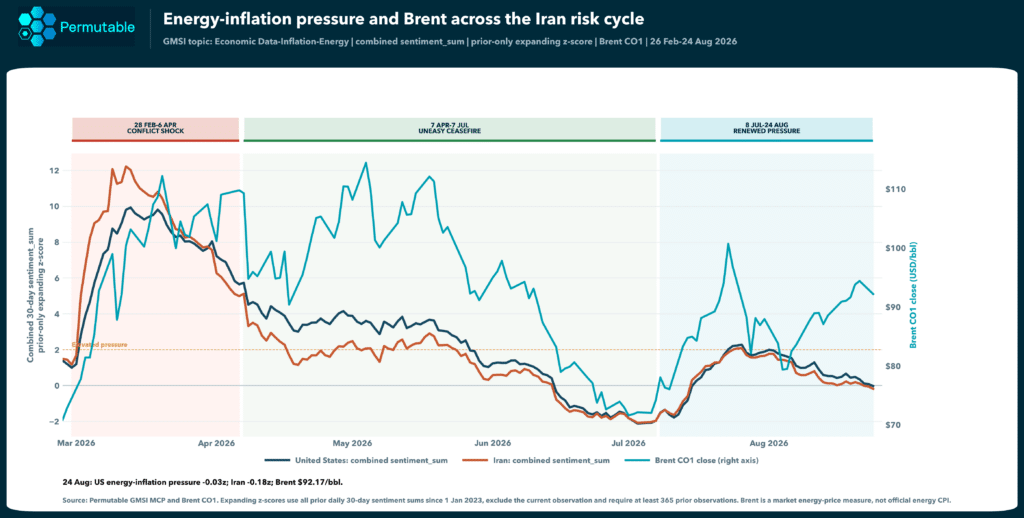
GMSI energy-inflation sentiment, prior-only expanding z-score, against Brent CO1 | February to August 2026
In March, US energy-inflation pressure reached +9.8z and Iran’s +12z as Brent approached $110. July’s rally lifted both back to about +2.2z, but by 24 August they had fallen to −0.03z and −0.18z with Brent at $92.17, and the price has eased further since.
Rates face less pressure than in March. The latest measures have not produced a sustained move in bond durations. What has gone is the marginal push, which is the part that moves expectations. The level effect of Brent well above where it started the year has not reversed with sentiment.
FX exposure remains exposure dependent. Higher crude weigh’s on India’s terms of trade, while Turkey, Pakistan and Egypt have less room to absorb imported energy costs. Those risks would build if Brent and Physical Supply turned higher together.
Secondary measures would need to name their targets. Chinese independent refiners, settlement banks or insurers, with dates attached, would change purchasing decisions instead of shipping arrangements. We are sceptical it goes that far. Penalties on major buyers carry costs Washington has flinched from before, and Mr Trump’s habit of announcing more than he imposes is now priced in as an assumption.
The physical market would then have to confirm it, through falling Iranian exports, a narrowing discount on Iranian crude, tighter freight, backwardation, or crack spreads that stop behaving. Those move on behaviour rather than on reporting volume, which is what makes them the test that settles the China question.
Energy-inflation pressure would have to rebuild last, carrying into rates, currencies and policy expectations.
Until then, sanctions are changing the routes and costs attached to Iranian oil more than the amount of crude available. A cargo can be entirely available and still short of a home.
Iran risk has moved back towards economic coercion.
Oil pressure has split: Global Trade & Sanctions is rising while Geopolitics & Conflict and Physical Supply fall.
Macro transmission remains weak, with energy-inflation pressure close to zero and Brent moving lower as central banks see through some what perodic high energy prices.
The value of using the GMSI and the asset indices is in showing where the underlying pressure sits, the hand over of driver and whether it is reaching supply or inflation.
A Brent move built on Trade & Sanctions does not last like one built on lost production or a blocked route. Trade & Sanctions reprices counterparties and differentials. Physical Supply reprices availability, and availability is the one that reaches breakevens, currencies and policy expectations with any reliability.
Permutable’s Energy Indices pull those drivers apart inside the Brent information flow, while GMSI carries the same structure across 95+ economies and 70+ macro topics. Both datasets hold 11+ years of point-in-time history and reach you through API or Excel, as well as an accessible developer platform, for use alongside discretionary or systematic research.

Analysis
16 Oct 2026
Gold outlook 2026: Why US rates outweigh geopolitical risk
Read more >
Guide
14 Aug 2026
Measuring narrative momentum across global markets: A guide for institutional investors
Read more >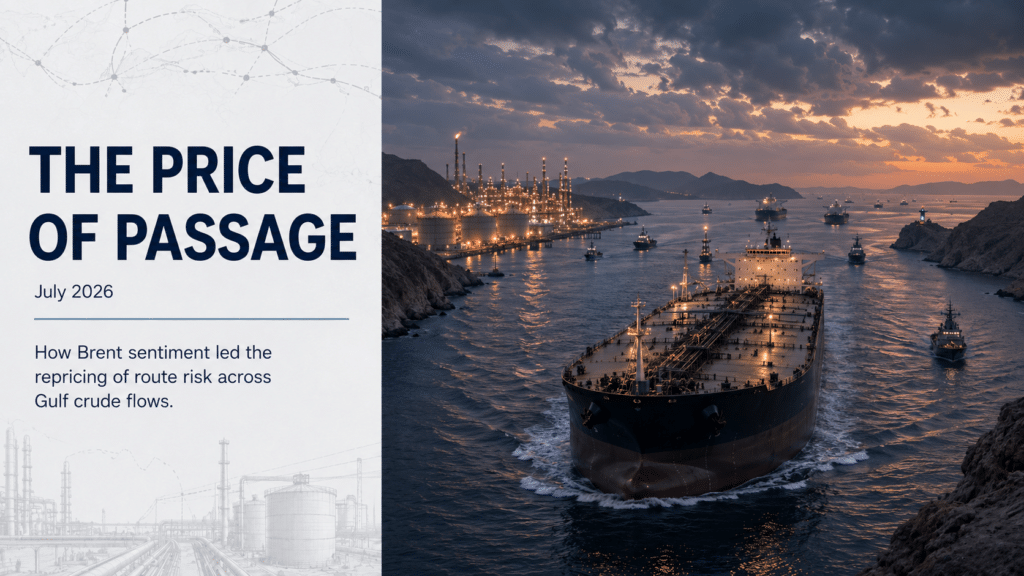
Analysis
15 Jul 2026
The Price of Passage: How Geopolitical Sentiment Led the Repricing of Gulf Crude-Flow Risk
Read more >