How to use event data in trading
13 May 2026
13 May 2026
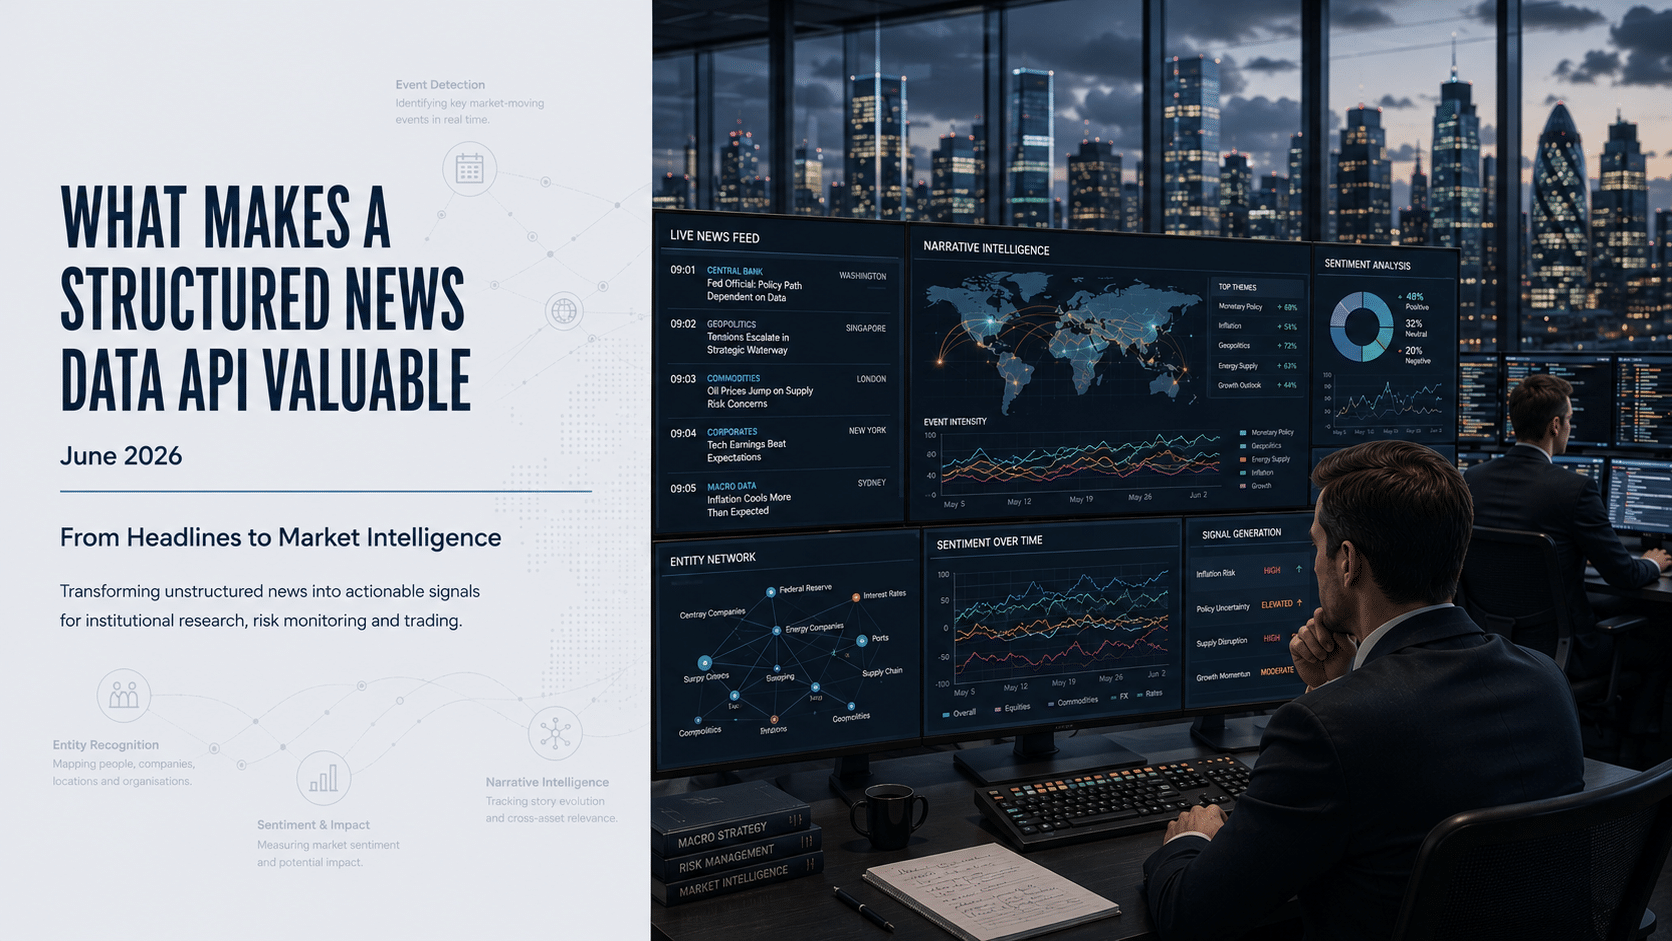
This article explores how institutional investors, macro traders, researchers and risk teams can use structured event data to detect market-moving developments earlier, interpret narrative shifts across macro and commodities markets, and turn fragmented news flow into actionable market and research signals. It examines how event data, contextual AI and narrative intelligence are reshaping institutional workflows as markets increasingly react to information flow before traditional datasets fully adjust.
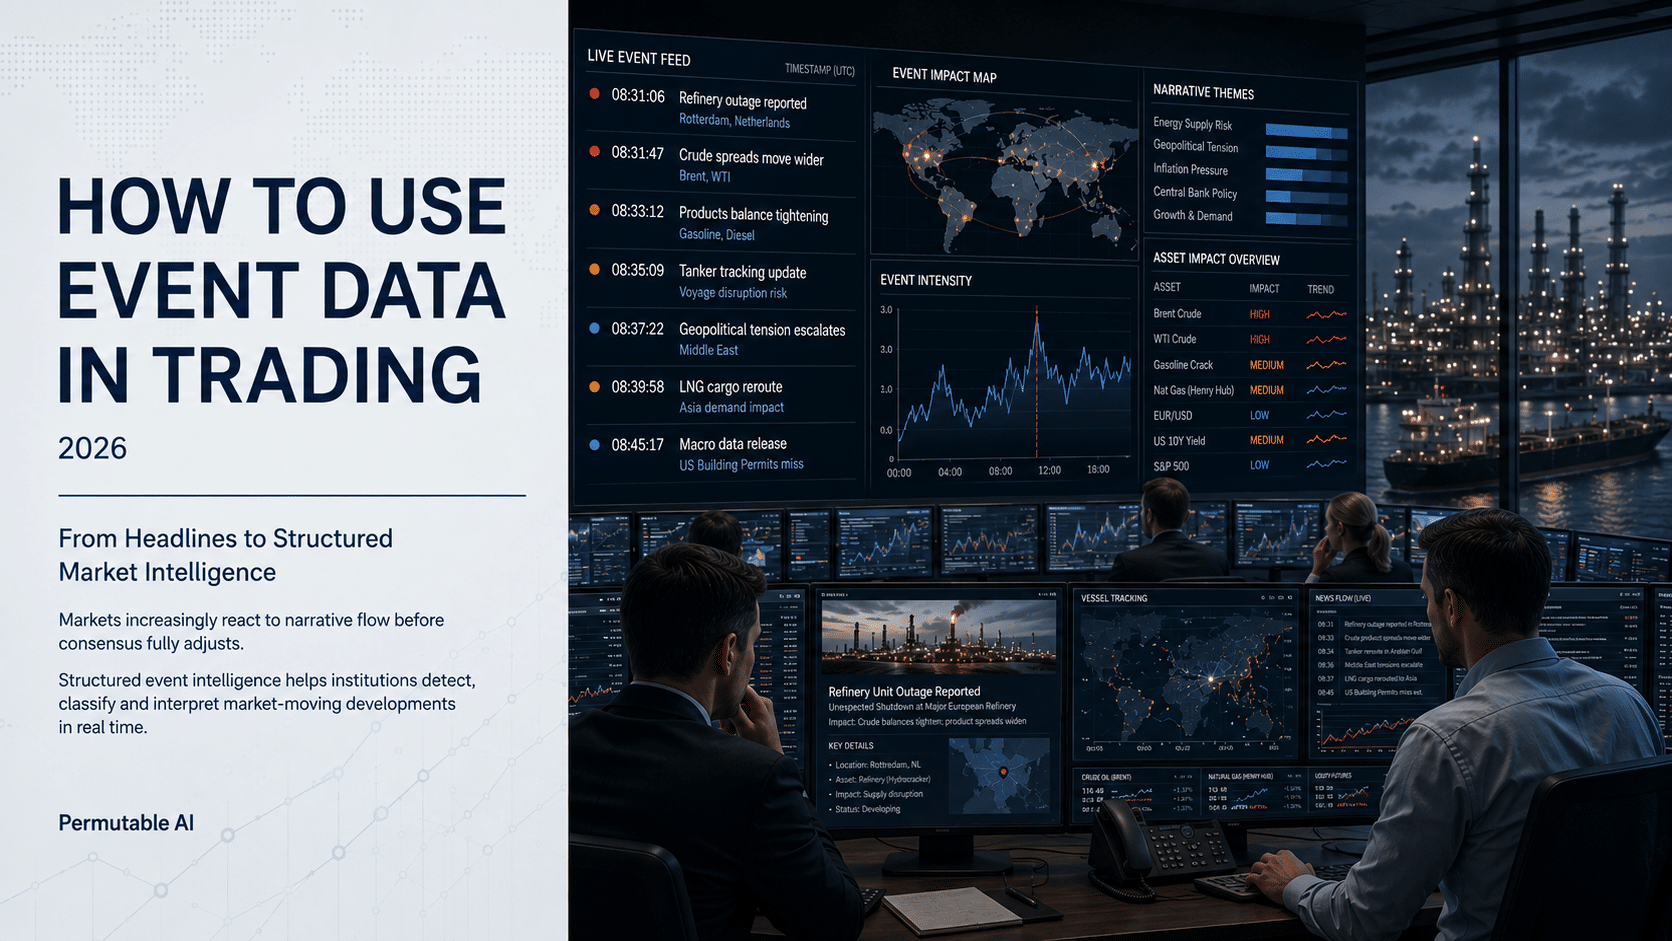
At 08:31, a refinery outage hits the tape. By 08:33, crude spreads move. By 08:45, half the market is still reading headlines rather than pricing the second-order effects. That gap is where structured event data matters. If you are asking how to use event data, the real question is not whether news matters, but how to convert narrative flow into something fast enough for trading, clean enough for research and transparent enough for risk.
For institutional desks, event data is not a media monitoring exercise. It is a machine-consumable layer that detects, classifies and timestamps market-relevant developments across macro, commodities, FX and sector narratives. Used properly, it helps teams separate noise from price-forming information, measure narrative persistence and react before consensus estimates fully adjust.
Most discretionary and systematic teams already know that markets react to events. The challenge is that raw headlines are messy. The same development can appear in multiple sources, be described with different language and evolve over several hours or days. If you feed that directly into research or execution logic, you create latency, duplication and false positives.
The right starting point is to treat event data as structured market intelligence rather than text. That means working with normalised entities, event types, geographies, sectors, timestamps, sentiment and relevance scores. An OPEC production cut, a US payroll surprise and a pipeline disruption are not just articles. They are discrete events with attributes that can be filtered, compared and tested.
That difference matters because price does not respond evenly to all information. Some events are instantly market moving. Others matter only when they reinforce an existing theme. A hawkish central bank comment during a benign inflation regime may fade quickly. The same comment during a repricing cycle may extend a rates move across FX, equities and front-end vol. Event data becomes valuable when it captures context as well as occurrence.
A common mistake is to ingest event data first and ask what to do with it later. On a trading desk, that usually leads to dashboards with little decision value. The better approach is to define the workflow you are trying to improve.
For discretionary macro teams, the use case may be earlier identification of narrative shifts. If inflation language is accelerating across central bank speakers, labour releases and energy price commentary, the desk wants confirmation that the theme is broadening rather than relying on one memorable headline.
For systematic researchers, the use case may be signal construction. They need event features that can be backtested against price response by asset, time horizon and regime. That often means analysing not just event frequency, but surprise, intensity, persistence and cross-asset spillover.
For risk teams, the use case is different again. They may want live monitoring of event clusters that can destabilise a book – sanctions, shipping disruptions, weather shocks, supply outages or election risk. In that setting, event data is less about alpha entry and more about scenario awareness and exposure control.
When the use case is clear, the data model becomes easier to evaluate. You can ask practical questions. Is the taxonomy aligned with how the desk thinks about markets? Are timestamps precise enough for intraday analysis? Can events be mapped to instruments, sectors or countries? Is the signal explainable enough to justify position changes in front of an investment committee?
Using event data effectively usually involves three layers: detection, interpretation and action. The first layer is identifying that something happened. The second is assessing whether it matters. The third is linking it to a decision rule.
Detection sounds simple, but quality varies sharply. Good event data should consolidate fragmented reporting into a coherent signal and reduce repetition. It should also distinguish between primary developments and commentary around them. A surprise draw in crude inventories is an event. Ten subsequent articles repeating the number are distribution, not ten separate signals.
Interpretation is where many teams build edge. The same event can have different implications depending on positioning, macro regime and time horizon. A weaker-than-expected CPI print may support risk assets broadly, but if the market was already heavily long duration the move can be less straightforward. Event data helps when it is combined with market state variables such as realised volatility, implied pricing and cross-asset correlation.
Action requires discipline. Not every event should trigger a trade. Some should simply update conviction, tighten risk limits or prompt deeper analyst review. The desks that use event data well are usually explicit about thresholds. They define what counts as a meaningful event, how many confirming observations are required and what conditions invalidate the signal.
In macro and commodities, event data is especially useful because causal chains are rarely linear. A drought report can affect crop expectations, freight assumptions, food inflation and policy sensitivity. A geopolitical flashpoint can move crude first, then inflation breakevens, then FX pairs linked to energy terms of trade.
That means event data should not sit in a silo. It should feed into the same process that tracks supply, demand, policy and positioning. A petrol trader, for example, may combine storage data, weather revisions and LNG outage events to assess front-month convexity. A macro PM may blend central bank event intensity with labour market deterioration signals to refine recession timing. The value comes from stitching narrative developments into the broader market framework.
There is also a difference between point events and event sequences. A single refinery outage may matter less than a cluster of outages across a region. One hawkish speech may be noise. A coordinated run of hawkish language across policymakers, inflation commentary and wage data is a regime signal. Event data becomes more informative when analysed as accumulation rather than isolated incidents.
Before event data is used in production, it should be tested like any other institutional input. Start with event-to-price mapping. Which event categories have consistent explanatory power for the assets you care about? Over what horizon – minutes, hours, days or weeks? Does the signal decay quickly, or does it carry information about trend persistence?
Then test by regime. A data series that works in calm conditions may fail during crisis periods when correlations jump and liquidity fragments. Likewise, an event signal that is useful in commodities may not transfer cleanly into G10 FX without additional filtering. The aim is not to prove that event data always predicts price. It is to identify where it improves decision quality enough to justify operational use.
False positives deserve particular attention. News volume can spike around themes that sound important but have little marginal impact because they are already priced. Recycled geopolitical rhetoric is a classic example. So are heavily anticipated policy events with limited surprise. If your framework cannot distinguish novelty from repetition, it will overtrade noise.
Explainability also matters. Institutional adoption is much easier when a signal can be decomposed into understandable drivers: event type, affected entity, sentiment direction, relevance weighting and observed market response. Black-box outputs may look attractive in a backtest, but they are harder to defend when markets behave unexpectedly.
A good event signal that arrives too late, cannot be queried properly or does not fit the desk’s workflow is of limited value. That is why integration is not an afterthought. Event data should be accessible through APIs, analytics layers and interfaces that allow researchers, traders and strategists to work from the same underlying structure.
For some teams, that means direct use inside systematic pipelines. For others, it means live alerting tied to portfolios, watchlists or specific geographies. In both cases, speed and consistency are critical. If the data arrives quickly but classification is unstable, trust erodes. If classification is clean but latency is high, the alpha window narrows.
At Permutable, we provide institutional-grade event intelligence designed to help trading desks, researchers and risk teams monitor how narratives evolve across global markets in real time. Our infrastructure transforms fragmented news flow, geopolitical developments, commodities disruptions and macroeconomic signals into structured, machine-readable event data that can be analysed, queried and integrated into trading workflows.
Rather than simply aggregating headlines, our system classifies and contextualises market-moving developments across sectors, geographies and asset classes, helping firms identify narrative acceleration, cross-market spillover and emerging systemic risks faster. Our platform is designed to support both discretionary and systematic workflows, enabling institutions to move from reactive headline monitoring toward more structured, explainable and real-time market intelligence.
Data and signals can be delivered through API, live feeds, Excel, alerts, analytics layers and custom integrations, allowing teams to embed event intelligence directly into research, trading and risk management workflows.
There is a temptation to treat more event data as automatically better. It is not. Broader coverage increases the chance of finding useful information, but it also increases noise, model complexity and operational burden. The better approach is selective depth. Focus on the events that genuinely move the instruments you trade, then expand only when testing shows incremental value.
The strongest event-driven processes are usually the least theatrical. They do not promise clairvoyance. They create a repeatable way to detect inflection points earlier, quantify narrative change and respond with more discipline than a manual headline workflow allows.
If you want to know how to use event data well, start by asking a harder question: which decisions on your desk would improve if narrative risk were measured with the same rigour as price, volatility and fundamentals? That is usually where the edge begins.