In this article, we look at silver’s early December breakout and what truly carried prices to fresh highs, with the silver market outlook 2026 firmly in view. A softer dollar and easing rate expectations helped light the fuse, but the more revealing story sat in the market’s plumbing. Deliverability, margin discipline and a rapid repricing of risk set the pace, while lease rates and physical tightness did much of the heavy lifting behind the scenes.
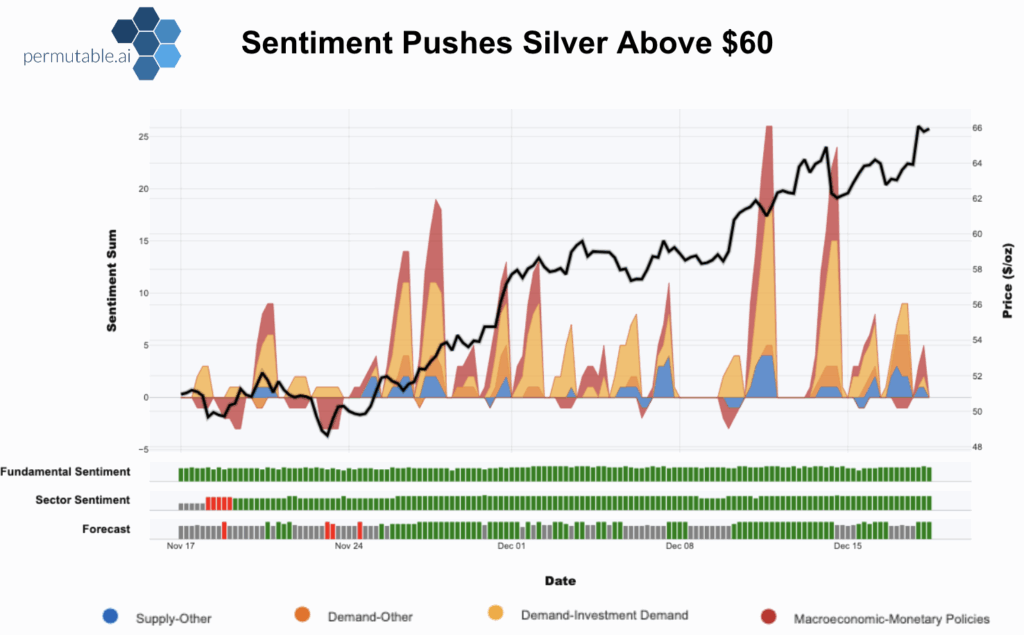
Through late autumn, silver mostly traded as higher beta gold. Same direction, bigger swings. The break above $60 changed that framing. Spot jumped more than 4% to $60.74 on 9 December, then pressed towards $66 by 17 December. Year to date gains moved into triple digits, north of 110%, alongside a run of record intraday highs.
What shifted was not only the price, but the crowd around it. Sentiment built into late November across macro, supply and demand narratives. Price action had been choppy, then the tone turned decisively constructive in recent weeks. Fundamental and sector sentiment held a consistent bullish bias, and price followed, accelerating as conviction tightened around the themes that pushed the market through $60 and into the mid-$60s.
Macro tailwinds: A softer dollar and easing rate expectations lowered the hurdle for holding metals and pulled capital back into the precious metals complex.
Demand- led investment flows: Repeated surges in investment demand created a self-reinforcing bid, where a supportive backdrop attracted positioning, and positioning reinforced the move.
Microstructure and physical constraints: Sharp sentiment spikes aligned with a market increasingly priced on deliverability and risk controls, where access and margin constraints mattered as much as direction.
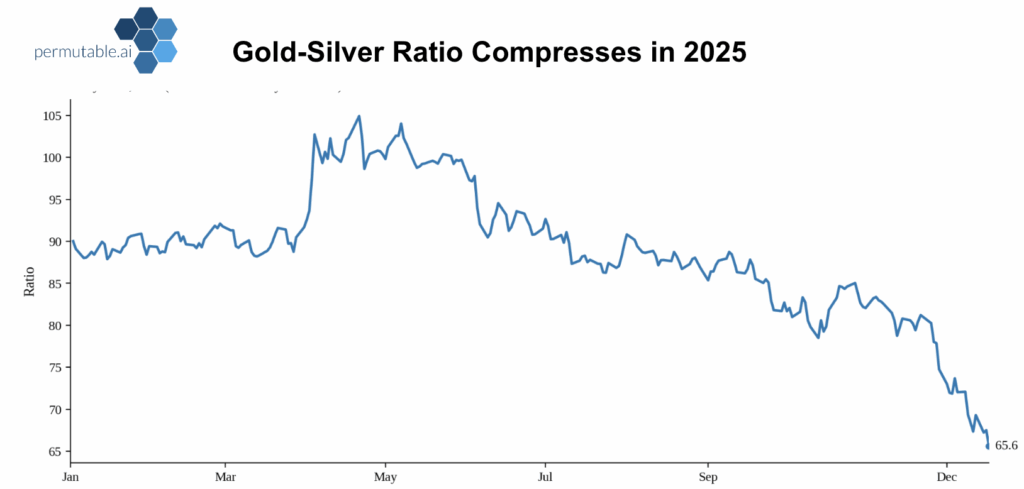
For much of the year, silver played second fiddle to gold. The break above $60 ended that relationship and marked a shift from range-bound trading to clear directional conviction. One useful measure of that change: the gold-to-silver ratio, which compressed materially through the year, falling back toward levels last seen earlier in the cycle after peaking above 100.
The ratio rose into April-May as gold outperformed, then trended steadily lower through the second half of 2025. By mid-December it had fallen to the mid-60s, signaling a sharp late-year phase of silver outperformance. Silver stopped being in the passenger seat and started steering the wheel.
December was the point where the macro backdrop stopped being background noise and started carrying the trade. The setup did not manufacture the rally, it loosened the risk brakes and gave traders room to press on.
The Federal Reserve’s quarter-point cut on 10 December lowered the opportunity cost of holding bullion and pressured the dollar. The baseline support eases and flows into precious metals to get breathing room. The labour data then tightened the narrative.
US unemployment rising to 4.6% in November was not a recession signal, but it was enough to shift probabilities. It nudged markets towards a gentler policy regime, kept the dollar under pressure, and revived the appeal of hedges. A dollar index hovering near a two month low mattered because it improved the economics of dollar priced metal for non US buyers and reinforced the perception that the macro tide was turning, a key ingredient for the silver market outlook 2026.
Silver’s outperformance versus gold also mattered, because a falling gold silver ratio became a visible signal of leadership, and leadership tends to attract incremental allocation.
With macro conditions supportive, flows dictated the next leg. Silver-backed ETFs added about 590 tonnes in a short window, lifting total known holdings to roughly 845 million ounces by 10 December. In a market where annual mine supply runs around 800 million ounces, that matters. It tightens the balance and can turn a rally into a squeeze.
In tight markets, the dynamic becomes reflexive. Inflows lift prices, higher prices draw more participation, and pullbacks become harder to sustain. Options markets tell a similar story. Upside interest has strengthened, protection has become more dear, and positioning looks increasingly crowded, consistent with a market being squeezed whilst still paying up for immediacy.
Short-term price action can be volatile, but it rests on an industrial foundation that’s increasingly difficult to dismiss. Solar remains one of the strongest pillars, with photovoltaics accounting for roughly 30% of industrial silver demand today, up from about 10% a decade ago. Installed solar capacity has grown more than tenfold, yet solar-related silver demand has only tripled, reflecting efficiency gains rather than declining end use. The growth rate in installations is expected to moderate as China’s build cycle matures, but the floor remains intact.
Additionally, green tech and electrification continue adding layers of durable demand. EV production rose from about 3% of global light vehicle output in 2019 to around 20% in 2024, with EVs using materially more silver than combustion vehicles. The buildout of data centers also continues lifting demand for power infrastructure and high-conductivity components, with global capacity rising from roughly 1GW at the turn of the century to around 50GW today.
On the supply side, the constraint is time. The market is running a fifth consecutive year of deficit, with the 2025 shortfall projected around 117 million ounces. Around 70% of silver output comes as a byproduct of copper, lead, and zinc mining, which limits the speed of any price-led response. Even at high prices, mined output tends to drift rather than surge, constrained by declining ore grades and a thin pipeline of new projects. This slow supply response remains a defining factor heading into 2026.
The mid-month pullback was largely mechanical. Exchanges raised the cost of carrying risk.
Shanghai widened the daily price limit to 15% for its February 2026 silver contract and lifted margins to 16-17%, effective 12 December. COMEX raised initial margins from $20,000 to $22,000 per 5,000-ounce contract. These changes don’t alter supply or demand, but they force traders to post more cash to maintain exposure.
In a crowded rally, that acts like a leverage squeeze. Higher margins prompt deleveraging, and stretched positions cut risk quickly. Silver fell from around $64.64 to roughly $61.70 before steadying. What mattered next was the rebound. By 17 December, futures were back around $66. The market absorbed a higher cost of risk and still held the new range.
The most significant shift in December was the market’s move from trading direction to trading availability. When that happens, the relevant question isn’t only where price clears, but whether physical bullion can actually be sourced.
This year’s tightness carried a geographic signature. Tariff uncertainty and precautionary positioning pulled metal toward the US, and for extended periods COMEX futures traded at a premium to London benchmarks. When that spread persists, it incentivizes movement, drains accessible pools of inventory, and leaves remaining stock more encumbered. London, still the central hub for clearing and custody, felt that pressure most directly.
The effects travelled. As metal was redirected to relieve pressure points, inventories in other hubs tightened too. Chinese exchange warehouse stocks fell to their lowest levels in years, with a surge in exports in late autumn helping rebalance flows. When tariffs and physical shortages become even a plausible risk, the market starts pulling forward logistics, and the tightness becomes self-reinforcing.
That’s why lease rates matter. Widely circulated figures suggested millions of ounces were claimed for delivery in early December. One-month silver lease rates pushed towards 6.70% in mid-December, from typical levels near 1-2%. That’s the market putting a premium on access to metal now, not later.
Deliverability stress tends to amplify volatility. Big tech and industrial giants are now looking to bypass exchanges and go straight to the mines in order to acquire silver as participants want to avoid paying a premium for physical availability. The premium can compress quickly when conditions normalize, but while it persists it embeds a tightness into the front end and reinforces a higher volatility regime.
Policy matters here less as a daily driver and more as a structural long-term force. India’s pension framework now permits exposure to gold and silver ETFs within National Pension System schemes, up to 5% of scheme assets as of 10 December. Allocations will be gradual, but the pool of long-duration holders expands meaningfully.
The US decision to add silver to its list of critical minerals in November also contributes to a reframing of silver’s role in technology and defense supply chains. It encourages investors to see silver not only as a cyclical metal but as a strategic input. When a metal is treated as critical, policy can shift from neutral to interventionist faster than the market expects, and that alone can change inventory behavior.
Silver now trades with two clocks. The slow clock represents long-term support from industrial demand and constrained supply. The fast clock is microstructure, positioning, and deliverability.
Three signposts matter most heading into 2026. The Fed’s path and the dollar, whether deliverability signals persist, and whether the market can keep absorbing higher costs of risk without breaking the new range. A fourth is straightforward. Watch the gold-to-silver ratio. When it compresses, silver isn’t just following, it’s leading precious metal conversation.
Silver looks supported, but the path won’t be smooth. Macro tailwinds remain constructive and industrial demand provides a floor. Yet tighter margin conditions, policy uncertainty, and periodic deliverability stress mean pullbacks will be sharp when they arrive.
The market has moved into a higher volatility equilibrium where direction and access are repriced simultaneously. The practical question isn’t whether silver can trade higher – it’s the path it takes, and how much is driven by macro conditions, flows, or physical availability.
The primary risk sits on the industrial side. A sharper global slowdown, particularly in electronics and manufacturing, would cool momentum and test how much of the bid is truly structural. At elevated price levels, demand destruction isn’t theoretical, it’s the mechanism that ends the most confident narratives.
Whilst the pace of gains seen this year may not be sustainable, overall we expect silver prices to remain well-supported amid resilient industrial demand, constrained supply growth, and a more favourable macro environment.
For clients looking to navigate this regime with more discipline, the edge comes from measuring narrative shifts early and consistently. Our real-time market sentiment signals track the policy, supply-chain and industrial-demand narratives across metals, helping distinguish when a move is being carried by macro, when it’s being carried by flow, and when it begins pricing deliverability stress.
Explore our precious metals market sentiment intelligence and request institutional access to our real-time intelligence feeds and API at enquiries@permutable.ai

01 May 2026
Aluminium and copper outlook 2026: Separating scarcity from demand risk
Read more >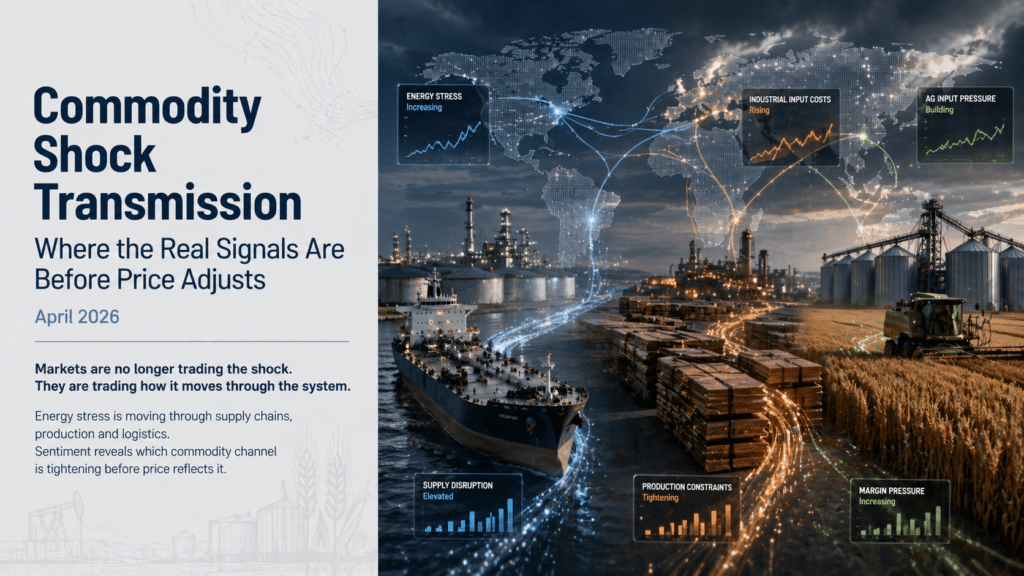
30 Apr 2026
Commodity shock transmission: How real-time sentiment signals reveal market moves before price adjusts
Read more >
30 Apr 2026
Weekly current precious and industrial metals sentiment: Is bullish momentum returning or fragmenting across markets?
Read more >