
The complete guide to early macro regime sentiment signals for hedge funds and institutional investors
30 Sep 2026
30 Sep 2026
This guide explains how institutional investors can identify macro regime shifts before official data confirms them. It covers real-time sentiment, alternative economic data, volatility, correlations, change-point detection and regime-switching models, then shows how to examine how signals may inform institutional research and risk frameworks. It is designed for global macro portfolio managers, quantitative researchers, rates and FX desks, systematic teams, risk professionals and asset allocators. Research use only. This article does not constitute investment advice or a recommendation to undertake any investment activity.
Macro regime shifts do not arrive with a press release. By the time an inflation cycle, policy reversal or rates repricing appears clearly in official data, much of the market adjustment has already taken place. For portfolio managers and quantitative researchers at global macro hedge funds, the real challenge is identifying when the relationship between data, policy language and asset prices has begun to change and whether that change is likely to persist.
This guide walks you through the signals, tools and workflows that help you detect macro regime shifts before official releases confirm them. From real-time sentiment indicators and alternative economic data to statistical detection methods and practical institutional frameworks, you will find everything you need to build a regime-aware research and trading process. Permutable AI delivers structured, source-linked macro sentiment signals that give institutional teams an early read on these transitions across more than 95 economies.
A macro regime shift is a persistent change in the process generating inflation, growth, policy and asset-price behaviour. It is not a single data surprise or one rate decision. It is a structural break in how those variables relate to each other.
Consider the difference between a temporary inflation spike caused by a supply disruption and a sustained shift in wage-setting behaviour, policy tolerance and household expectations that keeps prices elevated for years. The first is noise. The second is a regime change.
James Hamilton’s regime-switching framework treats these breaks as changes in the data-generating process itself, not ordinary fluctuations around a stable trend. For hedge fund portfolio managers and quant researchers, that distinction can effect how teams assess exposure, factor behaviour and risk controls.
If you are running a macro book, a regime shift changes your expected drawdowns, factor performance and the efficiency of your tactical signals. A momentum strategy optimised for a low-volatility trending environment can fail sharply in a high-volatility mean-reverting one. Hedges that worked under one policy cycle may stop working under another.
The cost of late detection is real. Traders who recognised the March 2020 liquidity shock and the 2021–2022 inflation cycle illustrate how a change in regime can alter volatility, correlations and factor behaviour before the shift becomes fully visible in official data. The same pattern repeated during the 2021 to 2022 inflation and rate normalisation cycle, where early recognition of a persistent CPI regime enabled timely factor rotation away from long-duration growth.
For macro strategy and rates desks, the edge lies in the lag between a narrative forming and official data confirming it. That window is precisely where real-time sentiment data and alternative signals earn their value.
Effective regime detection relies on monitoring orthogonal signal types so you capture different dimensions of change. No single indicator is sufficient. You need a dashboard that combines price-based, volatility-based, cross-asset and macro-narrative signals.
Realised volatility, implied volatility and the volatility of volatility are your first line of detection. A sharp rise in 21-day realised vol on a benchmark index, combined with an implied-vol spike above historical percentiles, often signals a regime transition forming.
Professionals focus not only on the level of volatility but on how fast it is changing. The ratio of current volatility to a 20-day average can flag instability before a full regime break is visible in price action.
In stable regimes, pairwise correlations across asset classes remain consistent and diversification works. In unstable regimes, correlations break apart. Average pairwise correlation rising toward 0.6 or higher across an equity basket often signals systemic risk building.
Widening bid-ask spreads and declining market depth add confirmation. When liquidity withdraws, execution strategies lose effectiveness, and the operational environment changes even before price trends reverse.
Before a regime shift, you often see weaker trend continuation, faster pullbacks, failed breakouts and shorter trend durations. Monitoring return autocorrelation, moving-average slope reduction and breakout failure rates helps quantify this momentum decay.
When momentum weakens at the same time volatility rises, the probability of a regime change forming is materially higher than when either signal appears in isolation.
Official economic data (CPI, GDP, unemployment) arrives monthly or quarterly, often with revision lags of weeks to months. Macro sentiment signals fill the gap by tracking how inflation, growth and policy narratives develop across news sources, central-bank commentary and local reporting in real time.
At Permutable, our Global Macro Sentiment Indices convert this information flow into structured, hourly, point-in-time signals across countries and macro topics. The indices separate domestic reporting from international perception, allowing you to identify when local conditions and external market narratives begin to diverge, a pattern that often precedes currency, rates or sovereign-risk repricing.
Traditional macroeconomic data remains central to investment research, but it is inherently delayed. Markets frequently reprice expectations before official releases are published. Alternative data fills the information gap by drawing on sources that move faster than government statistics.
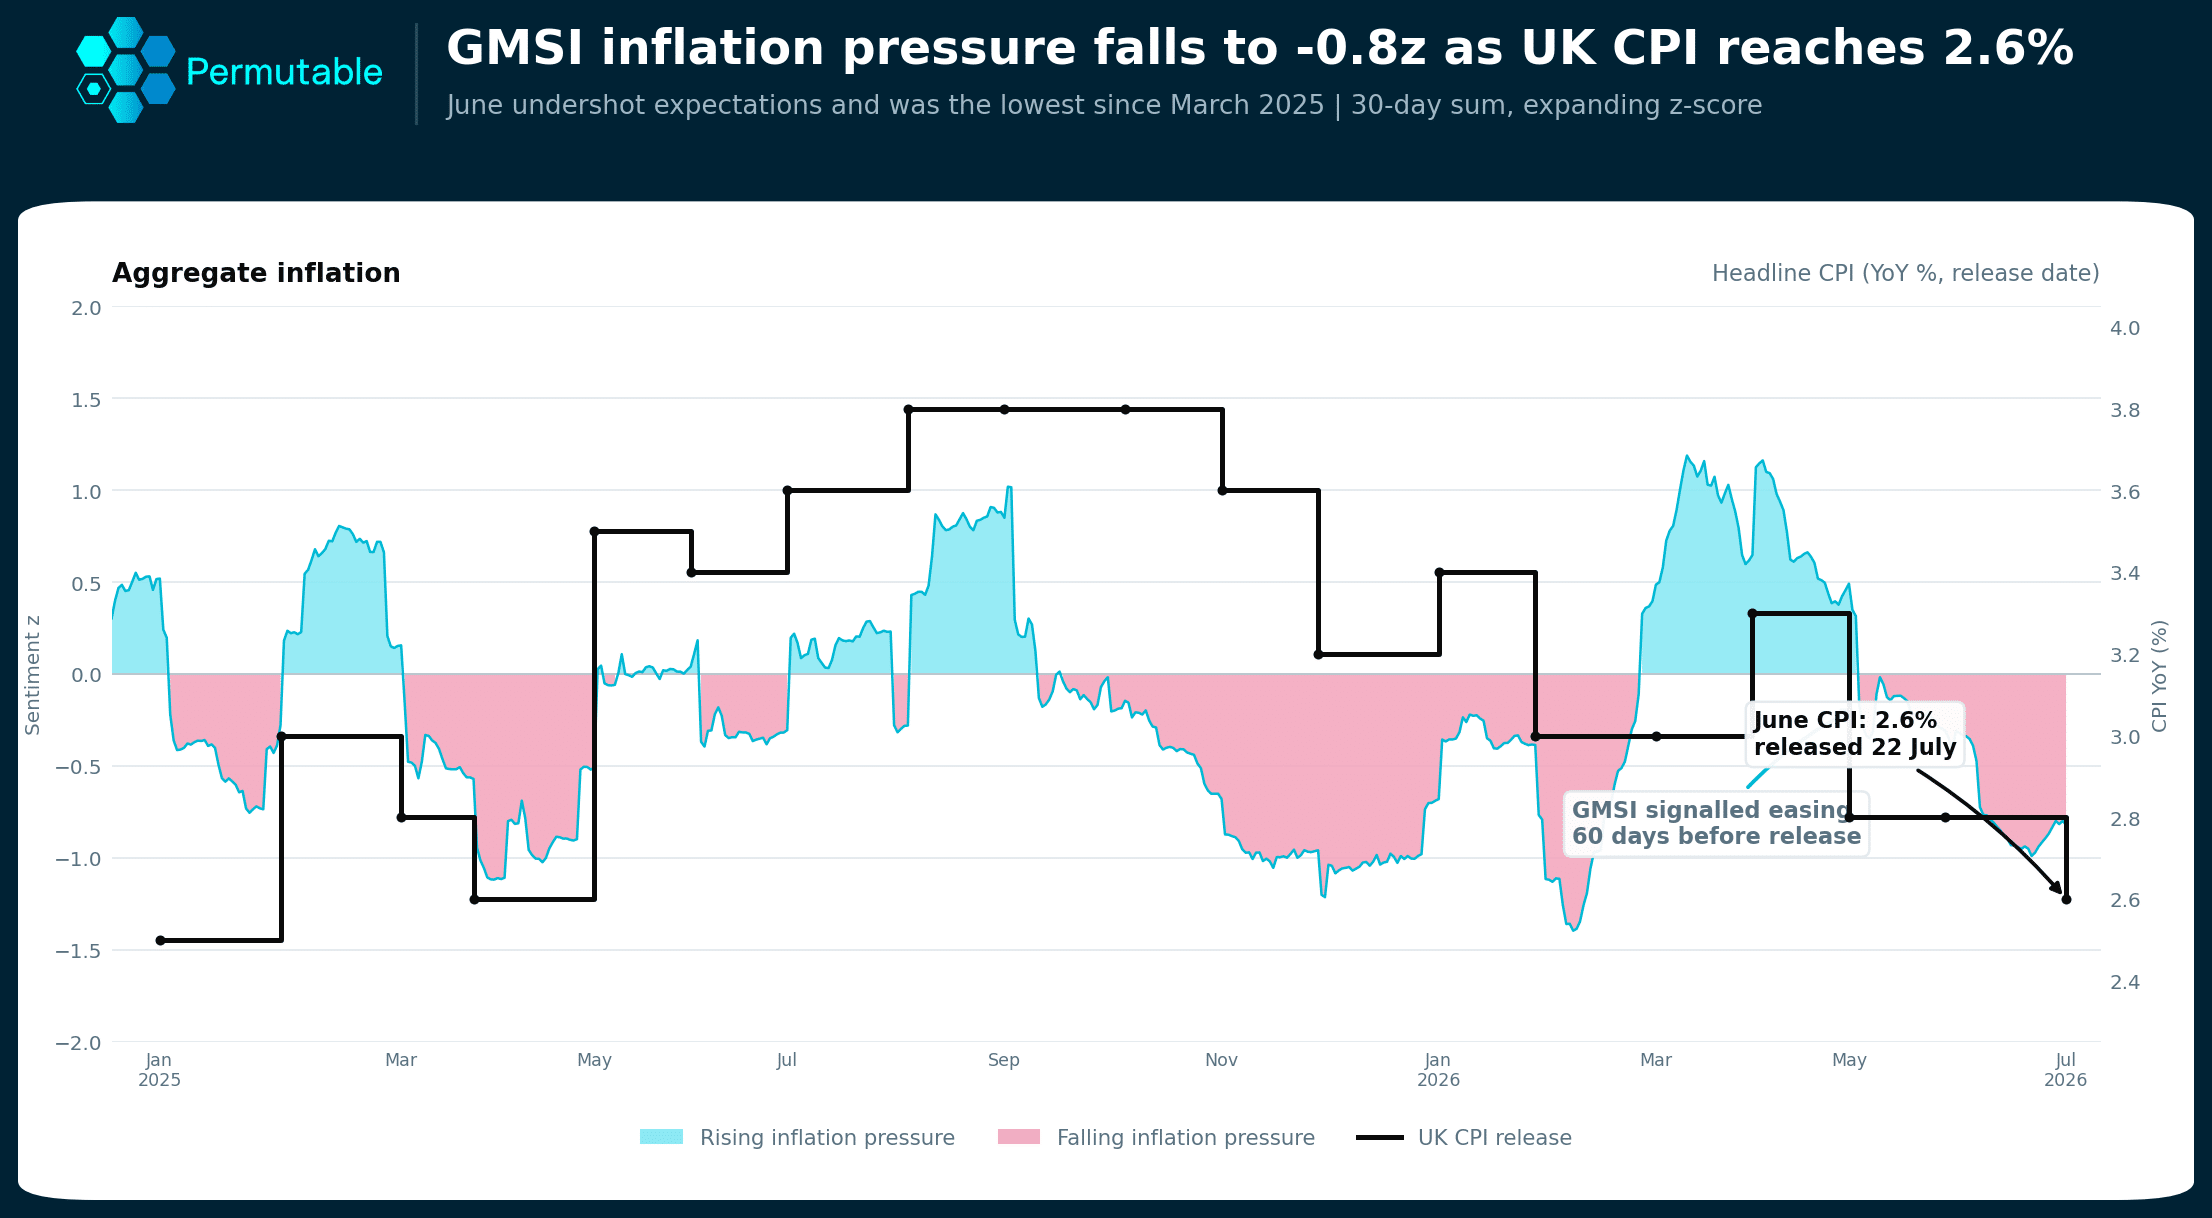
Above: UK inflation pressure versus CPI – Permutable’s point-in-time UK inflation-pressure signal turned lower before the decline appeared in annual CPI, illustrating the window between a changing narrative and confirmation in official data.
Changes in inflation expectations, for instance, may first appear through local reporting on wages, food prices and transport costs, or through central-bank commentary and political pressure linked to cost-of-living concerns. Labour-market weakness or fiscal stress can similarly emerge in local reporting before it becomes visible in official statistics.
A 2025 ECB working paper found that newspaper-based sentiment indicators contain timely economic information that can materially improve euro-area GDP nowcasts, confirming what institutional teams have observed in practice: narrative data moves ahead of the data it describes. (ECB Working Paper No. 3122)
One of the most differentiated signals in alternative macro data is the gap between domestic and international narrative coverage. Domestic sentiment captures local-language reporting and on-the-ground economic discussion. International sentiment reflects how a country is perceived externally through institutional media and global macro commentary.
The two can diverge materially. When local reporting on an economy remains constructive but international coverage turns negative, or the reverse, a repricing of sovereign risk, currency or rates positioning may be forming. This domestic-international spread has proved especially relevant in emerging markets like Turkey, Brazil and China, where narrative overshoots can drive significant portfolio impact.
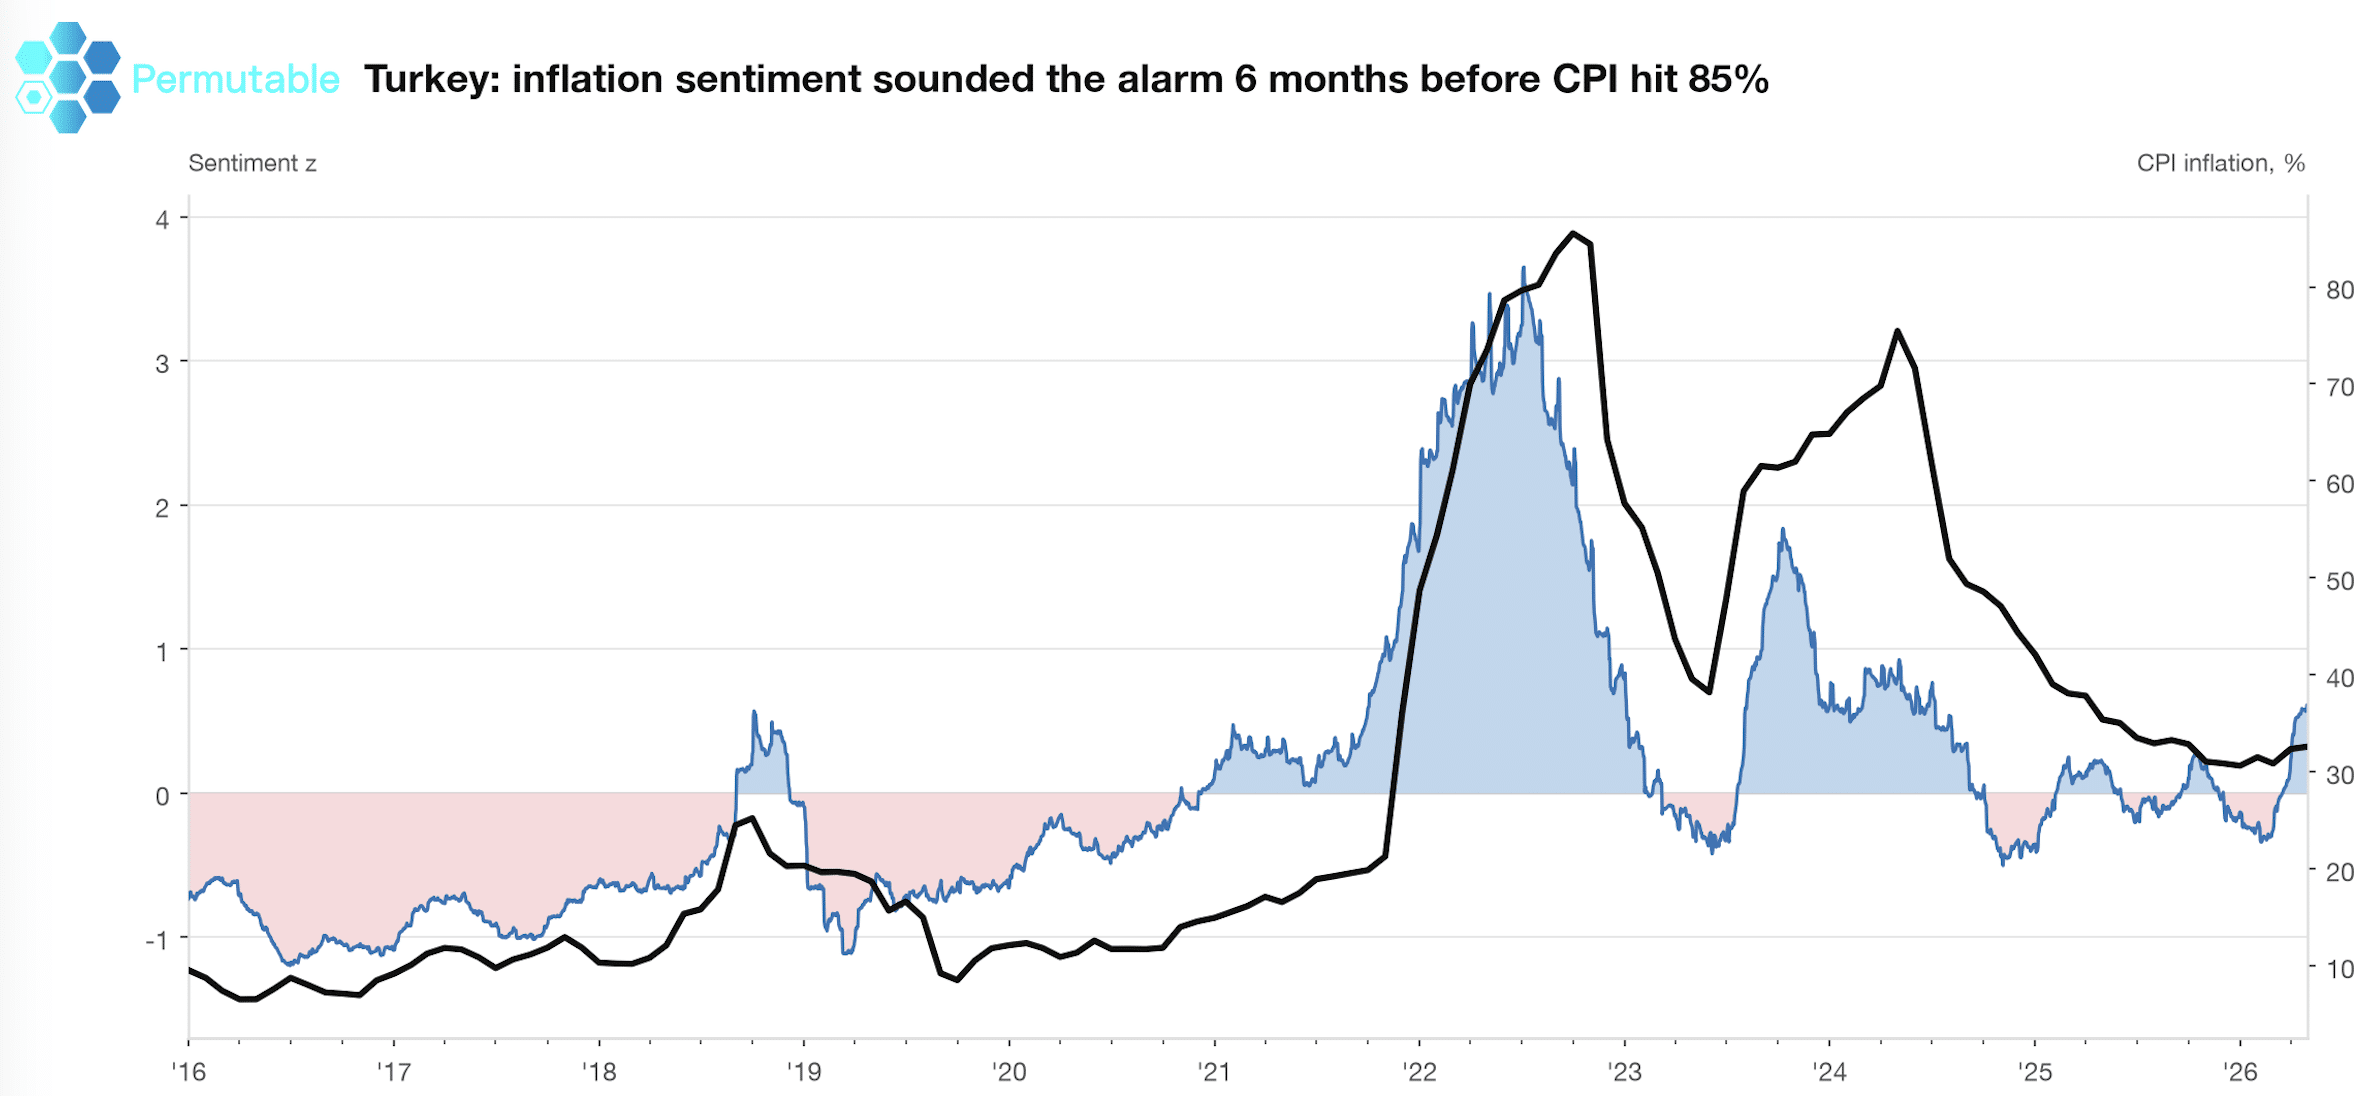
Above: Turkey inflation sentiment versus CPI – Turkey’s inflation sentiment began rising six to nine months before CPI peaked above 85% in 2022 and turned lower before the official peak, capturing the transition from acceleration towards gradual normalisation.
Advanced institutional teams use statistical methods to formalise detection and reduce subjectivity. These approaches turn intuition into testable, repeatable processes.
Computing rolling means and standard deviations for your key indicators and converting them to z-scores relative to a long baseline (commonly 252 trading days) gives you a standardised measure of abnormality. A z-score crossing plus or minus 2 signals an unusual move worth investigating further.
For example, if 21-day realised vol on your benchmark rises from 12 per cent to 28 per cent and its z-score exceeds 2.5 relative to the trailing year, treat it as initial evidence of a volatility regime change.
Algorithms such as CUSUM, Bayesian online change-point detection and Pruned Exact Linear Time (PELT) locate structural breaks in mean or variance with timestamped precision. They work well for single-series detection, such as identifying a break in the realised volatility of a specific index or currency pair.
The key discipline is cross-checking the detected point against other series to avoid false alarms. A break in one series alone may be noise. A break confirmed across volatility, correlation and macro sentiment is far more credible.
Hidden Markov Models assign probabilities to discrete latent states such as low-volatility trending, high-volatility mean-reverting and transitional. They produce state probabilities that can be evaluated as inputs to internally governed research and risk processes.
Fit a two- or three-state HMM to daily returns and realised vol for your benchmark. A persistent probability above an internally tested threshold may provide a candidate regime indication for further investigation. The 0.6 level is illustrative rather than universal. Permutable’s point-in-time macro sentiment history, with over 11 years of data, can serve as an additional feature layer for these models.
GARCH-family models generate short-term volatility forecasts and flag sudden increases in expected variance. If the GARCH forecast rises sharply and is confirmed by realised moves and implied-vol data, the evidence for a regime shift strengthens.
Consider augmenting GARCH forecasts with realised-volatility measures to capture jumps and intraday variance that standard GARCH specifications may undercount.
A quant desk doesn’t need a macro call. It needs a state variable: what regime are we in, right now, before the next print. GMSI Directional sentiment supplies that directly, sourced from policy news and standardised into a point-in-time z-score, with no forecast layer and no economist’s judgement sitting between the headline and the signal.
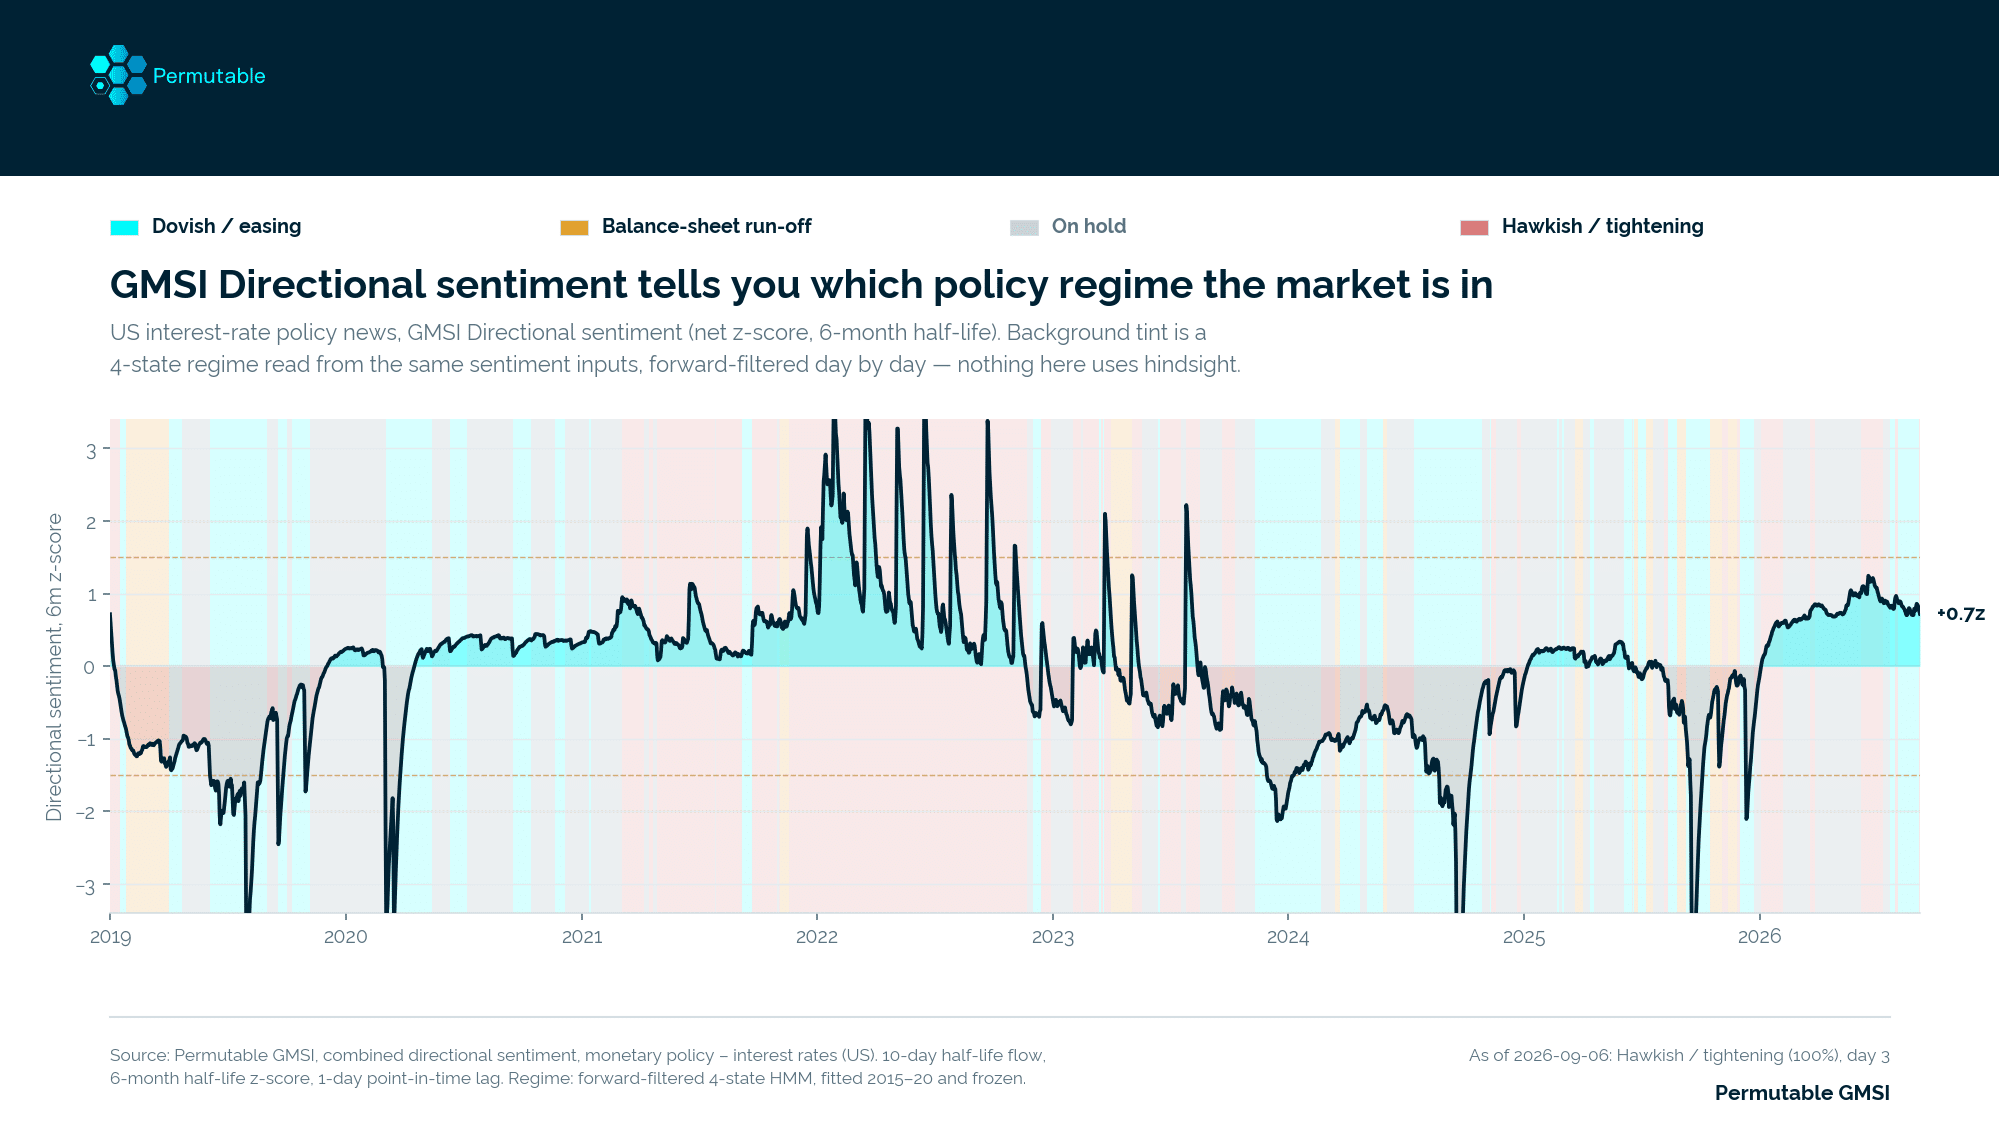
The navy line is GMSI Directional sentiment on US interest-rate policy news: a 10-day half-life news flow, standardised against its own trailing six-month window (a 182-day half-life z-score), lagged one day so no observation ever informs its own baseline. That’s the only input.
The coloured bands behind it are the output of a four-state hidden Markov model fitted on that sentiment alone: dovish/easing, balance-sheet run-off, on hold, hawkish/tightening. The state is forward-filtered day by day, meaning the label on any given date uses only information available up to that date, nothing after it.
As of 6 September 2026 the model reads hawkish/tightening at 100% posterior probability, three days into that call, with sentiment printing +0.7z. Tested against five years of US Treasury yields, days the model flagged hawkish carried the entire multi-year rise in the 10-year. Not a lagging confirmation: a same-day read.
The same construction, topic sentiment to half-life z-score to state-space regime model, runs on any GMSI-covered topic or country: other central banks, fiscal stance, trade and tariff risk, geopolitical tension, supply-chain disruption. It scales from a single-country monitor to a cross-country divergence read (who’s hawkish relative to whom), and from a discrete regime label to a continuous conditioning variable for sizing exposure or risk budget rather than switching it on and off.
A single spike in any indicator is rarely enough to declare a regime change. You need rules that demand persistence and cross-confirmation. Here is a multi-step decision framework you can implement and adapt to your time horizon.
One indicator crosses a high-sensitivity threshold. For example, 21-day realised vol z-score exceeds plus 2 relative to the trailing 252 days.
A second independent indicator confirms the signal. This could be VIX above its 90th percentile, average pairwise correlation exceeding 0.55 or a sharp move in macro sentiment across multiple topics.
The joint signal persists for a defined number of sessions, typically three to seven days depending on your holding period. Transient spikes that revert in one to two days are filtered out.
A macro threshold is met: CPI year-on-year above a defined trigger, a yield-curve move exceeding 75 basis points in a month, or a sustained shift in policy-outlook sentiment.
Subject to internal validation, mandate constraints and governance, teams may then consider applying their predefined regime-specific framework
This layered logic reduces whipsaw risk. You can tune the thresholds and persistence windows through out-of-sample validation and walk-forward testing.
Three recent examples illustrate how different dimensions of regime change appear in practice and how early narrative signals help identify them.
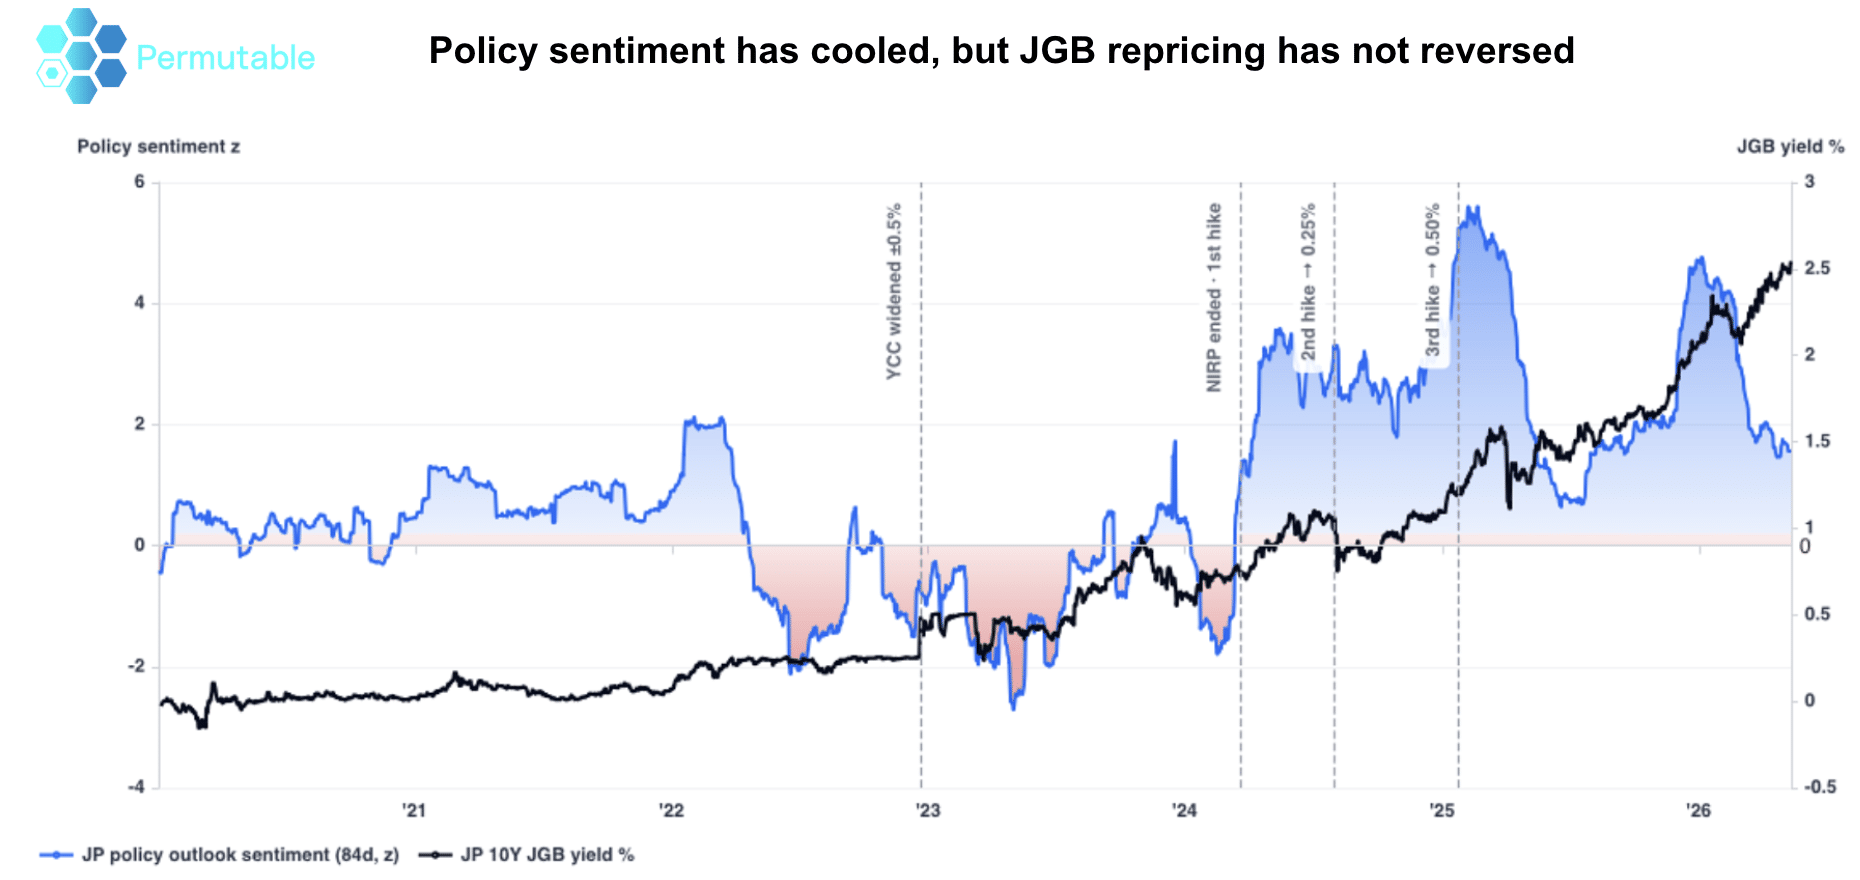
Following the Bank of Japan’s exit from negative interest rates and yield-curve control in March 2024, monetary-policy sentiment moved sharply higher. By 2026, that sentiment had cooled considerably. Yet the 10-year JGB yield continued rising toward 2.5 per cent rather than returning to its pre-normalisation range.
That divergence between cooling policy narrative and persistent yield repricing signals a structural regime shift. The market is no longer treating the exit from ultra-loose policy as temporary. For rates desks, the relevant question becomes: what evidence would be required for the market to price the old regime again?
Annual CPI can fall because of base effects while the forces sustaining inflation, including currency weakness, wage resets, administered-price increases and household expectations, remain active. Turkey demonstrates why a lower headline number alone does not confirm a regime exit.
A credible turn becomes visible only when multiple channels change together: weaker pass-through in local reporting, pricing pressure losing breadth, demand softening and inflation sentiment falling and staying lower rather than rebounding after one favourable release.
In Brazil, the regime signal lies in the reaction function, not the policy rate level. A central bank can continue cutting rates in a relatively hawkish environment if its communication stresses limited room to ease, fiscal uncertainty or renewed inflation risk.
The turning points occur when one policy narrative loses dominance and another gains control. For FX and rates investors, recognising that transition early helps separate a temporary repricing around a single meeting from a broader change in the expected direction and pace of the policy cycle.
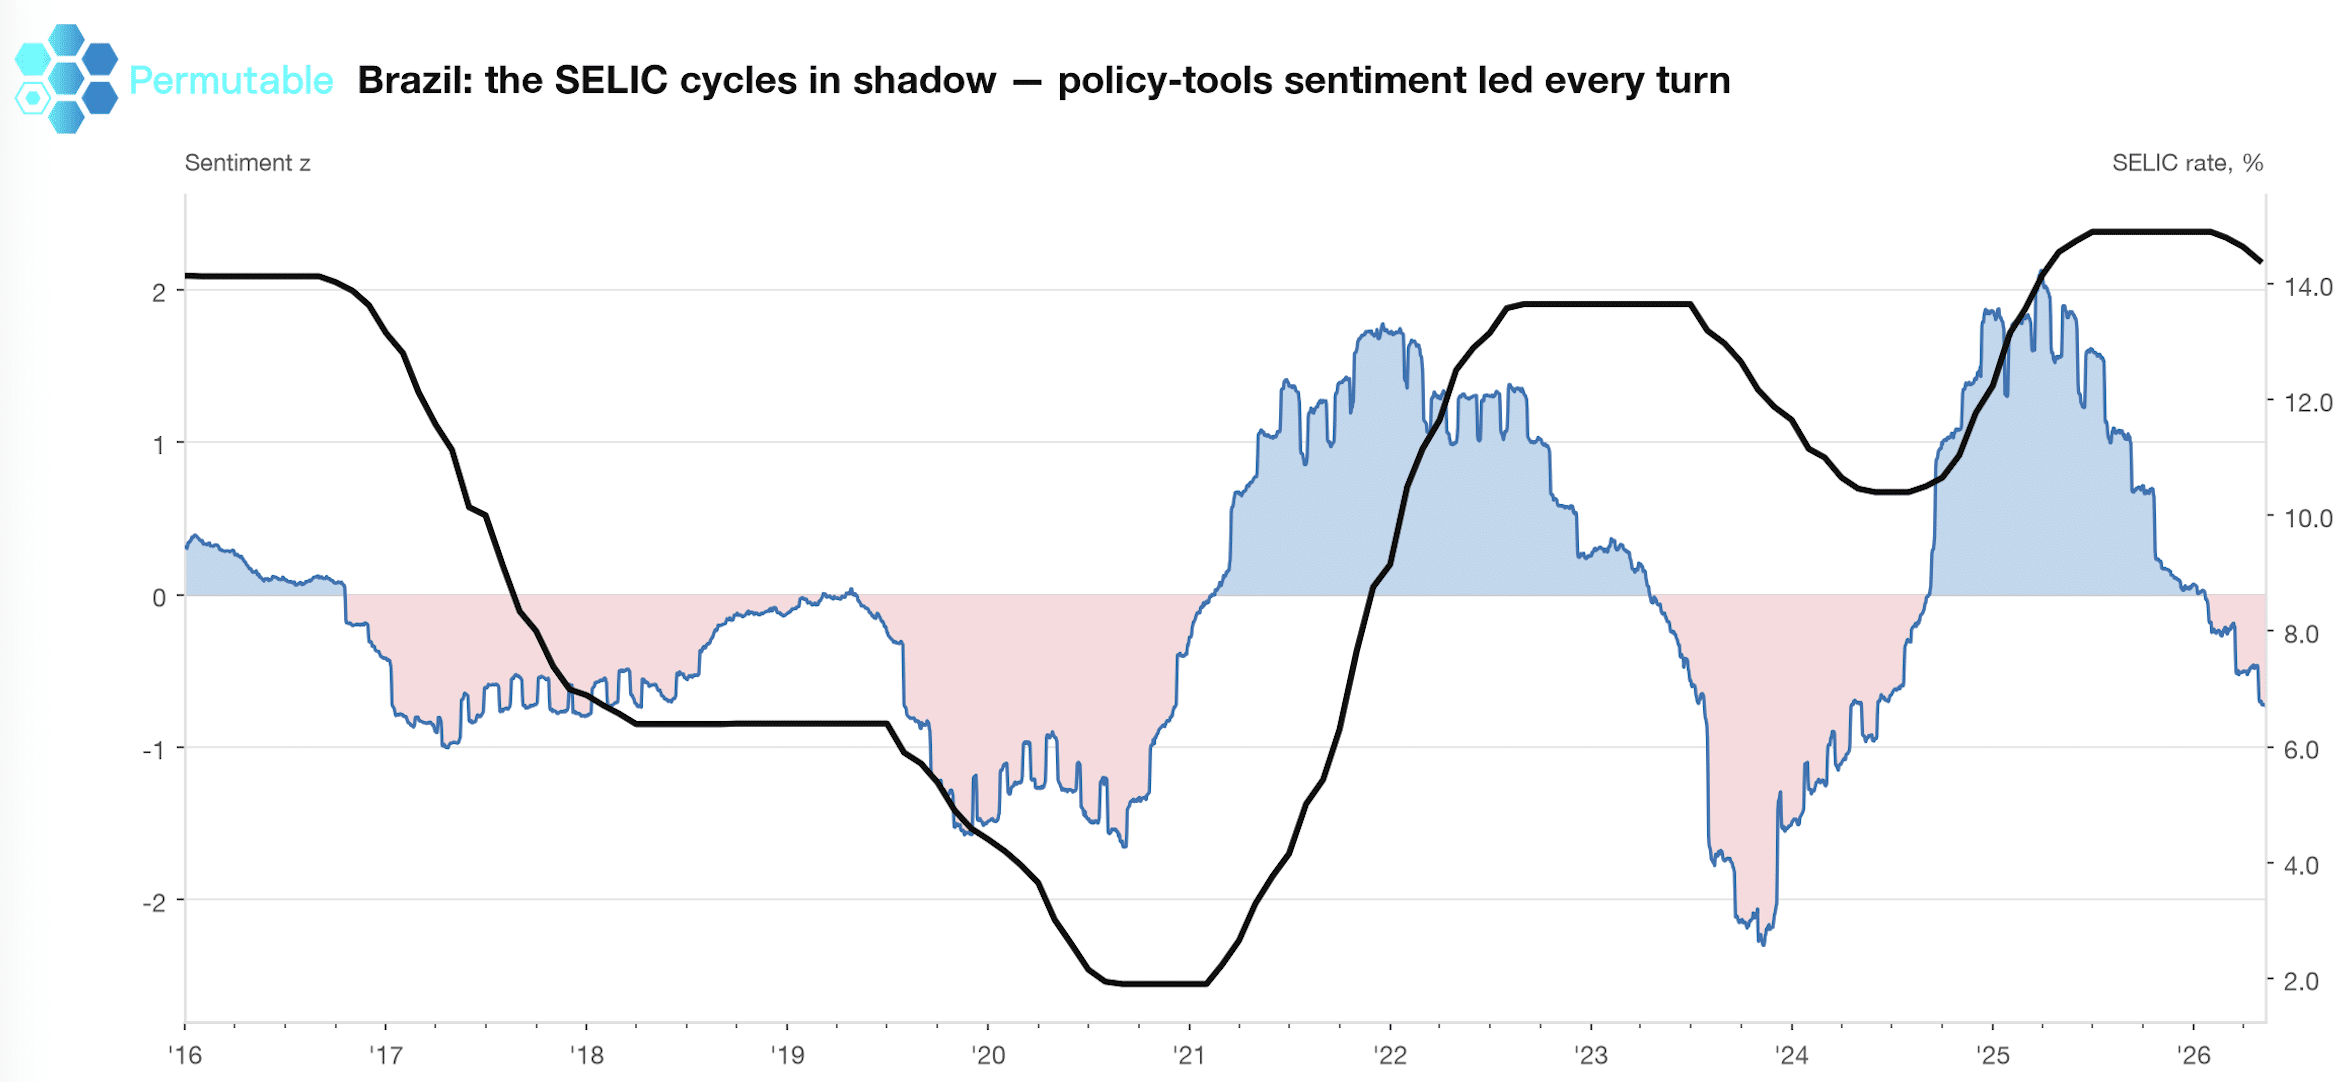
Above: Brazil policy sentiment versus the Selic rate – Permutable’s Brazilian policy sentiment tracked the changing reaction function across successive easing and tightening cycles, providing an earlier read on the direction of policy than the Selic rate level alone.
Detecting a regime is only useful if you have predefined actions tied to the signal. Create regime-dependent playbooks so you respond consistently and avoid emotional decision-making.
Teams may test whether different exposure levels, risk limits and factor tilts have historically behaved differently during low-volatility trending regimes. In a high-volatility mean-reverting regime, potential responses for internal testing may include lower exposure, increased liquidity buffers, adjusted risk parameters and different strategy or hedging allocations.
Teams may examine whether reducing concentrated risk-on exposures or changing factor allocations improves resilience under historically stressed conditions. The relative behaviour and cost of different hedging instruments can be evaluated under each regime, including futures- and options-based approaches
For systematic macro teams, GMSI signals can serve as a regime classifier, a cross-sectional ranking factor or a risk overlay. A rolling z-score of policy-outlook sentiment, for instance, can be tested against forward changes in front-end rates. Permutable’s API delivers the same raw schema across historical and live endpoints, so the feature you test on 11 years of history is the same feature you run in production.
Across different geographies, asset classes and macro drivers, four questions should govern your evaluation of any regime signal:
Direction: Has the signal moved decisively away from its previous range?
Breadth: Is the change visible across multiple drivers, sources and parts of the economy?
Persistence: Does it survive beyond one release, policy meeting or market shock?
Confirmation: Is the shift also becoming visible in market pricing, forecast revisions or hard data?
These four criteria, applied consistently to every signal, help separate genuine regime transitions from noise. They also create a shared vocabulary for your team, so research, trading and risk functions are aligned on what counts as a real change versus a temporary fluctuation.
Historical testing of regime signals must be conducted on a point-in-time basis. Revised economic series and retrospectively reconstructed narratives can make turning points appear far cleaner than they were to investors in real time.
Your research process should use only information that was available at each timestamp, with no lookahead bias. This discipline applies to every data input: official macro releases, market data and especially sentiment signals, where the risk of backfill is highest.
Permutable’s Global Macro Sentiment Indices preserve point-in-time history using frozen production models trained in 2020. Post-2020 events, including the pandemic, the inflation surge and the global tightening cycle, were processed as unseen regimes. This means your backtest evaluates how the signal actually behaved, not how it would have behaved with the benefit of hindsight.
Regime-detection methods such as Markov-switching or hidden Markov models can be layered on top of these sentiment inputs. The classification should rely on filtered regime probabilities calculated using only information available on each date, rather than smoothed probabilities estimated with later observations. The intelligence engine behind the indices supports this level of institutional rigour.
Detecting macro regime shifts is a discipline that combines indicator design, statistical methods and predefined execution rules. If you build a multi-indicator detection system and demand cross-confirmation and persistence, you reduce false alarms and make more robust adjustments to your strategy.
A possible research implementation might be to construct a monitoring dashboard with realised vol, implied vol, correlation and key macro sentiment series, implement a change-point detector and a hidden Markov model or build a two-regime sizing and hedging playbook with realistic costs.
The goal is to test your features on point-in-time history and run the same logic live, and then manage risk, adapt faster and maintain an information edge during the window between a narrative forming and official data catching up.
A macro regime shift is a persistent change in the process generating inflation, growth, policy and asset-price behaviour. It matters because strategies and hedges optimised for one regime can fail in another. Permutable AI’s Global Macro Sentiment Indices help you identify when narrative conditions are changing ahead of official data.
Real-time sentiment data tracks how inflation, policy and growth narratives develop across thousands of sources in local languages. Permutable structures this flow into hourly, point-in-time signals across 95+ economies, giving you an earlier read on macro transitions than monthly or quarterly government statistics can.
Hidden Markov Models, change-point detection algorithms like CUSUM and PELT, and GARCH-based volatility forecasting are all effective. The most robust approach combines multiple methods. Permutable’s 11+ years of point-in-time macro history can serve as an additional feature layer for these statistical models.
Require cross-confirmation from at least two independent signal types, apply persistence tests of three to seven sessions, and use macro-level filters to validate the shift. Avoid relying on any single indicator. Layered confirmation logic significantly reduces whipsaw risk.
Domestic signals capture local-language reporting from inside an economy. International signals reflect external perception through global media and institutional commentary. Permutable AI separates the two views, and the gap between them can be one of the earliest indicators of a regime-level repricing in currencies, sovereign risk and rates.
Define the target asset, horizon, feature construction and lag convention before testing. Use walk-forward validation, out-of-sample periods and realistic transaction costs. The processing logic applied to historical data must be identical to what runs live. Permutable’s consistent API schema across historical and live endpoints supports this discipline.
Important information
This material is provided by Permutable for information and research purposes and is written for professional and institutional audiences. It does not constitute investment advice, a personal recommendation, an offer or solicitation to buy or sell any financial instrument, or a recommendation to adopt any particular investment strategy.
References to indicators, thresholds, portfolio approaches, asset classes and historical market outcomes are illustrative only. They should not be relied upon as the basis for an investment decision. Historical relationships and past performance are not reliable indicators of future results.
Users should conduct their own research and assessment, including consideration of risk, liquidity, transaction costs and applicable mandate constraints. Permutable provides data and analytical tools; all investment, portfolio and risk-management decisions remain the responsibility of the user.

Analysis
16 Oct 2026
Gold outlook 2026: Why US rates outweigh geopolitical risk
Read more >
Analysis
14 Oct 2026
Beneath US headline inflation: tracking pressure across energy, food, services and housing
Read more >
Analysis
13 Oct 2026
France’s debt alarm hits a decade high and drowns out the rest of the G20
Read more >