
Global Macro Sentiment Indices: Turning point-in-time macro sentiment data into live systematic workflows
01 Jul 2026
01 Jul 2026
This article explains how Permutable’s Global Macro Sentiment Indices turn macro narrative signals into point-in-time macro sentiment data that systematic macro, rates and quant research teams can test, validate and run live. It is aimed at institutional investors building systematic trading workflows, alternative data pipelines and macro sentiment feature layers for research, risk and production use cases globally at scale.
Macro narratives often move before official data confirms them. The challenge for systematic investors is turning that narrative into point-in-time macro sentiment data that can be tested, validated and reproduced live.
Permutable’s Global Macro Sentiment Indices solve this by structuring global headline flow into hourly macro narrative signals across countries, topics, sentiment types and source perspectives. For teams using macro sentiment data for systematic trading, the value is not a generic mood score, but a reproducible macro sentiment feature layer that can move from research into production.
Using our US Monetary Policy – Policy Outlook directional sentiment index, a +1 standard deviation rise in policy outlook sentiment has historically been followed by meaningful front-end yield repricing.
In the tested forward windows, the strongest response appears in 3-month and 2-year rates, with a +18.6bp move in 3M yields and +15.9bp move in 2Y yields over 60 trading days. The curve response is also intuitive: stronger policy outlook sentiment is followed by 2s10s flattening, suggesting the repricing is concentrated at the policy-sensitive front end rather than spread evenly across the curve.
Research use only. Not investment advice.
Macro narratives move markets before the data does. Few people running a book would argue otherwise, and most systematic desks would concede the point. The difficulty is what to do with the concession, because narrative arrives as language and language does not back-test.
Before it can sit inside a model, it has to become systematic macro research data: something with a country attached, a driver attached, a magnitude, a timestamp and enough history to show whether it ever carried information.
That conversion is what Permutable’s Global Macro Sentiment Indices are built for. GMSI turns global headline flow into point-in-time alternative data for macro strategy, rates research, FX modelling and cross-asset systematic workflows.
Permutable’s Global Macro Sentiment Indices reads global headline flow and returns hourly, point-in-time signals across 95 markets, 70 macro topics and 8 pillars, covering everything from economic data and monetary policy to fiscal stance, geopolitics, trade and market stress.
The coverage is deliberately global. It draws on international wires and local on-the-ground sources from a curated base of more than 250,000 publishers across 100-plus countries, with non-English reporting detected, translated and run through the same classifier, so a headline filed in Tokyo or São Paulo lands in the same framework as one from New York or London.
For a systematic desk, getting sentiment into point-in-time form has always been the hard part. GMSI gives you the raw material: hourly sentiment inputs on a single schema across the historical and live endpoints, keyed by country, topic, sentiment type, index type and timestamp, with the activity fields alongside.
That is the raw data, not a finished feature. The desk builds the feature itself. You transform, normalise and test it on history, then run the same logic, unchanged, on the live feed.
That is where macro sentiment data for systematic trading becomes valuable. The narrative stops being something read in the morning meeting and becomes a structured input that can be tested, ranked, monitored and positioned around.
The point of GMSI is to make macro narrative behave like market data. Every hourly observation is keyed by country, topic, sentiment type and index type, and carries the fields a modeller needs beside it: how many headlines fed the reading, the net sentiment, the total signal magnitude and the dispersion across the flow.
So a quant does not simply learn that US inflation sentiment rose. They learn how far it rose, on what weight of coverage, how much of that coverage disagreed, whether it came from inside the country or outside, and whether the move was in the direction of the story or only in its tone.
That is the difference between a dashboard reading and a macro sentiment feature layer. One describes the narrative. The other can be tested as a model input.
The detail earns its keep because the drivers behave differently. Policy outlook, inflation pressure, fiscal stance, geopolitical tension and market stress do not surface in the same place or at the same speed. They run through different assets and decay over different horizons. Folded into one sentiment score, they cancel and blur. Kept apart, each one stays readable.
Three of those separations carry most of the weight.
The first is the driver, which is really the economic channel you are trading. A rates model wants policy outlook, inflation pressure and central-bank credibility. An FX model wants relative policy sentiment, energy inflation, external vulnerability, or the distance between how a country talks about itself and how the rest of the world talks about it. A cross-asset model wants breadth: where inflation pressure is widening, where fiscal sentiment is turning, where geopolitical stress is starting to concentrate.
The second is direction against tone. Directional sentiment tracks the topic itself: on inflation, a positive reading means price pressure building; on rates, expectations rising; on geopolitics, risk climbing. Semantic sentiment tracks the register the story is told in, whether assured, wary, alarmed or complacent.
The two come apart more often than you would expect. A central bank can read as hawkish in substance while the coverage around it grows uneasy. Prices can still be climbing while the language about them sours. Direction belongs closer to the forecast, tone closer to the risk.
The third is whose eyes you are seeing through. Domestic coverage shows how an economy is discussed from within. International coverage shows how it reads from outside. Combined coverage gives the broad picture. For some strategies, the spread between the first two is the signal in itself, because the point where local and foreign perception stop agreeing tends to be where a repricing starts.
A quant process does not open with the grand question of whether sentiment works. It opens with a position to express: a point on the curve, a bond future, a currency pair, a dollar basket, a policy-rate path, a cross-asset book.
Once the target and horizon are set, GMSI becomes the narrative layer you test against them, and the question narrows to something you can answer.
Does this feature, defined this precisely, carry information about this variable over this horizon?
From there it is construction work. You pull the historical endpoint, choose the countries, topics, sentiment types and index types, and shape features around the target and the holding period: rolling sums and averages, fixed or expanding z-scores, activity-weighted sentiment, the domestic-international spread, the gap between direction and tone, topic breadth, and regime-dependent weights.
Cadence is a design choice in its own right. The data is hourly, but few strategies trade hourly. A medium-horizon macro book might care about sentiment pressure built up over 28 or 84 days. A live rates desk might care only about what moves in the hour a policy statement lands.
Either way the rule holds: you fix the feature before you let the data judge it. Country, topic, sentiment type, index type, coverage view, lookback, normalisation and cadence are not settings around the signal. They are the signal.
Figure 1 shows the construction step. GMSI supplies the raw hourly sentiment structure. The model-ready feature is built client-side by applying the same aggregation, normalisation and lag convention to historical data and to live endpoint inputs.
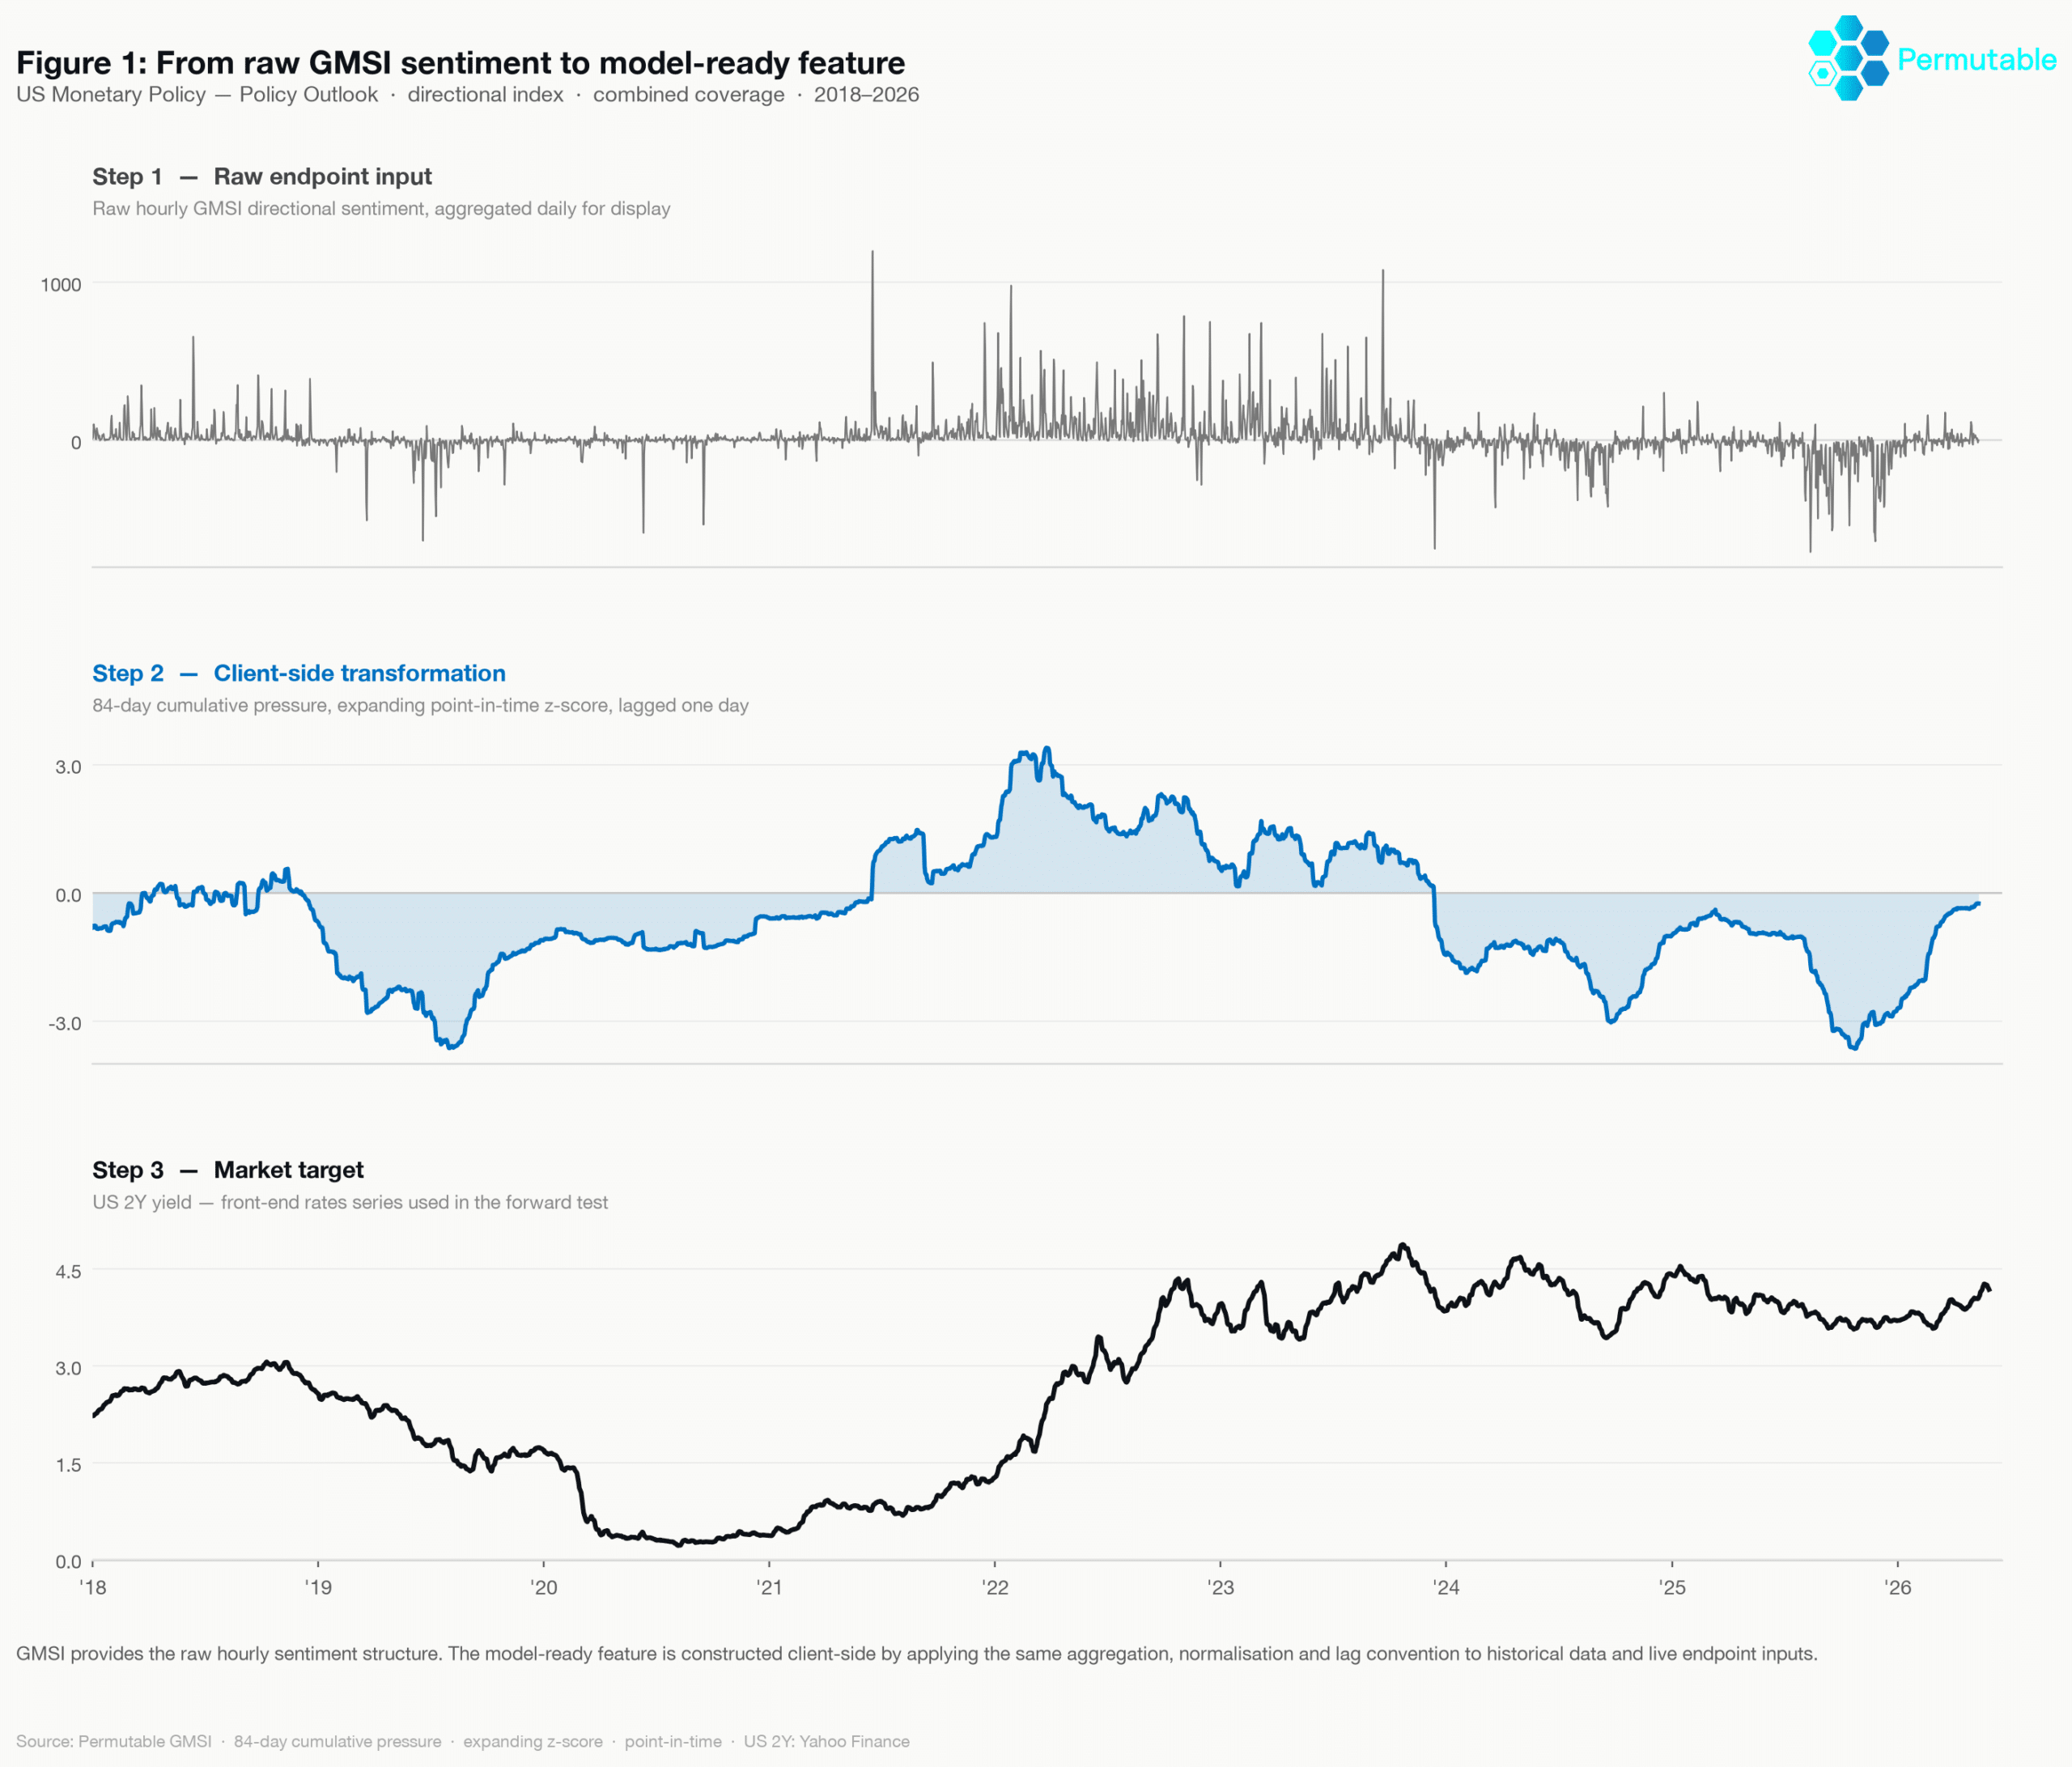
Figure 1: From raw GMSI sentiment to model-ready feature. GMSI supplies the raw hourly sentiment structure. The model-ready feature is constructed client-side by applying the same aggregation, normalisation and lag convention to historical data and to live endpoint inputs.
Research leans on history. With eleven years of point-in-time data behind it, a desk can ask whether a sentiment feature adds anything once the macro, market and price inputs already in the model are accounted for.
The bar is not the best in-sample fit anyone can torture out of the data. It is a mechanism you can explain and a result that survives leaving the training window: walk-forward tests, lead-lag, a benchmark to beat, a stable sign, sensible coverage thresholds, and results broken out by country, topic and sentiment type rather than reported in aggregate.
A feature does not have to work everywhere. It has to work where the channel is clean, the coverage holds up, and the edge does not evaporate the moment it meets data it has not seen.
Then comes the part that quietly sinks most sentiment projects: reproducing the feature live. The historical and live endpoints hand over the same raw structure — country, topic, sentiment type, index type, timestamp, headline count, net sentiment, signal magnitude and dispersion — but neither hands over a finished feature.
That work stays with you, and the discipline is to apply exactly the same transformation logic to the live data as to the history behind it: the same aggregation window, the same normalisation, the same coverage view, the same lag, the same treatment of sparse observations.
The failure modes are easy to name. An 84-day z-score of policy outlook cannot quietly become a raw hourly print in production and still count as the same signal. A model built on domestic-international divergence cannot be handed combined coverage because that was easier to wire up. A daily feature does not become an intraday execution signal without going back through validation.
The live feed is not a shortcut around the research. It is the same structure arriving in real time, and the strategy holds together only as long as the feature built from it is transformed the same way it was in the test.
The cleanest way to see the workflow is on US rates.
Take one feature: the Policy Outlook topic under US Monetary Policy, on the combined directional index. The channel is about as direct as macro gets. When the score rises, the story around Fed policy is hardening: higher-for-longer, more restrictive, more front-end sensitive.
This is where policy outlook sentiment becomes more than a label. As point-in-time macro sentiment data, it can be lagged, normalised and tested against forward changes in 3-month, 2-year, 10-year and curve outcomes.
If that reading carries information, it should show up where policy expectations do most of the pricing: at the front of the curve.
It does. On a point-in-time z-score lagged a single day and tested over non-overlapping forward windows, the strongest response sits in the three-month and the two-year.
A one-standard-deviation rise in Policy Outlook is followed by 18.6bp on the three-month yield over the next 60 trading days, and 15.9bp on the two-year over the same stretch.
The curve agrees: higher Policy Outlook sentiment leads 2s10s flatter, with the repricing landing at the front rather than spreading evenly across the curve.
Figure 2 shows the evidence layer. The transformed feature is tested against non-overlapping forward changes in US rates. A +1 standard deviation move in Policy Outlook is followed by larger front-end yield increases and a flatter 2s10s curve, consistent with policy-path repricing concentrated at the front.
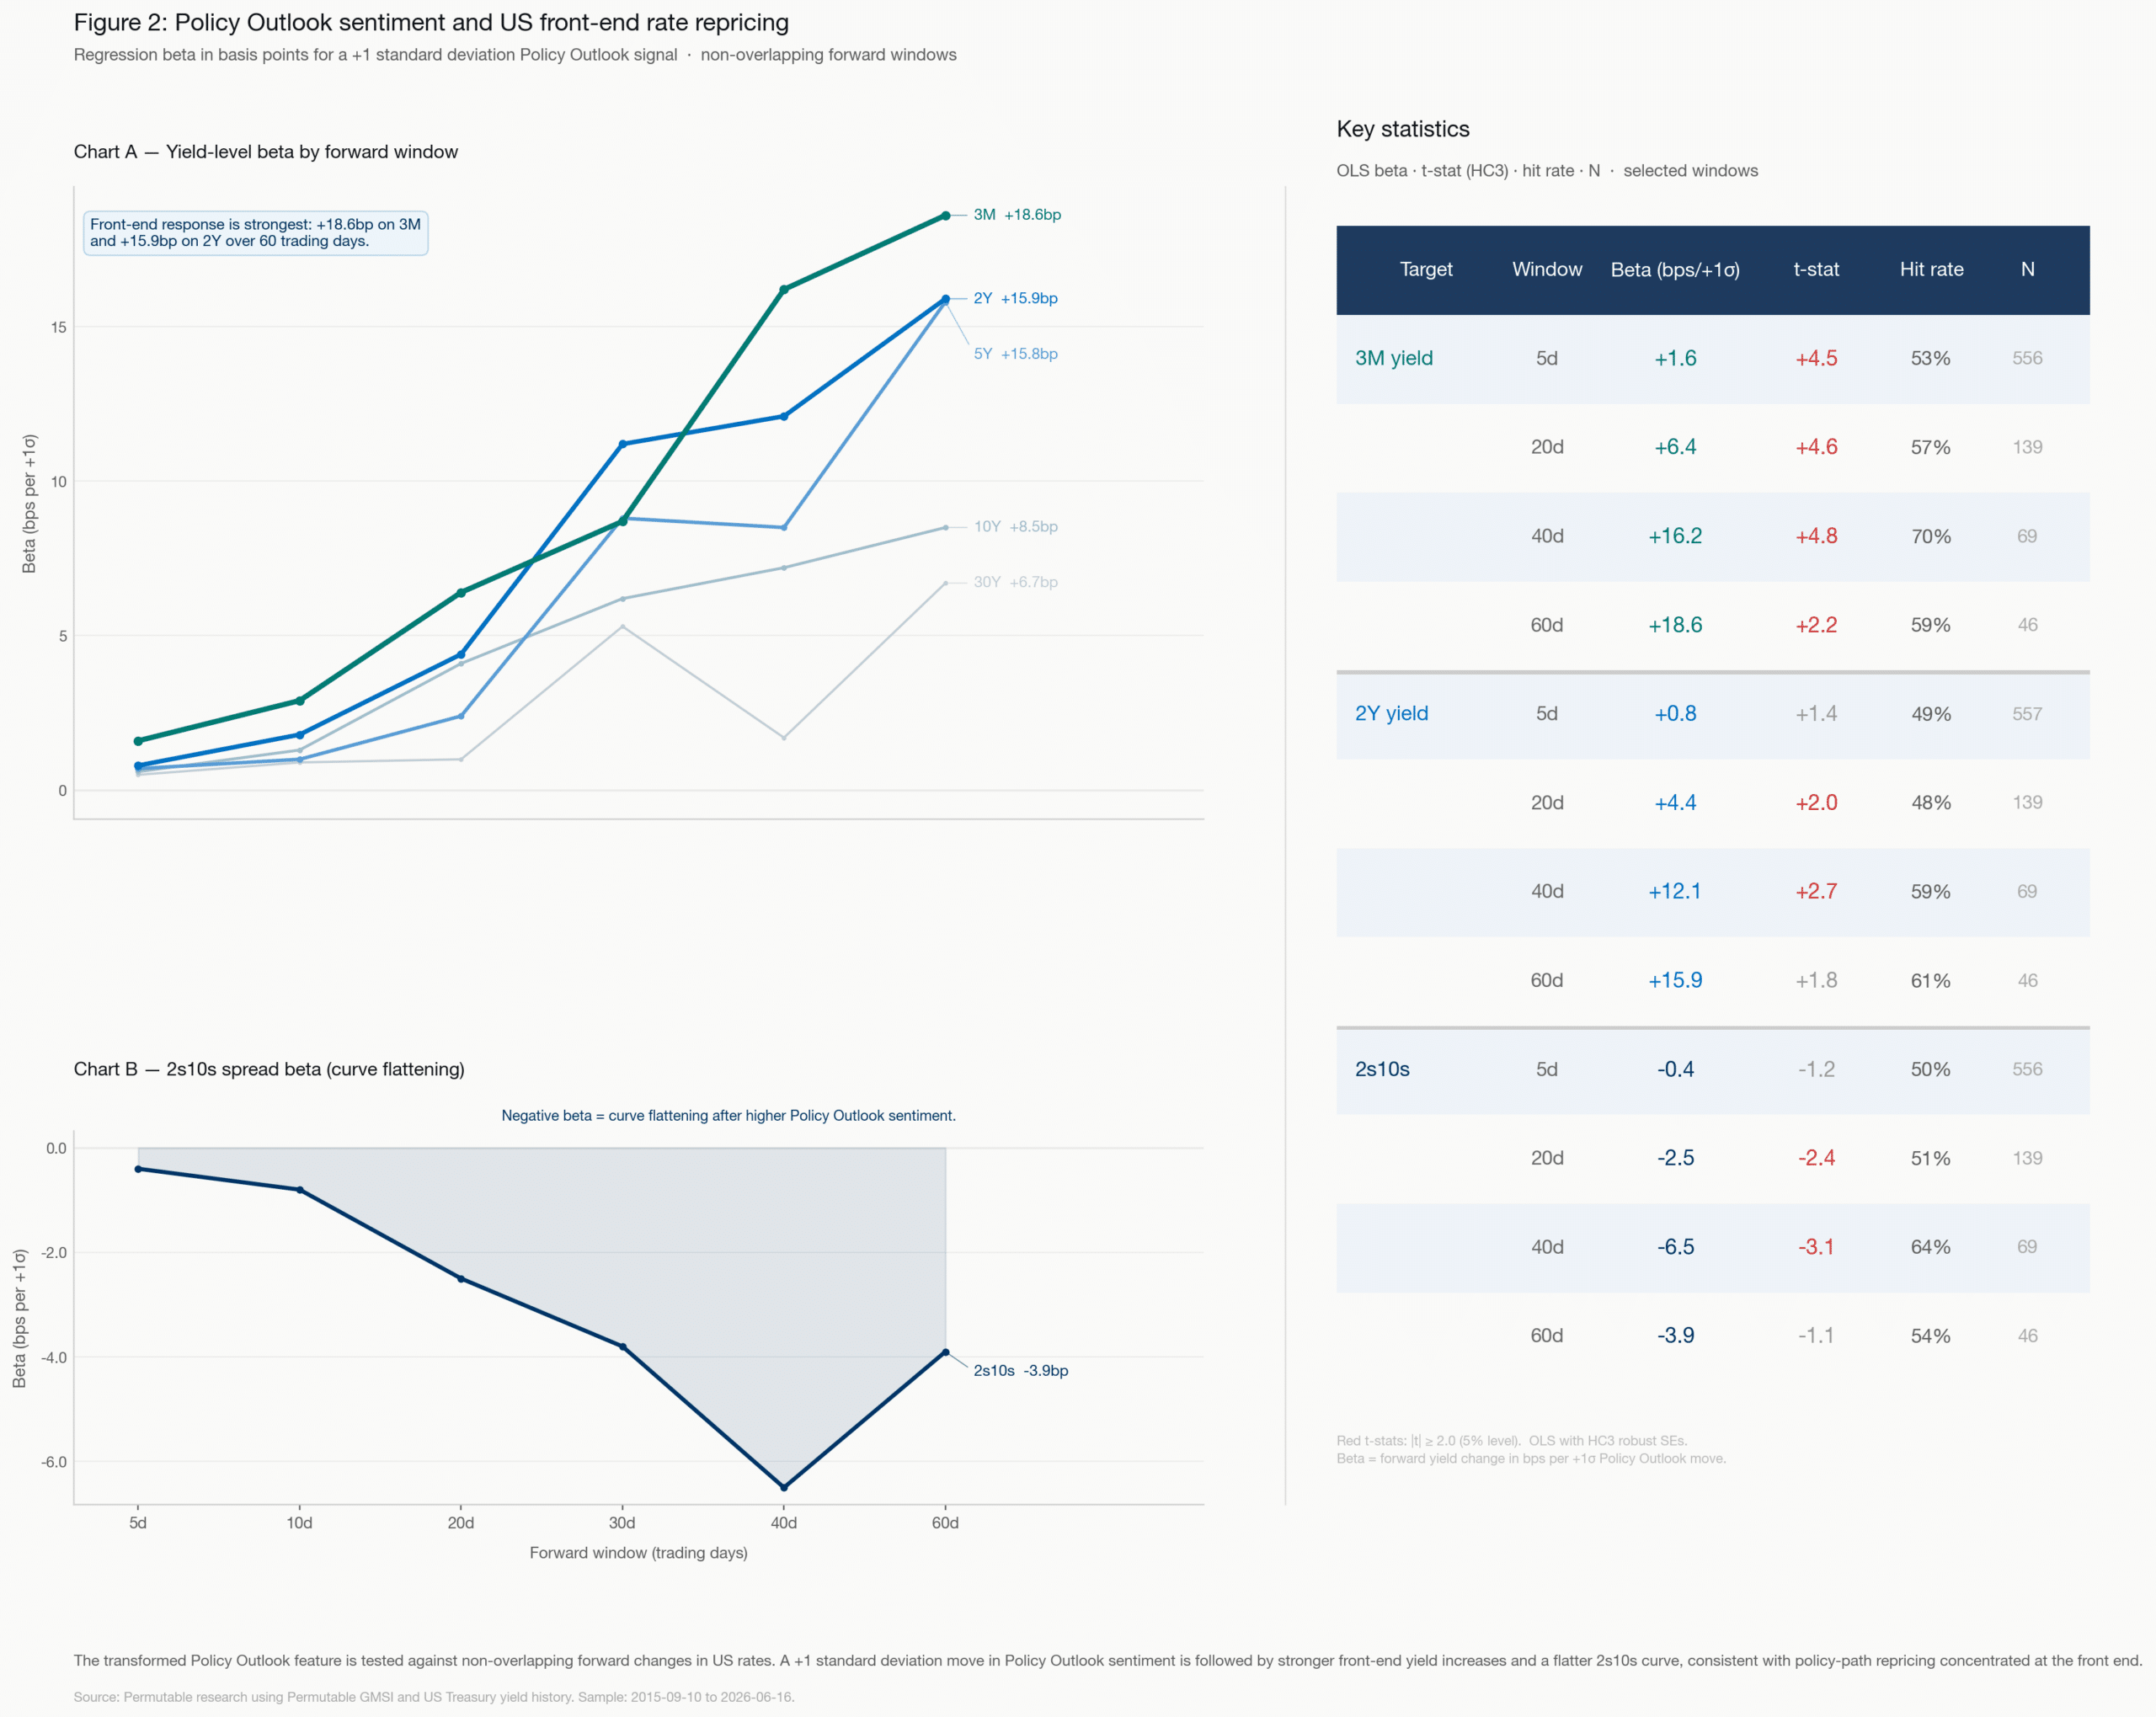
Figure 2: Policy Outlook sentiment and US front-end rate repricing. The transformed Policy Outlook feature is tested against non-overlapping forward changes in US rates. A +1 standard deviation move in Policy Outlook sentiment is followed by stronger front-end yield increases and a flatter 2s10s curve.
The discipline around that result is what makes it worth anything. GMSI is not being read as a general rates mood. One driver has been mapped to the part of the curve where its channel is strongest, defined once, lagged by a day and tested against forward outcomes.
The same raw structure can then be watched live, with the same transformation logic from the historical test applied to it.
That is the production value of point-in-time alternative data. The research input and the live input do not change shape. The same schema supports both the back-test and the production workflow.
Once a feature has earned its place, it can play more than one role:
None of that turns on a particular instrument. It turns on the lag between a narrative forming and the data confirming it, which is the window a point-in-time sentiment feature is built to trade.
Permutable’s Global Macro Sentiment Indices covers 95-plus economies, 70 macro topics and eleven years of point-in-time history, with hourly directional and semantic series across domestic, international and combined coverage, drawn from more than 250,000 publishers in over 100 countries, whatever language a story was filed in.
For a systematic macro team, the worth of it is the unbroken line from research to production: broad coverage, hourly raw inputs, driver-level structure, and one consistent schema across the historical and live endpoints.
You still build the feature. What GMSI provides is the input beneath it: the same raw data, structured the same way, on history and live alike. History gives you the data to construct and test the feature. The live endpoint gives you the same data to run it on. The transformation in between is yours and stays identical on both sides.
That is what carries a signal out of a back-test and into a position without it changing shape.
Permutable’s Global Macro Sentiment Indices provide the raw hourly structure for systematic macro research, rates modelling, FX strategy and cross-asset signal development. Reach out to our team or book a personalised systematic demo to explore testing and integration.
Permutable’s Global Macro Sentiment Indices convert global macro narrative flow into structured, point-in-time sentiment data across countries, topics, sentiment types and source perspectives. They are designed to help institutional teams test whether macro narratives contain information before that information is fully reflected in official data or market pricing.
Systematic teams can use GMSI as a raw feature layer for research, signal construction, regime classification, risk overlays and cross-sectional macro analysis. The indices are not intended to be consumed as a finished trading signal. They provide structured inputs that teams can transform, normalise, lag, test and integrate into their own research and production pipelines.
Point-in-time macro sentiment data means the signal is constructed as it would have been known at the time, rather than revised with future information. This matters for systematic research because any feature used in a back-test needs to be reproducible in live production without lookahead bias.
Many sentiment projects fail when a feature that worked in research is not reproduced in the same way in production. The article focuses on keeping the same raw schema, aggregation window, normalisation method, coverage view and lag convention across both historical testing and live monitoring.
Directional sentiment tracks the topic itself. For example, in monetary policy, a positive directional reading may indicate a more restrictive or hawkish policy narrative. Semantic sentiment tracks the tone or register of coverage, such as whether reporting is confident, cautious, alarmed or complacent. For systematic teams, the difference matters because direction is often closer to the forecast channel, while tone can be more relevant to risk.
Domestic coverage shows how an economy is being discussed from within. International coverage shows how it is being perceived from outside. The spread between the two can be useful where local and foreign narratives begin to diverge, particularly in FX, sovereign risk, EM macro and cross-border capital flow analysis.
A credible validation process should define the target asset, horizon, country, topic, sentiment type, index type, coverage view, lookback, normalisation method and lag before testing. Teams should then examine out-of-sample performance, walk-forward results, lead-lag behaviour, coverage thresholds, sign stability and whether the economic channel remains explainable.
Yes. The same structure can support research across macro, FX, sovereign risk, commodities, cross-asset strategy and portfolio risk. The important step is matching the macro driver to the market expression where the transmission channel is economically plausible.
GMSI supplies the raw historical and live sentiment inputs using a consistent schema. The client applies its own transformation logic to create model-ready features. The same transformation used in the back-test is then applied to the live endpoint, helping reduce the risk that the signal changes shape between research and production.

Analysis
22 Jul 2026
UK inflation fell to 2.6% after Permutable’s Global Macro Sentiment Indices saw it coming
Read more >
Analysis
21 Jul 2026
China growth: Q2 GDP lays bare the limits of industry-led expansion
Read more >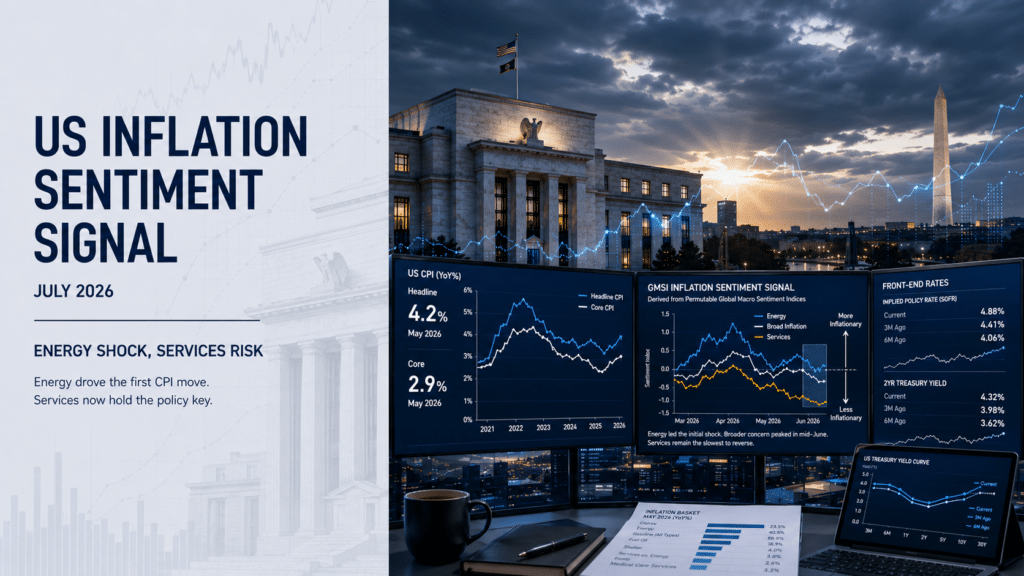
Analysis
08 Jul 2026
US inflation sentiment signal shows shift from energy shock to sticky services risk
Read more >