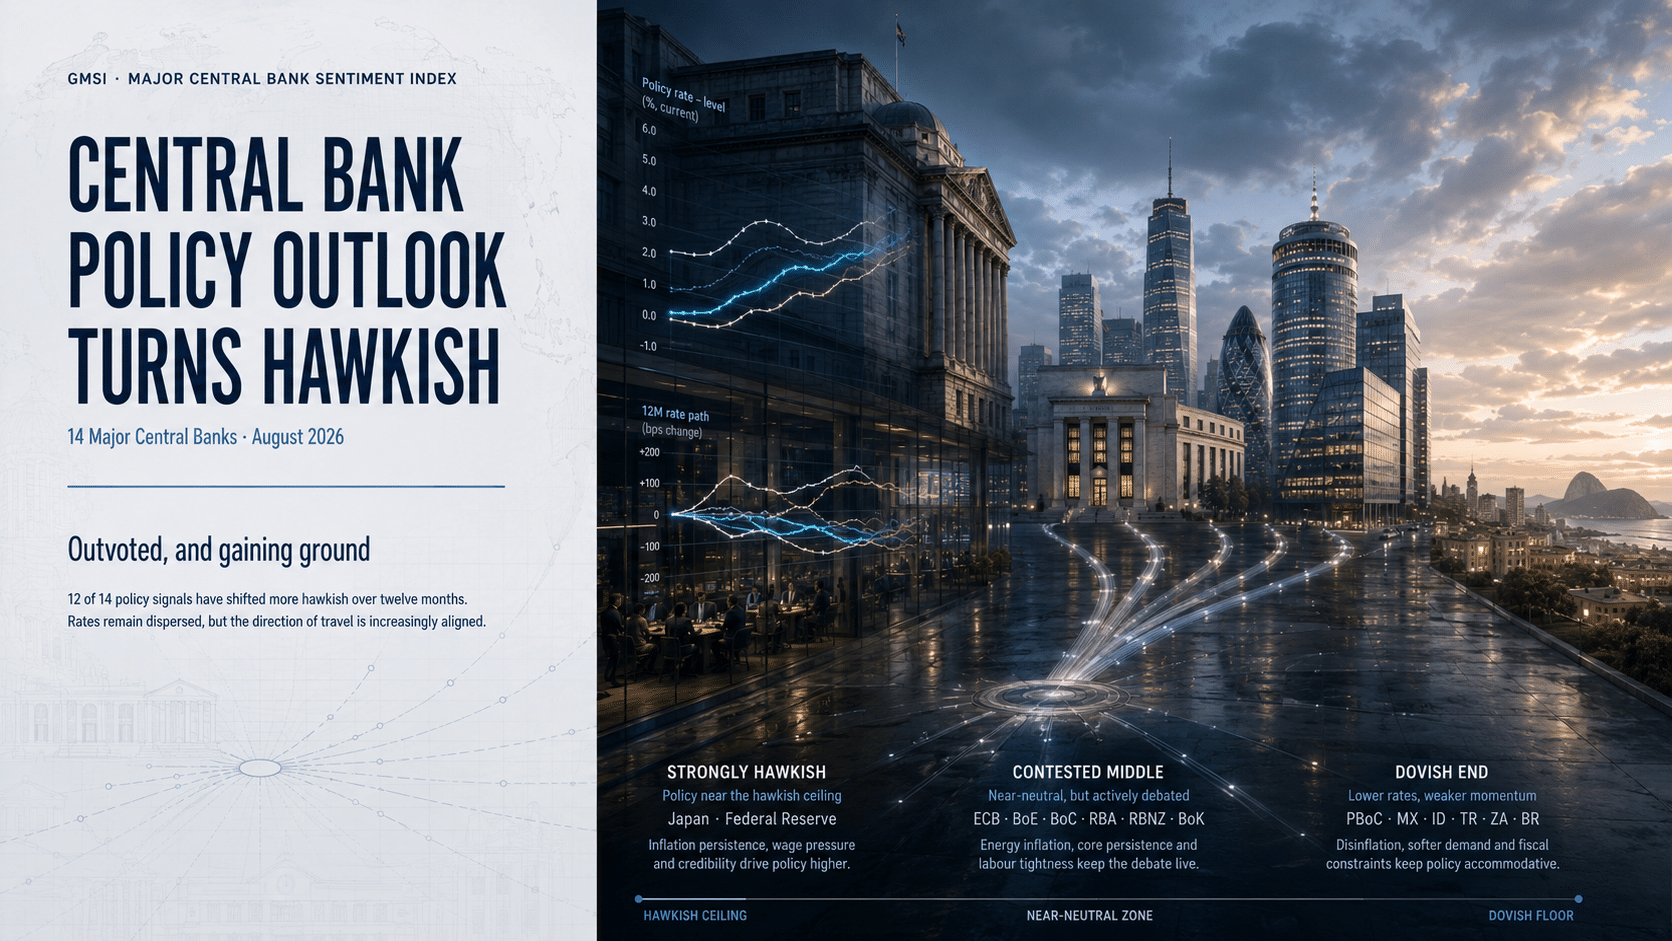
This report examines the central bank policy outlook across 14 major economies using Permutable’s Major Central Bank Sentiment Index, part of its Global Macro Sentiment Indices. It finds that 12 of 14 central banks have shifted in a more hawkish direction over twelve months despite very different current policy settings. It is aimed at macro investors, rates and FX strategists, economists, risk teams and institutional research desks.
The global central bank policy outlook has shifted in a more hawkish direction even though current policy settings remain widely dispersed. Three central banks held rates last month despite objections from hawkish minorities. The Bank of Japan voted eight to one to hold, the Federal Reserve recorded three dissents in favour of an immediate quarter-point increase, and the Bank of England voted six to three to leave Bank Rate unchanged.
Every minority lost the vote. Yet Permutable’s Major Central Bank Sentiment Index, part of our Global Macro Sentiment Indices suite, shows directional policy-outlook sentiment moving towards those dissenters. Over twelve months, policy-outlook sentiment has shifted towards the hawkish end at the Bank of Japan, Federal Reserve and Bank of England by +21.2, +81.2 and +36.0 respectively.
The Federal Reserve and the Bank of England have both been on hold since December, five consecutive meetings each, and in both cases the last move either made was a cut. Japan is different: the Bank of Japan has raised rates twice within the same twelve-month window, most recently moving to 1% in June. Its dissent also flipped from dovish to hawkish in the six weeks between the June increase and the July hold. The ECB is the other central bank to have acted, raising in June for the first time in almost three years.
Across the complete cross-section, 12 of the 14 central banks have moved towards the hawkish end over the past year. Only Russia and Brazil have moved in the opposite direction, and both are currently cutting from policy rates of 14%.
The dispersion is therefore real, but it increasingly reflects how far individual central banks have travelled rather than whether they are moving in fundamentally different directions. Energy, currencies, labour markets and domestic demand are setting the pace. Policy rates themselves usually adjust later, and in this window only Japan and the ECB have adjusted at all.
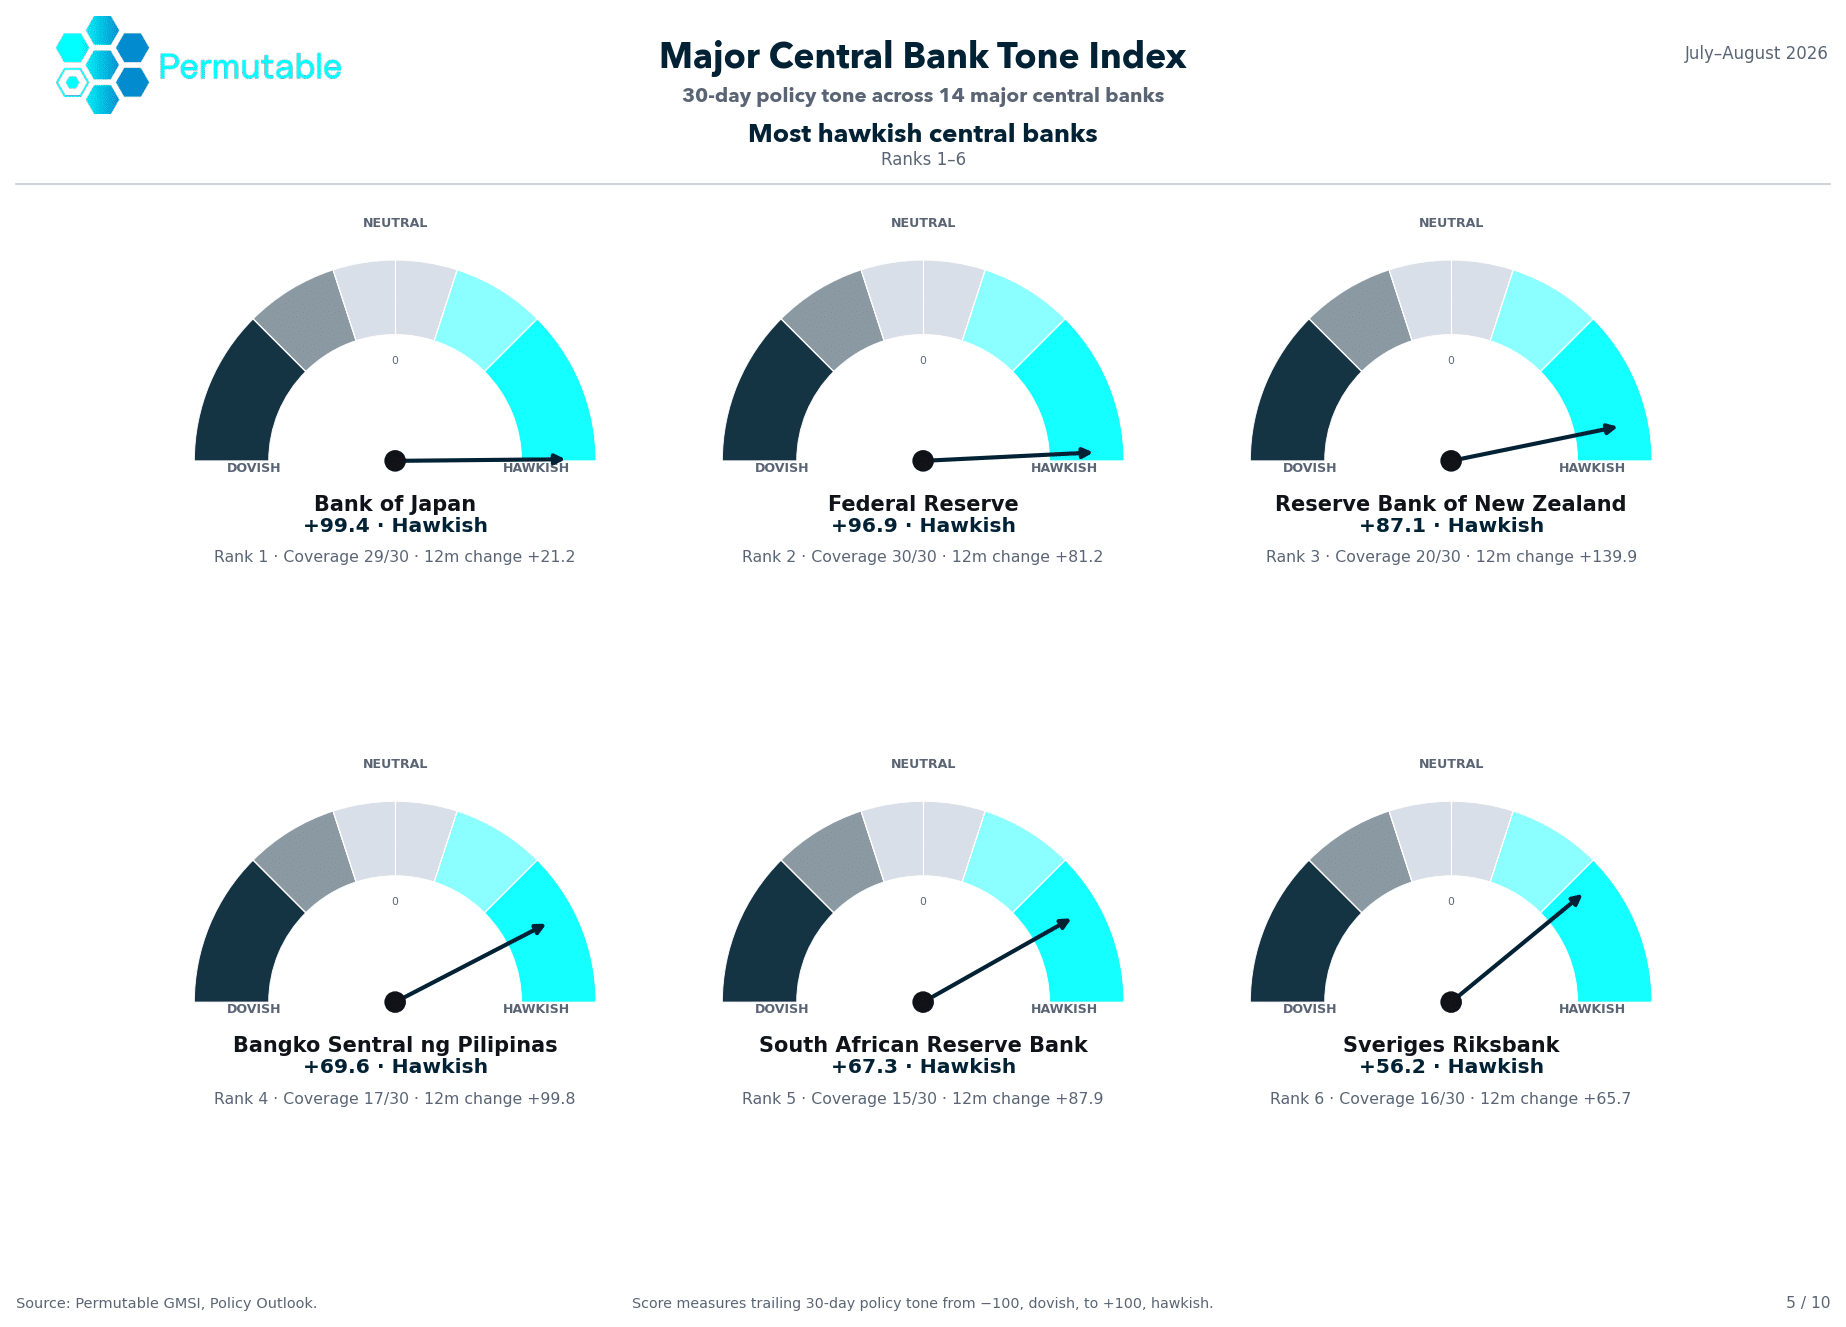
Permutable chart ranking the six most hawkish central banks, led by the Bank of Japan at +99.4, Federal Reserve at +96.9 and Reserve Bank of New Zealand at +87.1, with the Philippines, South Africa and Sweden also in positive territory.
The strongest readings in the central bank policy outlook come from Japan and the United States.
The Bank of Japan scores +99.4 on 29 of 30 qualifying coverage days, the highest reading in the monitor and close to the practical ceiling.
The Bank held its policy rate at 1% on 31 July, voting eight to one, with Hajime Takata pushing for an immediate increase to 1.25%.
Japan’s relatively modest twelve-month sentiment change of +21.2 needs to be viewed in context. Tightening has already dominated the Japanese policy discussion for much of the past year and the Bank has acted on it.
The July hold followed the move to 1% in June, itself the second increase in six months after the December 2025 rise to 0.75%. Japan is therefore different from the Fed and the Bank of England: its policy debate has moved hawkish while actual policy has tightened too.
The currency has also become part of the same policy equation. Japan and the United States are reported to have intervened jointly on 31 July after the yen weakened towards multi-decade lows. Official Japanese intervention data covering that period is not published until 28 August.
Intervention addresses the exchange rate itself but does not remove the interest-rate differential behind it. Renewed yen weakness could raise imported costs and rebuild the domestic tightening case, which is why September has returned to the policy discussion.
The Federal Reserve scores +96.9 on all 30 qualifying days, giving it the deepest evidence base in the monitor alongside Japan’s near-complete coverage.
Its twelve-month change of +81.2 shows how dramatically the policy debate has changed.
The FOMC held its target range at 3.50–3.75% on 29 July, with three dissents in favour of an immediate quarter-point increase. It was a fifth consecutive hold.
Unlike Japan, the Fed has not tightened at any point in the twelve-month window. Its most recent move was in the opposite direction: a quarter-point cut in December 2025, the third of that year.
Twelve months ago, coverage was weighted towards the timing of the next cut, and the Committee duly delivered one. It is now weighted towards whether firm inflation and solid activity warrant an increase.
The unchanged target range therefore conceals a substantial change in the central bank policy outlook, and one that points in the opposite direction to the Fed’s last actual decision.
New Zealand ranks third at +87.1 and records the largest twelve-month move in the monitor at +139.9.
The Reserve Bank of New Zealand took its official cash rate to 2.50% in July, its first increase in over three years, and indicated that some further reduction in monetary stimulus is likely to be required.
That reading rests on 20 qualifying coverage days, at the lower end of what the monitor treats as a robust evidence base, so it carries less depth than the Japanese and US readings above it.
The Philippines, South Africa and Sweden complete the top six on thinner evidence still: 17, 15 and 16 qualifying days respectively.
Sweden’s +56.2 reading, for example, represents the balance of roughly half of the 30-day window. It should therefore not carry the same weight as a reading supported by 29 or 30 qualifying days.
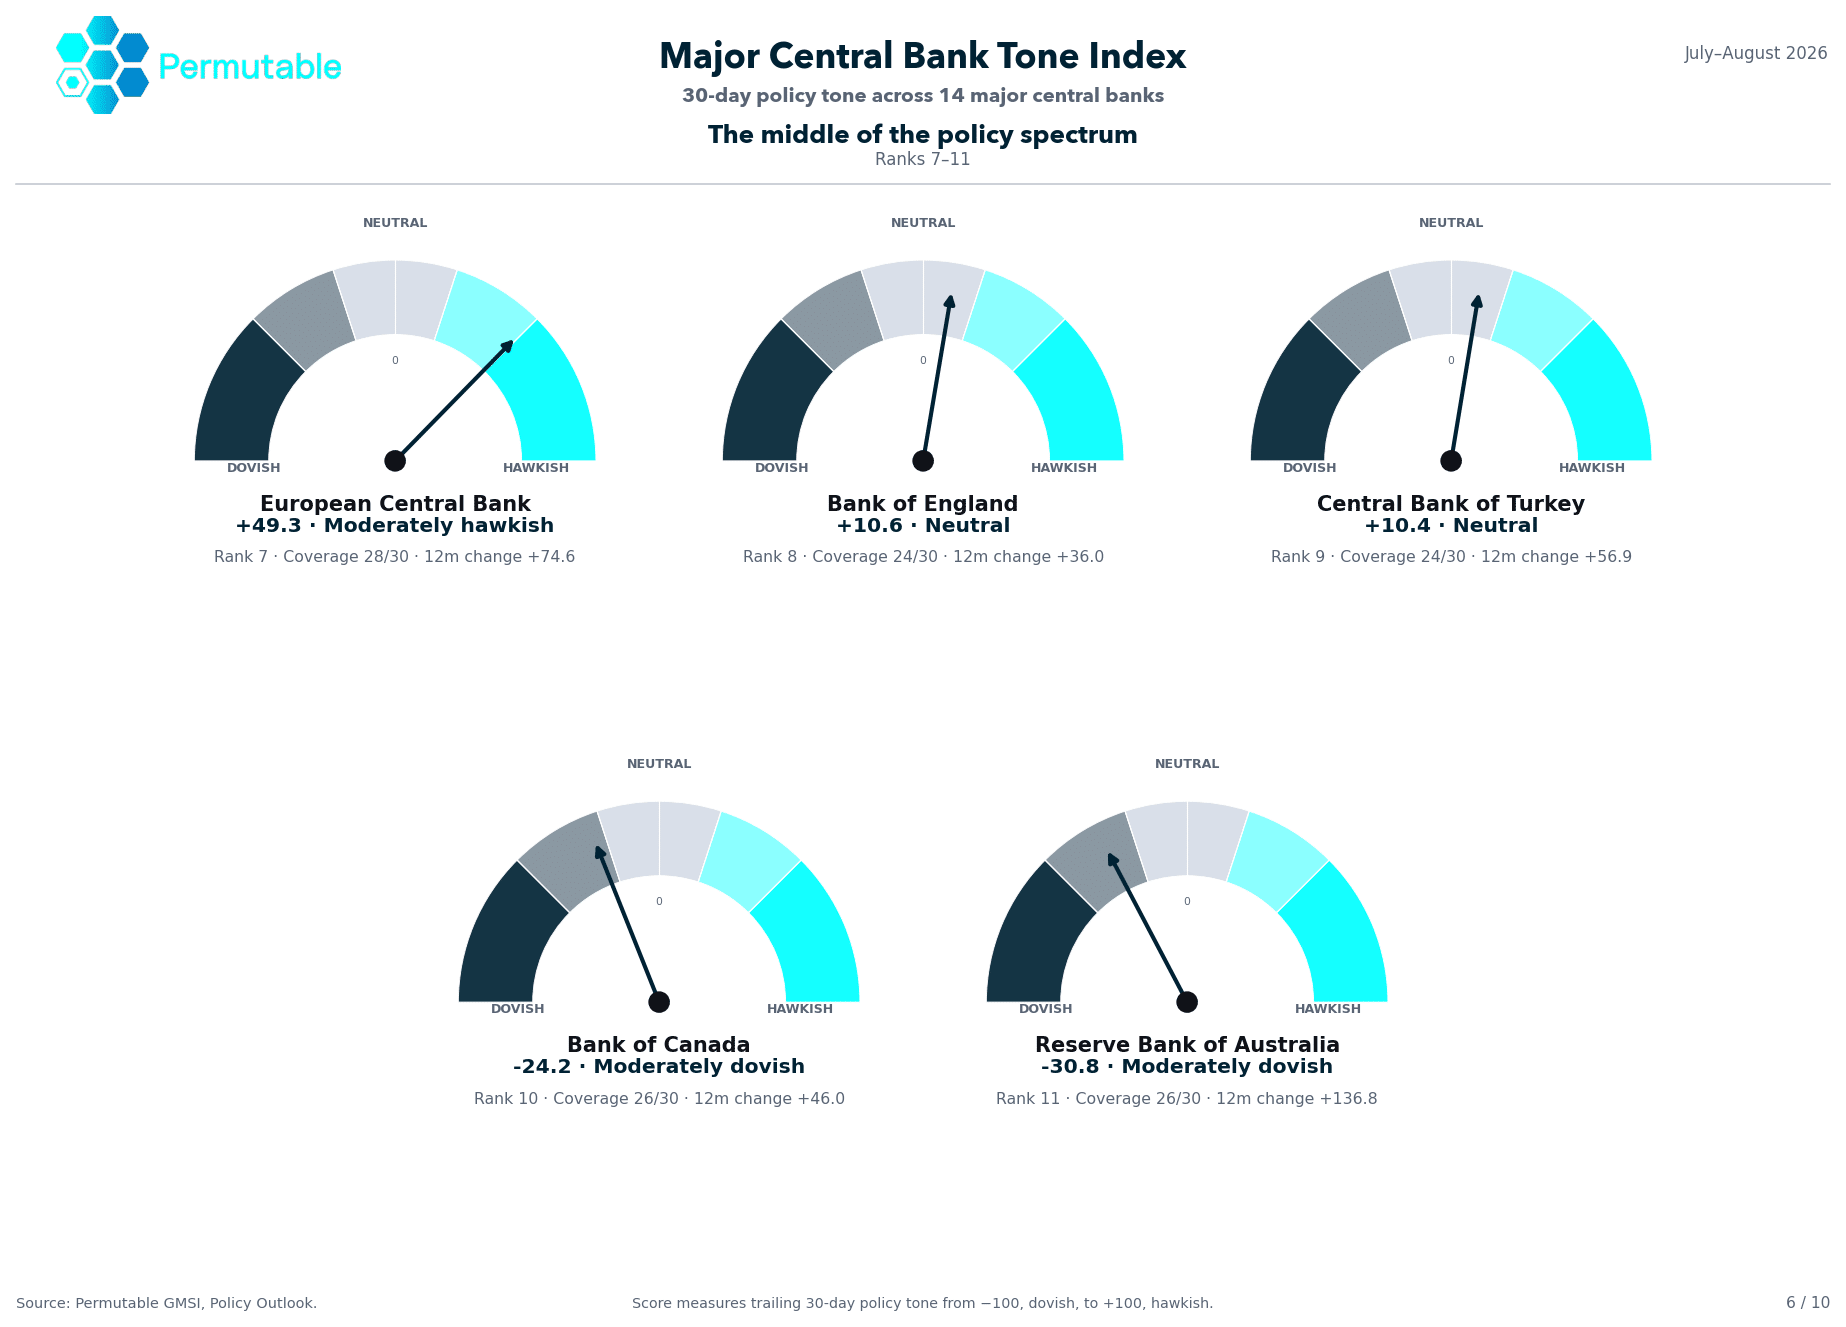
Permutable chart showing the middle of the central bank policy spectrum, with the ECB at +49.3, Bank of England at +10.6, Turkey at +10.4, Canada at −24.2 and Australia at −30.8.
Near-zero readings in the Major Central Bank Sentiment Index should not automatically be interpreted as policy inactivity.
The Bank of England and Turkey sit at +10.6 and +10.4 respectively. In both cases, the near-neutral reading represents a genuine split.
The Bank of England held Bank Rate at 3.75% by six votes to three, with the minority favouring 4%. Underlying disinflation is pulling policy in one direction while energy costs pull in the other.
Its twelve-month change of +36.0 shows which side of that argument has gained ground. As with the Fed, that shift has taken place against a rate that has not moved since the December 2025 cut to 3.75%.
Turkey also sits close to neutral despite a policy rate of 37%, held for a fourth consecutive meeting in July. The central bank continues to emphasise tightness until price stability is secured, while weaker demand has reopened the question of when cuts can begin.
The index measures the path of the policy debate from here, rather than the absolute degree of restriction already in place.
The European Central Bank sits at +49.3, up 74.6 points over twelve months and well ahead of the rest of the middle group.
It is also one of only two central banks in the monitor whose hawkish shift in sentiment has already been matched by policy. The July hold at a 2.25% deposit rate came six weeks after a rise in June, the ECB’s first increase in almost three years and the first by a major Western central bank in this cycle.
The Governing Council said in July that the inflationary impact of the latest energy shock had not fully passed through. The duration of that shock is key.
Energy prices that remain elevated for several quarters can stop behaving like a temporary relative-price adjustment and begin feeding into wages and contracts.
At that point, policymakers have less room simply to look through the shock, potentially shifting the central bank policy outlook further towards the hawkish side.
Canada and Australia illustrate why the current index level and its trajectory need to be read together.
Canada sits at −24.2, but has moved +46.0 points in a hawkish direction over twelve months.
The Bank of Canada held its policy rate at 2.25% on 15 July, a sixth consecutive hold, describing the setting as appropriate for supporting the recovery while inflation returns towards target. Its last move, like the Fed’s and the Bank of England’s, predates the current hold streak that began in December.
Australia is more striking. The Reserve Bank of Australia remains moderately dovish at −30.8, but its twelve-month shift is +136.8, the second largest in the entire monitor.
Headline inflation eased from 4.0% in May to 3.8% in June, reducing some urgency around another increase. Trimmed-mean inflation remained at 3.6%, however, still above the RBA’s band.
Australia therefore remains dovish on the level while having travelled a considerable distance towards the hawkish end.
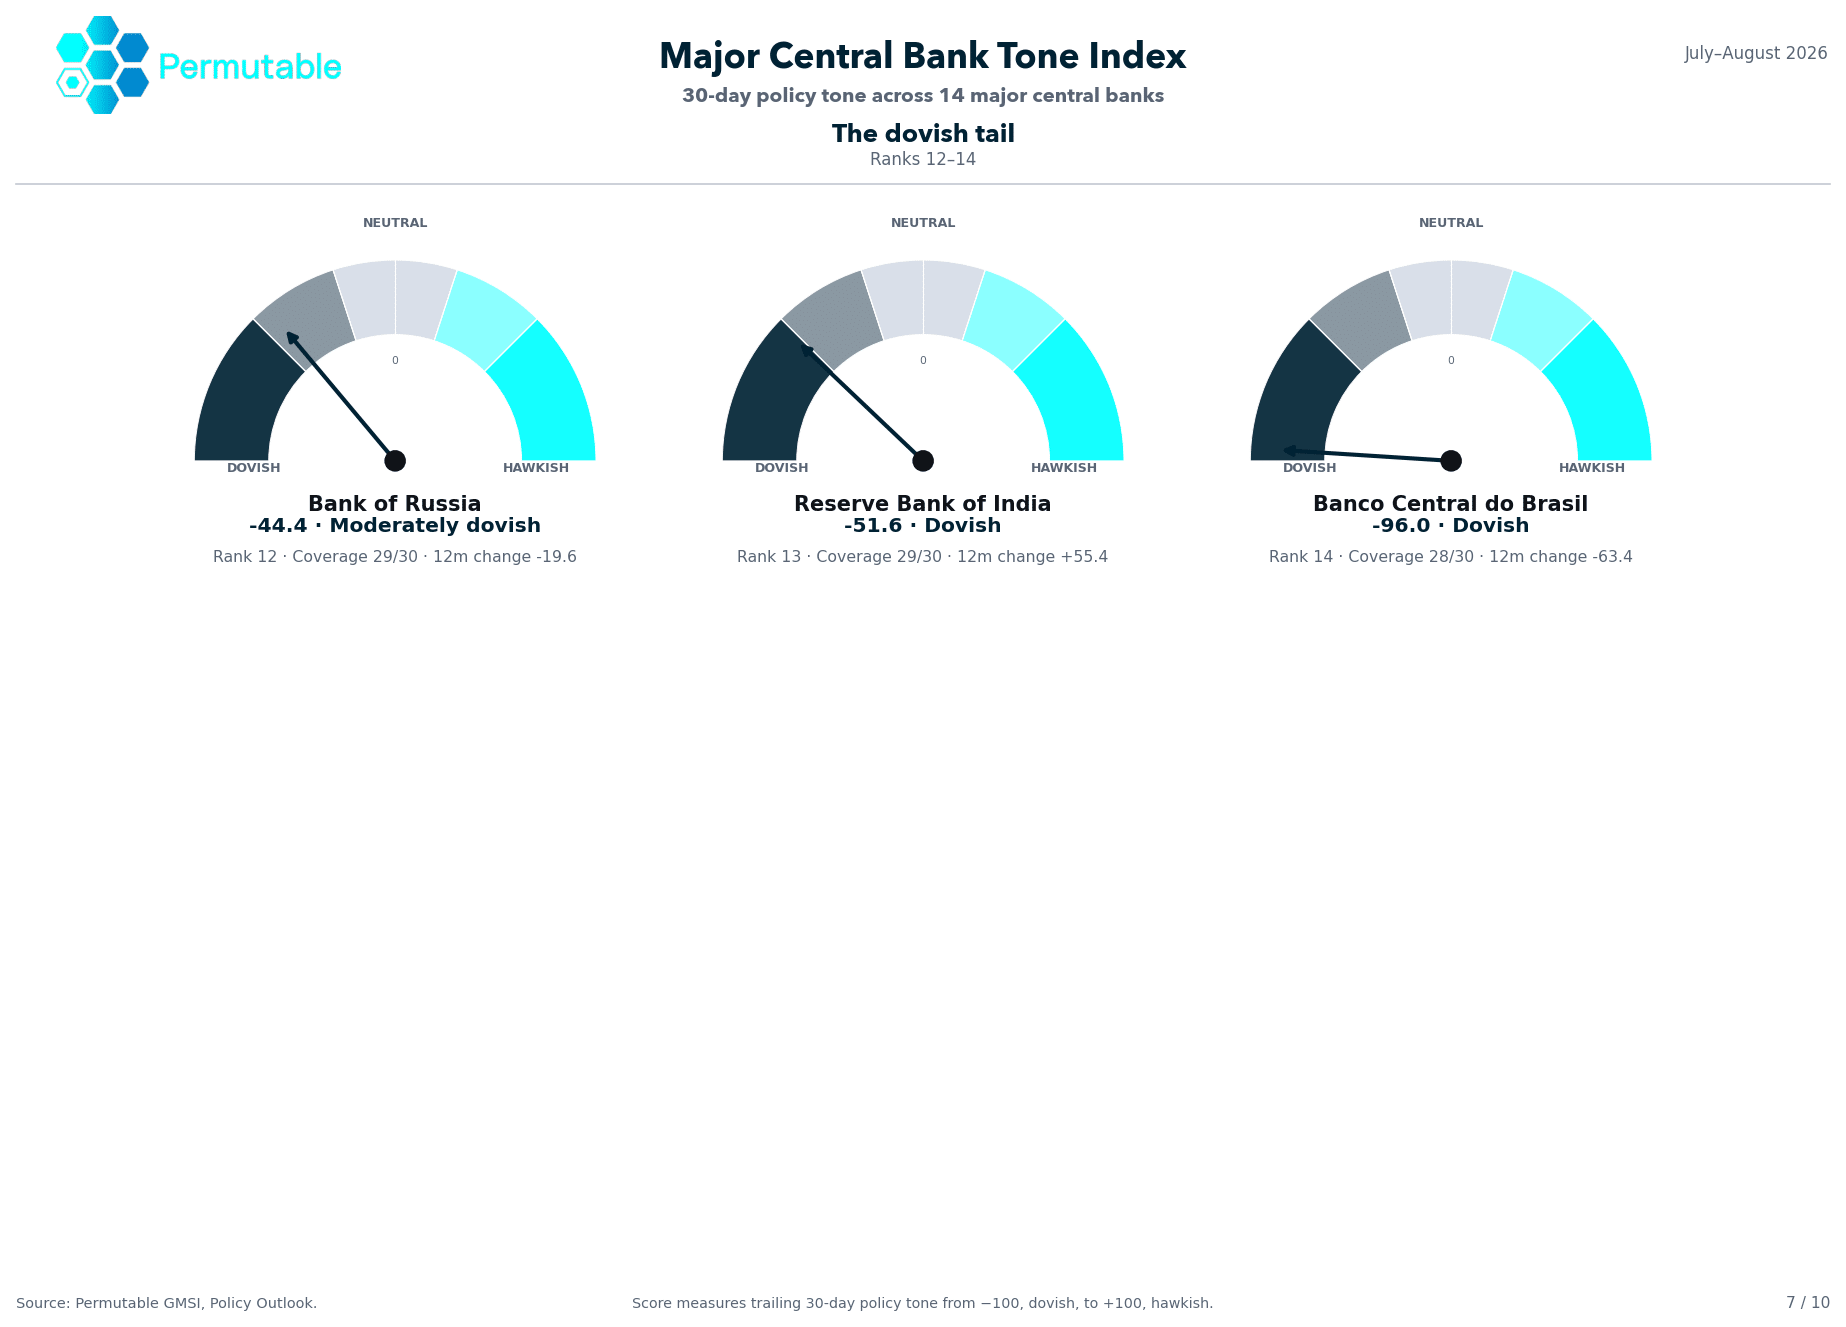
Permutable chart showing the dovish end of the Major Central Bank Sentiment Index, with the Bank of Russia at −44.4, Reserve Bank of India at −51.6 and Banco Central do Brasil at −96.0 over the 30 days to 6 August 2026.
India is the clearest example of a dovish current reading masking a more hawkish longer-term move.
The Reserve Bank of India sits at −51.6, with a twelve-month change of +55.4.
That is the widest gap anywhere in the monitor between the current level and the direction of travel.
The RBI held its repo rate at 5.25%, maintained a neutral stance and lowered its full-year inflation projection, assessing much of the recent inflation pressure as food- and fuel-related.
This pushes the immediate tightening question further out without changing the formal policy stance.
India is not signalling an imminent hike. The significance lies in how far policy-outlook sentiment has moved relative to where it stood twelve months ago.
Banco Central do Brasil remains the strongest dovish signal in the monitor at −96.0.
Copom cut the Selic rate to 14% on 5 August as inflation and activity softened.
The communication nevertheless remained cautious. Inflation expectations are still above target, the labour market remains firm and fiscal risk continues to feature in the assessment.
None of those qualifications has yet materially altered the easing story.
Brazil is also one of only two central banks whose policy-outlook sentiment has moved more dovish over twelve months. The other is Russia.
The Bank of Russia scores −44.4, down 19.6 over the year, after cutting its policy rate by 25 basis points to 14%. It simultaneously lifted its 2026 inflation forecast to 6–7% and highlighted rising inflation expectations, suggesting a potentially slower pace of subsequent easing.
Three conclusions emerge from the complete cross-section.
At the hawkish edge, Japan and the United States are being covered almost entirely through the question of the next hike, supported by the two deepest evidence bases in the monitor.
Across the contested middle, near-neutral readings contain some of the most active policy debates, particularly where energy costs are competing with softer demand and cooling labour markets.
And across the complete ranking, 12 of 14 twelve-month changes point towards the hawkish end, while only two of the fourteen have so far translated that shift into a rate increase.
The distribution has widened, but it has widened while the cross-section as a whole has also shifted more hawkish.
Three channels have the potential to shift several central banks simultaneously.
Japan’s reading is already pinned at +99.4, leaving almost no room for the headline score itself to register further hawkish pressure.
That makes the depth and persistence of the underlying coverage increasingly important.
If the yen weakens again, imported costs could feed into domestic prices and make September the first meeting forced to deal directly with renewed inflation pressure.
The key variable is not intervention alone, but the rate differential that produced the currency move.
The ECB has already said that the latest energy shock has not fully passed through, and has already raised once in response to it.
Canada, Australia and the UK also sit in the middle of the distribution, where softer demand is competing with energy-related inflation pressure.
A shock that persists for several quarters could move several central banks together.
For rates portfolios, a correlated move across the middle of the distribution may prove more consequential than one further hawkish surprise from a central bank already at the top.
India sits at −51.6 despite a +55.4 twelve-month shift. Australia has the same broad shape, with a +136.8 shift sitting behind a current dovish reading.
Neither is necessarily close to hiking.
But the dovish end of the distribution is thinner than the ranking alone suggests, leaving Brazil increasingly isolated at the extreme.
Permutable’s Major Central Bank Sentiment Index measures directional policy-outlook sentiment over a trailing 30 days for 14 major central banks.
Scores range from −100 to +100:
The window in this report ends on 6 August 2026.
Each observation is point-in-time. A historical score reflects only information available on that date, with no subsequent revision, allowing the series to be replayed systematically in a backtest.
Coverage days record how many of the 30 days contained qualifying policy coverage.
Readings based on fewer than 20 days should be treated more cautiously. In this window, those are:
New Zealand sits at the threshold with 20 days.
The twelve-month change compares the current score with the same trailing measure one year earlier.
The index measures the balance of the policy debate. It is not a probability attached to the next policy decision and is not a forecast of the policy rate.
Permutable’s Global Macro Sentiment Indices convert global information into hourly, point-in-time macro sentiment signals across more than 95 economies and 70 macro topics.
Every observation is historically preserved and traceable to its underlying drivers, supporting live monitoring and systematic replay from the same record.
A macro, rates or FX research desk can therefore test whether a turn in policy sentiment appeared before the vote that confirmed it, how broadly the change spread across the central-bank cross-section, and where it subsequently appeared in rates and currencies.
Access the complete five-page analysis of 14 major central banks, including the Major Central Bank Sentiment Index rankings, directional policy-outlook sentiment, twelve-month changes, coverage depth and implications for rates and currencies.
30 Sep 2026
The Hawkish Turn: G10 Central Bank Policy Outlook into Q4 2026
Read more >
Guide
30 Sep 2026
The complete guide to early macro regime sentiment signals for hedge funds and institutional investors
Read more >
Analysis
23 Sep 2026
How does the 2026 energy shock reach 2027? From shipping routes to policy rates
Read more >