US growth and policy outlook Q2 2026: Q2 bought the Fed time. July may take it back
30 Jul 2026
30 Jul 2026
The second quarter began with conflict in the Gulf and disruption through the Strait of Hormuz. It ended under the floodlights of the World Cup. On 29 July, the Federal Reserve held rates at 3.50-3.75%, with three members dissenting in favour of a quarter-point rise, the first estimate of Q2 GDP followed the next morning. In between, crude’s geopolitical premium ebbed, rebuilt and repeatedly changed the inflation picture. Official data fixed the quarter after the event. GMSI tracked the shifts while they were still unfolding.
On the morning of the decision, the Committee had a June CPI report that captured energy prices near their local trough and a quarterly PCE measure that compressed several turns in oil into a single number. The advance GDP estimate was still a day away. The Fed was judging a moving economy through data that had already begun to age.
That is not a defect in official statistics, it is the price of measurement. They settle the record after the period has closed, while policy is made before that record is complete. For a macro desk, the question is what can fill the interval without sacrificing accountability.
Read that morning, the three charts described a consistent position. Expenditure sentiment sat above its historical baseline, private demand was not cracking. Energy inflation had turned up again, to roughly +1.1 standard deviations. Core goods and services stood below its baseline sentiment level, so the wider basket had yet to follow. Policy sentiment had fallen from an extraordinary late-June peak of nearly +3 to below +1, leaving the hawkish argument narrower than it had been a month earlier but still standing. A hold with three dissents is a reasonable reading of that configuration.
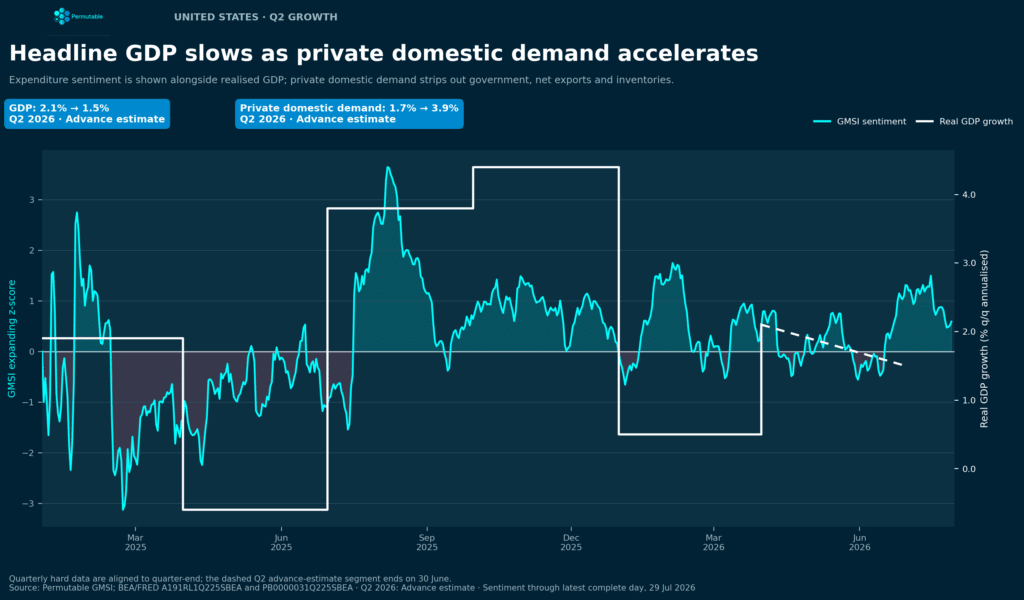
Real GDP grew at an annualised 1.5%, down from 2.1% and below consensus. The composition is worth more than the total. Real final sales to private domestic purchasers, which strip out government spending, inventories and net exports, accelerated from 1.7% to 3.9%. That is the series to watch when asking whether restrictive rates have begun to restrain the private demand most exposed to monetary policy, and it suggests they have not.
Households spent, and fixed investment held firm on equipment, software and computing capacity. The expansion leaned on a narrow group of capital-intensive industries. The drag on the headline came from government expenditure, inventories and the external accounts, which subtract from measured output while carrying a different policy message from cancelled capital plans or retrenching consumers.
The US growth Chart shows expenditure sentiment recovering through the back half of the quarter and holding above baseline into late July. It never described an economy shifting up a gear, and never one heading for contraction. Two quarters can print the same headline and mean opposite things, and the signal was pointing at the composition well before the advance estimate confirmed it.
This leaves the Fed uncomfortable in both directions. Private demand near 4% is difficult to reconcile with an economy that needs to find ways to spur output in other areas, while a 1.5% headline, fading industrial momentum and a concentrated capital cycle provide little justification for raising rates simply because activity remains resilient. On their own the national accounts justify waiting. They say much less about the second question, which is whether July’s energy move remains a relative-price shock or begins to spread.
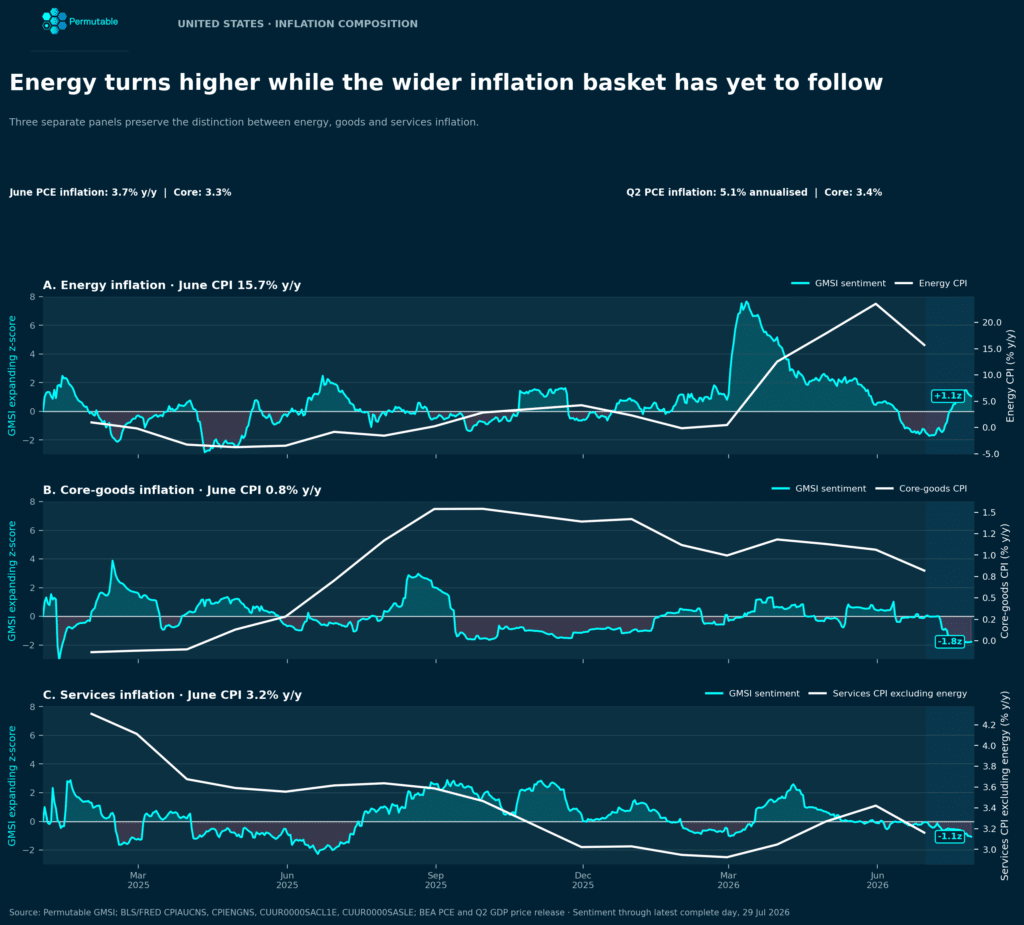
The energy panel is the record of a quarter that would not settle. The risk premium in energy built as the Gulf conflict threatened the strait, drained away as shipping kept moving and the diplomacy held, and rebuilt through July as tension between Washington and Tehran returned. Each phase was long enough to look like a trend and too short to be one.
June’s CPI caught the trough. Consumer prices fell over the month as energy retreated, and that report offered policymakers evidence of relief just as the series had begun to turn back. By the latest complete observation energy sentiment sits above +1 standard deviation again.
The wider inflation basket has not moved with it. Core-goods sentiment ended near -1.8 and services near -1.1, and the hard data are consistent with that: energy CPI ran at 15.7% year on year in June, against core goods at 0.8% and services at 3.2%. The PCE figures show the same shape, with Q2 headline inflation of 5.1% annualised against a core rate of 3.4%. Core excludes food and energy by construction, and much of that gap reflects energy.
The divergence matters because the Fed does not set policy against crude. An energy shock lifts the headline, squeezes real incomes and unsettles expectations. It becomes a monetary problem when it starts setting the price of things that are not oil. The route is well documented, as fuel and freight reach manufactured goods through transport and imported inputs, and services follow later through airfares, repairs, insurance and hospitality. How much survives the journey depends on contracts, margins, and whether firms expect customers to absorb the pass through of increased costs.
The strength of private demand makes that last condition more likely to bind. A shock arriving into a weak consumer tends to compress margins rather than final prices. When private domestic demand is growing near 4%, firms have more scope to pass the shock on. There is no sign in the panels that they have, and goods and services sentiment may show whether the pressure is broadening before that pass-through becomes visible in the official data.
The first links have turned and the rest have not, which makes the current episode a warning rather than a case for higher rates. September becomes considerably harder to see past a hike if all indicators begin to converge together.
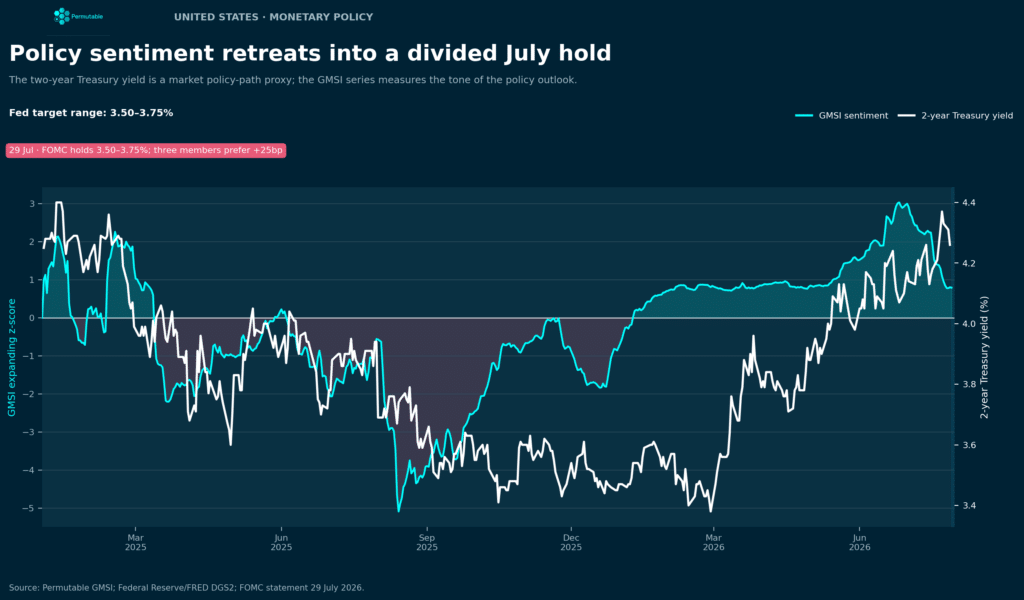
The unchanged range of 3.50-3.75% masks an unusually divided hold, with three members preferring a quarter-point increase. The split reflects the tensions in the other two charts. Growth slowed while private demand strengthened, the headline eased while energy risk returned, and the labour market cooled without deteriorating enough to argue for cuts.
The policy outlook chart tracks how that argument developed. Policy-outlook sentiment climbed through the spring and surged to almost +3 standard deviations in late June, when expensive oil, firm demand and persistent inflation made another increase a central part of the policy debate. The impulse faded before the meeting, and by the latest observation the series had fallen below +1. The two-year Treasury yield stayed elevated throughout.
That difference needs handling with care. Nothing here establishes that sentiment leads the rates market, and the chart is not offered as evidence that it does. It shows that the breadth and volume of the tightening argument declined without a matching move in pricing, which is a positioning question rather than a forecasting one.
In June the hawkish case rested on several arguments at once. By late July it rested largely on one: that a renewed energy shock would eventually reach underlying prices while spending held up. The dissents confirm that another increase is no longer hypothetical, and the retreat in sentiment indicates that the evidence for acting immediately had narrowed. September stays live, with the burden falling on incoming inflation data.
Official statistics settle what happened, and nothing replaces them. GDP fixes the rate and composition of growth, CPI and PCE fix the prices people paid, and the statement fixes the policy delivered. They also arrive after the period has closed and describe it as though it had a single character, which the second quarter did not.
Sentiment addresses the interval those releases leave behind. It is point-in-time, so the June 2025 reading on the chart is the reading a desk saw in June 2025 rather than a restatement, which is the minimum condition for a backtest to mean anything. It is normalised against expanding history, so today’s level is comparable with one from eleven years ago. And it separates by topic, which is why energy, core goods and services can be read against each other rather than averaged into a single index that would have shown little this month.
In this episode that produced three use cases. The energy panel dated the last official inflation print and indicated how much of June’s relief had already expired in July. The goods and services panels gave the question of second-round effects a level and a direction. The policy panel measured the argument surrounding the rates market ahead of a divided decision.
None of this forecasts the next decimal of GDP or claims priority over the yield curve. The real value is within tracking the macro landscape in real time, between the releases. A desk still has to judge how the underlying picture is changing, and it is better to make that judgement with evidence that is point in time, measured and open to testing.
The Fed can wait while those signals remain separated. Its room narrows if they begin to converge: firm private demand, persistent energy pressure, broader inflation sentiment and a renewed hawkish turn in the policy outlook.
The second quarter has closed, but its policy argument has not. The advance estimate provided the first account of growth. The next decision will depend on whether July’s energy shock remains confined to the headline or begins to alter the economy underneath it.

Analysis
09 Sep 2026
US sovereign risk, the dollar and an unprecedented 2025 signal
Read more >
Guide
14 Aug 2026
Measuring narrative momentum across global markets: A guide for institutional investors
Read more >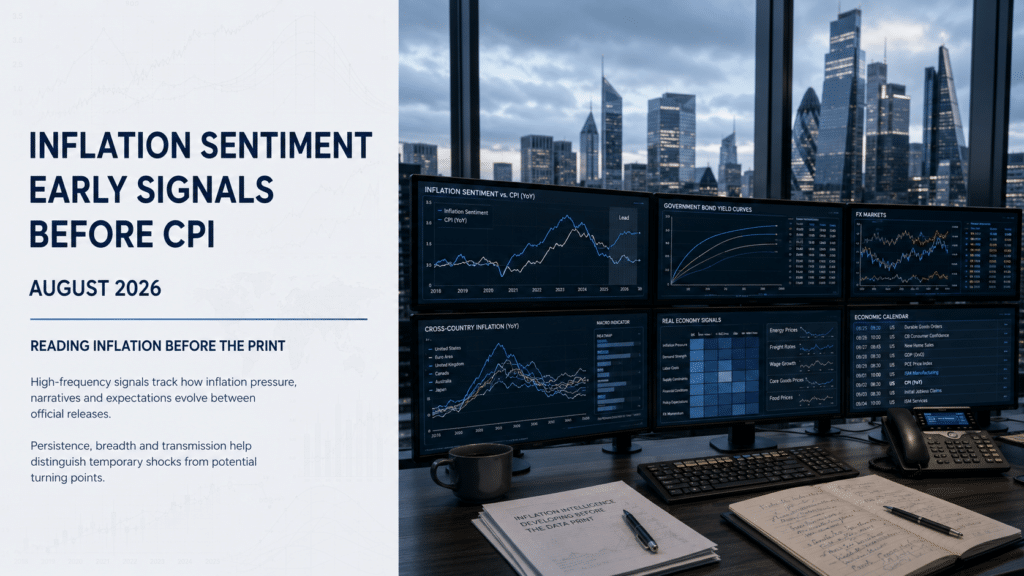
Analysis
13 Aug 2026
Inflation Sentiment Index: identifying early inflation signals before CPI
Read more >