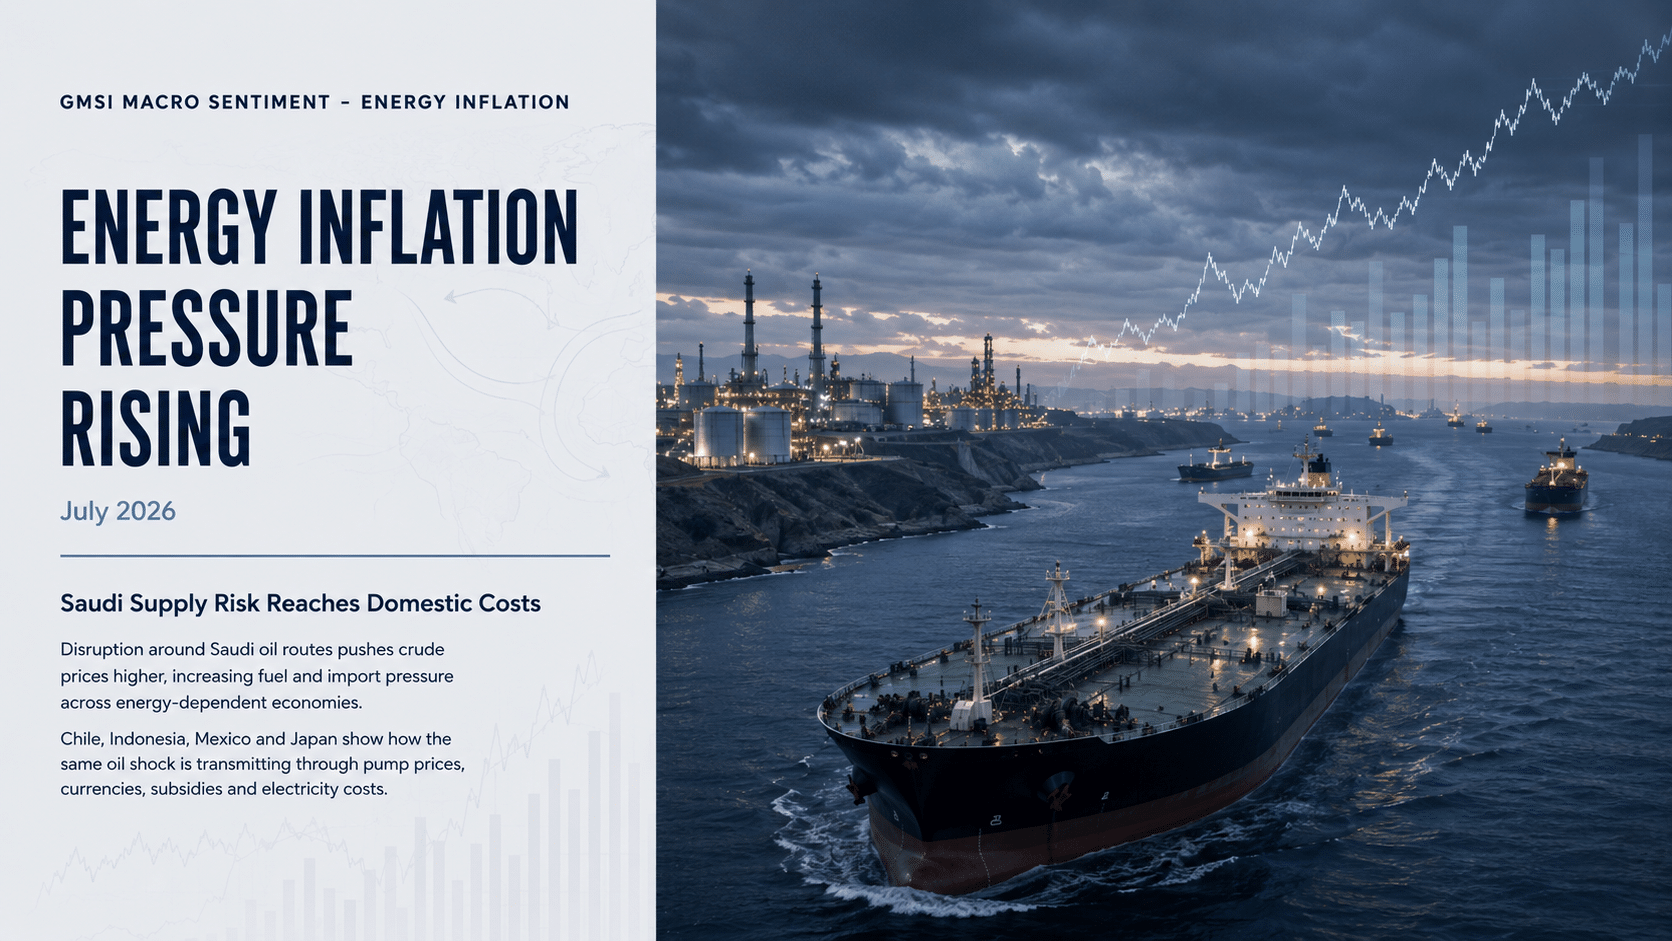
Saudi supply risk and import costs drive energy inflation sentiment higher
27 Jul 2026
27 Jul 2026
This analysis powered by Permutable’s Global Macro Sentiment Indices examines where energy inflation pressure is intensifying as oil disruption, currency weakness and higher import costs move into domestic economies. It compares Saudi Arabia, Chile, Indonesia, Mexico and Japan, while explaining why no confirmed declines were published. It is aimed at investors, economists, policymakers, risk teams and commodity or macro strategists tracking inflation transmission across markets.
Energy inflation sentiment rose most sharply in Saudi Arabia, Chile and Indonesia as disruption around Saudi oil routes pushed crude prices higher and began feeding into fuel, import and fiscal pressures elsewhere. Mexico and Japan completed the five confirmed rises. No country passed the full evidence test for a weekly fall: although several numerical averages declined, their dominant headlines continued to describe rising energy costs.
Permutable’s latest Global Macro Sentiment Indices rankings capture the point at which higher oil prices began to move beyond global commodity markets and into country-level inflation concerns.
Saudi Arabia recorded the largest weekly increase. The signal was driven by threats to Red Sea ports, attacks on Saudi-linked tankers and the risk that shipping disruption could constrain global supply. This is primarily a Saudi-associated oil-market signal rather than evidence of an equivalent increase in Saudi household energy prices.
The transmission was more direct elsewhere. Chilean coverage moved towards imminent increases in petrol and diesel prices. In Japan, higher crude prices and a weak yen lifted the import bill and electricity costs. Indonesia’s signal strengthened through the fiscal cost of more expensive oil and the effect of higher non-subsidised fuel prices. Mexican headlines increasingly connected stronger oil benchmarks with domestic petrol costs.
The common driver was the same, but the mechanism differed: physical supply risk in Saudi Arabia, pump-price pass-through in Chile and Mexico, import-cost inflation in Japan, and subsidy and budget pressure in Indonesia.
The rankings compare 20–26 July 2026 with 13–19 July 2026 using the canonical GMSI topic Economic Data-Inflation–Energy.
A rise means that average directional sentiment per matched headline moved towards stronger energy-price pressure. This may include higher oil, gas, electricity or fuel prices, as well as evidence that those costs are passing into consumer inflation, imports, public finances or business expenses.
A fall requires headline evidence of moderating energy prices or weaker inflation pass-through. A lower numerical average is not sufficient when the dominant stories still describe rising costs.
Domestic and international coverage are combined. Sentiment is divided by matched headline count in each seven-day period so countries with larger news volumes do not dominate the comparison.
For energy exporters, the signal may reflect supply disruption and international price pressure associated with the country rather than domestic consumer-price inflation alone.
| Rank | Country | 13–19 July | 20–26 July | Weekly change |
| 1 | Saudi Arabia | −0.004 | +0.609 | +0.613 |
| 2 | Chile | −0.016 | +0.268 | +0.284 |
| 3 | Indonesia | −0.108 | +0.104 | +0.211 |
| 4 | Mexico | +0.150 | +0.277 | +0.127 |
| 5 | Japan | +0.310 | +0.423 | +0.114 |
Average directional sentiment per matched headline. A higher value indicates stronger energy inflation pressure.
Saudi Arabia’s signal moved from broadly balanced to strongly inflationary as the threat to regional oil infrastructure became more concrete. The focus shifted from general Middle East tension towards port disruption, tanker attacks and the possibility of a sustained premium in global oil prices.
The ranking reflects Saudi Arabia’s central position in the global oil-supply system. The immediate inflation mechanism runs through international crude and transport costs, with the effects then transmitted to energy-importing economies.
Chile’s energy inflation signal turned decisively higher as global oil gains began to feed into expectations for domestic petrol and diesel prices. Coverage moved from earlier reports of relatively low fuel costs towards specific warnings of increases from the end of July.
Chile’s move is one of the clearest cases of external energy pressure approaching domestic inflation. The mechanism operates through both the oil benchmark and the exchange rate.
Indonesia moved from negative to positive energy inflation sentiment as the discussion shifted towards the budgetary and consumer consequences of higher oil prices. The strongest stories focused less on the commodity price itself than on who would absorb the increase.
Indonesia’s signal is therefore not limited to headline inflation. The pressure is being transmitted through subsidies, government spending choices and the relative cost of conventional transport.
Mexico’s energy inflation signal strengthened as higher crude benchmarks were joined by reports of rising domestic petrol prices. As an oil producer and fuel consumer, Mexico experiences the shock through both export revenues and household costs.
The Mexican story is not simply that the country benefits from expensive oil. The downstream effect depends on refining capacity, fuel imports and the extent to which retail prices are absorbed by government, producers or consumers.
Japan’s already elevated energy inflation signal rose further as higher crude prices combined with currency weakness. The country’s dependence on imported energy makes this one of the most direct transmission channels in the ranking.
Japan’s ranking illustrates the interaction between commodities and foreign exchange. Even where the global oil move is shared, a weaker currency can materially increase the inflationary effect.
No country passed the full evidence test for a confirmed decline in energy inflation sentiment this week.
The five largest numerical falls were:
| Numerical rank | Country | 13–19 July | 20–26 July | Weekly change | Evidence verdict |
| 1 | United Kingdom | +0.461 | −0.071 | −0.532 | Excluded |
| 2 | Canada | +0.368 | +0.004 | −0.364 | Excluded |
| 3 | France | +0.470 | +0.165 | −0.304 | Excluded |
| 4 | Hungary | +0.385 | +0.175 | −0.210 | Excluded |
| 5 | South Africa | +0.179 | +0.006 | −0.173 | Excluded |
These countries are not treated as confirmed falls because their dominant high-impact headlines continued to point towards stronger energy-price pressure:
The numerical declines may reflect changes in the wider distribution of matched headlines, but they do not provide sufficiently coherent evidence of easing energy inflation pressure. They are therefore excluded from the confirmed ranking.
The energy inflation story became more geographically specific. During the preceding week, much of the coverage centred on the general rise in oil prices following escalating Middle East tensions. Between 20 and 26 July, that broad shock developed into a series of more defined transmission channels.
Saudi Arabia became the centre of the global supply-risk story as attacks on tankers and threats to Red Sea ports raised concerns about physical delivery. Chilean and Mexican coverage moved closer to the consumer, with specific reports of petrol-price increases. Japan’s import data showed how higher oil and a weaker currency were combining to raise the domestic cost of energy. In Indonesia, the shock appeared through the public finances and the cost of maintaining fuel support.
The absence of confirmed falls is equally important. Some country averages declined, but the underlying news flow remained dominated by higher oil, gas, fuel and electricity prices. This was therefore not a week in which energy inflation pressure split evenly between countries. The strongest evidence continued to point in one direction, even where the numerical intensity of the signal softened.
The result is a ranking led by countries closest to one of three mechanisms: disruption to oil supply, reliance on imported energy, or direct pass-through into fuel prices and public finances.
This edition covers the canonical GMSI topic Economic Data–Inflation–Energy, which includes oil, gas, electricity and fuel-price inflation, together with their economic and consumer-price pass-through.
The latest observation period is 20–26 July 2026, compared with 13–19 July 2026. The analysis uses:
The ranking is based on weekly change rather than the absolute level of energy inflation sentiment.
Countries are included only when:
Where a numerical fall is not supported by the underlying headline mix, the country is excluded rather than used to fill the ranking mechanically.

Guide
14 Aug 2026
Measuring narrative momentum across global markets: A guide for institutional investors
Read more >
Analysis
13 Aug 2026
Inflation Sentiment Index: identifying early inflation signals before CPI
Read more >
Analysis
11 Aug 2026
RBA interest rate outlook: A hawkish hold as inflation pressure fades
Read more >