Quantifying geopolitical and country risk in energy markets with market sentiment data
15 Sep 2025
15 Sep 2025
Energy markets are uniquely exposed to politics. Unlike equities or bonds, where fundamentals drive pricing, commodities such as oil, gas, and metals are deeply intertwined with state policies, international diplomacy, and conflict dynamics. From OPEC production quotas to sanctions regimes and wars disrupting supply chains, the effects of geopolitical and country risk ripple through energy markets with immediate force.
For traders, portfolio managers, and risk professionals, the challenge has always been quantifying this uncertainty. Historically, geopolitical risk in energy markets has been viewed as qualitative – understood through analysis and intuition, but difficult to measure or model systematically.
This article explores how our Political Tension Index (PTI) and War Sentiment Index provide objective, real-time measures of political and conflict risk, transforming how energy market participants monitor, price, and manage exposure. It is aimed at traders, analysts, portfolio managers, and corporate strategists who need sharper tools to navigate political instability.
Energy is one of the most geopolitically sensitive asset classes. Supply chains are concentrated in unstable regions, making them vulnerable to political disruption:
Oil: More than 40% of global crude oil exports and more than 20% of oil product exports come from countries located in the broader Middle East.
Gas: Reliance on Russian pipelines and LNG demonstrates exposure to geopolitical and country risk.
Metals: Critical minerals like copper, cobalt, and lithium are at the centre of debates on resource nationalism and trade wars.
The result is persistent energy market volatility, where political events translate into price action with little lag.
Political risk ratings and reports have long existed, but they fail in fast-moving energy markets because they are:
Lagging: Updated quarterly or annually, missing sudden escalations.
Subjective: Driven by expert opinion rather than systematic data.
Too broad: Offering generalised “risk scores” without actionable granularity.
At Permutable, we have developed two complementary measures to quantify geopolitical and country risk:
Our Political Tension Index tracks political stress and instability through real-time sentiment analysis of global news, policy updates, and commentary. It detects shifts in tone and language that precede escalation, giving traders foresight into potential disruptions in energy supply or market sentiment.
Our War Sentiment Index goes a step further, specifically measuring conflict sentiment. It quantifies the intensity and likelihood of military actions, invasions, or escalations into warlike scenarios. By systematically analysing references to armed conflict, troop movements, and military rhetoric, the War Index provides early warning signals of risks that can severely impact oil, gas, and metals.
Together, these indexes provide a layered view:
The PTI captures political instability and tensions short of conflict.
The War Index captures conflict escalation and its potential economic consequences.
When tensions rise in the Middle East, the PTI detects political instability while the War Index highlights the likelihood of escalation into conflict. Combined, they help traders position around crude price spikes or drops.
During the Russia-Ukraine conflict, the War Index provided quantifiable signals on escalation risk, while the PTI tracked diplomatic sentiment. Together, they gave portfolio managers tools to adjust hedging strategies.
Mining regions in Africa and Latin America are not just politically unstable but sometimes prone to armed insurgencies. The PTI measures political stress; the War Index measures armed threat levels, giving metals traders a fuller picture of supply risks.
For systematic funds, integrating PTI and War Index data enables models that factor in both political instability and outright conflict risk – turning sentiment into measurable trading signals.

Traders: Position ahead of both political and conflict-driven volatility by using our leading energy sentiment indicators
Risk managers: Add quantitative depth to frameworks previously reliant on judgement.
Portfolio managers: Build resilience by integrating geopolitical and country risk across multiple layers of exposure.
Corporates: Monitor both political tensions and conflict risks threatening supply chains.

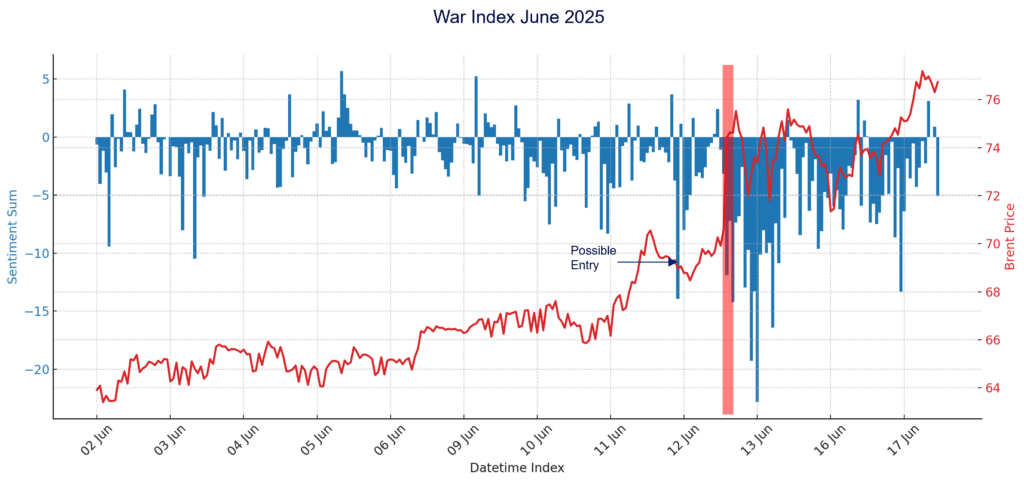
The chart below illustrates our crude oil index, where narrative flows around geopolitical tensions aligned closely with subsequent price moves. In this case, the narrative data acted as a leading indicator, surfacing signals hours to days ahead of observable price shifts. For systematic traders, this kind of relationship provides fertile ground for backtesting and model integration. By incorporating narrative indices, a trading desk can enhance its ability to detect structural drivers and dynamics before they manifest fully in market prices.
With the energy transition, risks are evolving. Nations are competing for control over green mineral supply chains, while traditional oil and gas exporters navigate shifting global demand. The likelihood of conflict over scarce resources is rising.
The ability to measure both political tensions (via the PTI) and conflict sentiment (via the War Index) presents a competitive advantage. Together, these indexes provide clarity where markets have historically relied on guesswork. By integrating sentiment-driven political and conflict risk signals, traders, risk managers, and corporates can better anticipate disruptions, protect portfolios, and capitalise on opportunities.
Discover how our Political Tension Index and War Index can help you quantify and manage geopolitical and country risk across global energy markets. For institutional clients, email enquiries@permtuable.ai to request a demo.
A: Our Political Tension Index (PTI) measures political instability and stress in real time, while the War Index specifically tracks sentiment around armed conflict and military escalation. Together, they provide a layered view of geopolitical and country risk.
A: The War Index quantifies conflict risk – such as invasions, troop movements, or military threats – which can severely disrupt oil, gas, and metals supply chains. Traders can use it to anticipate price spikes linked to armed escalation.
A: Yes. While energy markets are highly exposed, PTI and War Index signals also support trading and risk management in equities, sovereign debt, and emerging markets.
A: Both indexes run continuously, capturing real-time sentiment shifts from global and local sources, ensuring traders are never working with stale information.
A: Energy traders, commodity portfolio managers, systematic funds, risk managers, and corporates with supply chain exposure all gain value from integrating PTI and War Index signals.
Yes – procurement, supply-chain continuity, location risk screening, and scenario planning.
A: They don’t predict specific outcomes, but they provide quantifiable signals of escalation risk – allowing market participants to prepare and hedge before volatility fully materialises.
It’s the market impact from political instability, sanctions, policy shocks, and conflict that impair energy supply, demand, logistics, or pricing.
It quantifies conflict-related sentiment, highlighting escalation risk that can trigger sharp moves in oil, gas, and metals.
Yes – real-time ingestion and scoring mean shifts are surfaced faster than traditional reports or quarterly ratings.
Crude oil and refined products, European natural gas/LNG, and critical minerals such as copper, lithium, and cobalt.
By flagging risk build-ups earlier, it supports proactive hedging and position sizing that can mitigate drawdowns.
As time-series features alongside fundamentals and technicals – e.g., signal overlays, regime filters, or risk parity inputs.
Yes – multilingual coverage and local sources improve visibility where official data are sparse or delayed.
Country screening, board-level risk reporting, sanctions watch, supplier due diligence, and insurance pricing support.
Analysis
15 Jul 2026
The Price of Passage: How Geopolitical Sentiment Led the Repricing of Gulf Crude-Flow Risk
Read more >
Analysis
22 May 2026
Brent volatility: Tracking Brent’s three-month sentiment shift
Read more >
Analysis
14 May 2026
US inflation Q2: Energy shock meets fed dilemma
Read more >