Crude oil price forecast this week: Bearish pressures mount amid supply-demand imbalance

Understanding the complex interplay of factors affecting crude oil price forecast is become increasingly vital for energy traders and investors amid increasing geopolitical and supply-demand tensions. The latest insights surfaced by our Trading Co-Pilot are signalling a consistent bearish trend for Brent crude oil, with prices experiencing notable pressure throughout February, culminating in significant declines by month-end.

One cannot escape the reality that this latest crude oil price forecast has been dominated by supply-side pressures. Our Trading Co-Pilot processes vast amounts of market data allows us to identify how rising US crude inventories have combined with increased output from Iraq and Nigeria to create substantial downward pressure on prices. By February 25th, Brent crude had fallen to 73.26, reflecting the market’s growing concern about potential oversupply.

crude oil price forecast this week

Geopolitical crosscurrents: Mixed signals impacting crude oil price forecast

The financial and geopolitical forces shaping crude oil markets are sending mixed signals to traders. After a spell of modest gains around February 18th when prices closed at 74.89, the market experienced increasing volatility. This includes the significant impact of drone attacks reducing oil flow from the Caspian Pipeline Consortium by up to 40%, which initially supported prices before broader demand concerns reasserted themselves.

One of the really remarkable things over the last year is how quickly market sentiment can shift when geopolitical developments intersect with fundamental supply-demand dynamics. Fresh US sanctions against Iran and concerns over potential oil tariffs introduced additional uncertainty into our crude oil price forecast, yet these typically bullish factors failed to overcome the bearish momentum established by oversupply concerns.

Economic indicators turn crude oil price forecast bearish

Navigating the complex relationship between macroeconomic factors and energy markets is becoming increasingly challenging for energy traders. Part of the battle here is understanding how a stronger US dollar and weak economic news have contributed to the downward pressure reflected in our crude oil price forecast. The very significant upside is that our Trading Co-Pilot can quantify this impact, assigning an 85% confidence level to its bearish assessment based on current market dynamics.

By February 21st, these economic headwinds had pushed Brent crude to a low of 73.30, with our Trading Co-Pilot analysis indicating that trader sentiment had shifted decidedly negative. This includes the dramatic reduction in speculative bullish positions observed in market data, further confirming the bearish trajectory in our crude oil price forecast.

Supply-demand imbalance: The core driver behind our crude oil price forecast

The tactics used by successful traders often involve identifying the fundamental drivers behind price movements. But it is almost always the case that these relationships are complex and intertwined. In our crude oil price forecast, our Trading Co-Pilot’s analysis has identified that despite ongoing geopolitical tensions that would typically support prices, supply concerns have overwhelmingly dominated market sentiment.

In the previous era, traders might have expected geopolitical risk premiums to provide stronger price support. However, our crude oil price forecast has demonstrated that supply fundamentals were more prevalent in determining price direction. The rise of increased production from multiple regions, combined with inventory builds, has created persistent bearish pressure.

Our Trading Co-Pilot’s technical crude oil price forecast

The most frustrating thing about traditional market analysis is its tendency to provide conflicting signals without clear guidance. Our Trading Co-Pilot goes beyond mere observation to offer actionable insights in our crude oil price forecast. With Brent trading below key support levels at 73.26, our analysis suggests implementing a stop loss at approximately 74.34 (1.5% above current price) and targeting profits around 70.83 (3% below current price).

This approach provides a reward-to-risk ratio of 2:1, allowing traders to capitalise on the continued bearish momentum reflected in our crude oil price forecast while maintaining disciplined risk management. After a spell of volatility, this clear directional bias offers valuable perspective for navigating uncertain market conditions.

Looking Ahead: Factors influencing our crude oil price forecast

As our crude oil price forecast extends toward March, several key factors deserve continued attention. The financial and geopolitical forces currently pressuring prices could shift if OPEC+ signals potential production cuts in response to falling prices. However, the persistent theme of oversupply suggests any recovery may be limited without significant production discipline or unexpected supply disruptions.

It is a good example of how complex the energy markets have become that even substantial geopolitical tensions have failed to provide lasting price support. The tactics used by market participants now emphasize fundamental supply-demand balances over geopolitical risk premiums, marking an important evolution in how our crude oil price forecast is developed.

Navigating forward with our data-driven crude oil price forecast

The leap into the unknown always characterises energy trading, and that’s where our LLM-driven market intelligence comes in. Experience the power of our Trading Co-Pilot‘s capabilities for yourself with a personalised demonstration. See how our platform can help you identify trading opportunities before they become obvious to the broader market. 

Simply contact our team at enquiries@permutable.ai today or fill in the form below to schedule your complimentary session and discover how our AI-driven market sentiment analytics can enhance your trading decisions in these volatile energy markets. For qualified institutional traders and energy firms, we also offer limited trial access to experience the full capabilities of our platform.

Request demo/enterprise trial


Read more AI market sentiment analysis  

Agricultural commodities market sentiment this week

Energy market sentiment 26 Feb 2025

Gold market sentiment this week

Current forex market sentiment this week

Trump tariff plan: Impact on US Dollar and global markets


Natural gas price news: How wars and extreme weather shape TTF and Henry Hub markets

It is not hard to see across Natural Gas price news that the natural gas market has emerged as a critical bellwether for global energy security, with its prices reflecting everything from geopolitical tensions to severe weather events. In this article, we’ll use insights from our Trading Co-Pilot to demonstrate the growing interconnectedness of global natural gas markets that makes the recent price movements across TTF and Henry Hub particularly fascinating. Our analysis of recent Natural Gas price news against price movements reveals a complex interplay between geopolitical tensions and extreme weather events, creating distinct yet related patterns in European and American natural gas pricing.

Natural gas price news - European natural gas TTF analysis November 2024

Above: Natural gas price news – European natural gas TTF analysis November 2024 insights taken from our Trading Co-Pilot

Natural gas price news - US natural gas Henry Hub analysis November 2024 insights taken from our Trading Co-Pilot

Natural gas price news – US natural gas Henry Hub analysis November 2024 insights taken from our Trading Co-Pilot

Weather impact on Natural Gas prices

Let’s start with the obvious – the direct link between weather and Natural Gas prices. From the above chart, it’s clear that Henry Hub prices show notable sensitivity to domestic weather patterns, as evidenced by the sharp responses to events like storm Rafael and the Thanksgiving winter storms. Meanwhile, the TTF market demonstrates a more pronounced reaction to geopolitical developments. Even though both markets operate independently, their price movements increasingly show correlation during major global events.

Natural gas price news: Key market dynamics

The key here appears to be the timing and severity of weather-related disruptions. What began as a relatively stable pricing environment in early November quickly transformed as multiple weather systems struck key consumption regions. Meanwhile, the escalating situation in Ukraine created additional pressure on European gas prices. This is hardly surprising, with TTF showing particular vulnerability to news of missile warnings and conflict escalation. 

To add insult to injury, the markets are also worried about supply security, particularly in Europe, and quite rightly so. And if anyone ought to be concerned, it’s the industrial users facing potential supply disruptions during peak demand periods. Yet with some arguing that some of these concerns appear overblown it will be interesting to see how things truly play out across both regions.

Natural gas price news: Weather event analysis

Another big problem is the asymmetric impact of weather events. Although initially localised, weather disruptions like the recent Bomb Cyclone weather warning in the US created ripple effects across global natural gas markets. Which brings us back to the ticking time bomb of winter supply security, particularly in regions dependent on natural gas for both heating and power generation.

Infrastructure constraints highlighted across natural gas price news 

As elsewhere, it’s clear that the situation has been made considerably worse by infrastructure constraints. Natural gas price news across both markets reflects these limitations, with price spikes occurring during periods of high demand and limited transportation capacity. It’s a uncomfortable fact that thanks to political and economic pressures, infrastructure development hasn’t kept pace with growing demand in key regions.

Natural gas price news and market interconnectivity

It’s easy to see from the above how the interconnected nature of these markets means that significant events in either region can create global ripple effects. The data essentially shows that while local weather patterns primarily drive short-term price movements, geopolitical events can fundamentally alter the pricing landscape, particularly in the more politically sensitive European market.

Stay informed with real-time Natural Gas price news intelligence

If you found the above insights and analysis valuable, why not access our real-time insights and granular market data through our Trading Co-Pilot and Commodities API? With comprehensive coverage of both TTF and Henry Hub markets, you’ll have the real-time insights needed to navigate these complex market dynamics. Contact us today to learn how our solutions can enhance your trading and risk management strategies by emailing enquiries@permutable.ai or filling in the form below to request your personalised demo. 

Arrange a demo 


Why is the price of wheat so volatile? 4 key factors

In this article, let’s compare the various factors currently shaping wheat markets to understand their profound impact on global prices. The approach to analysing the price of wheat has transformed dramatically of late particularly as we witness the tidal wave of technological change that’s about to hit commodity trading through AI-powered analytics provided by tools like our Trading Co-Pilot. Suffice to say that the traditional methods of market analysis are being transformed by real-time data processing and pattern recognition capabilities that were unimaginable just a few years ago. With many asking “why is the price of wheat so volatile” of late, here we’ll use insights taken from our Trading Co-Pilot to help you understand the current state of play.

Until recently, traders relied on fragmented information sources, often missing crucial market signals and opportunities. This has previously meant that a wheat or commodity trader may have struggled to connect seemingly unrelated events that could impact wheat prices significantly. But what happens when you use our Trading Co-Pilot instead? Through the use of this latest technology, several key patterns emerging from recent market data will have emerged, providing traders at the helm with unprecedented market visibility and actionable insights.

4 key factors contributing to volatility in the price of wheat

1. Geopolitical tensions reshaping supply chains and impact on price of wheat

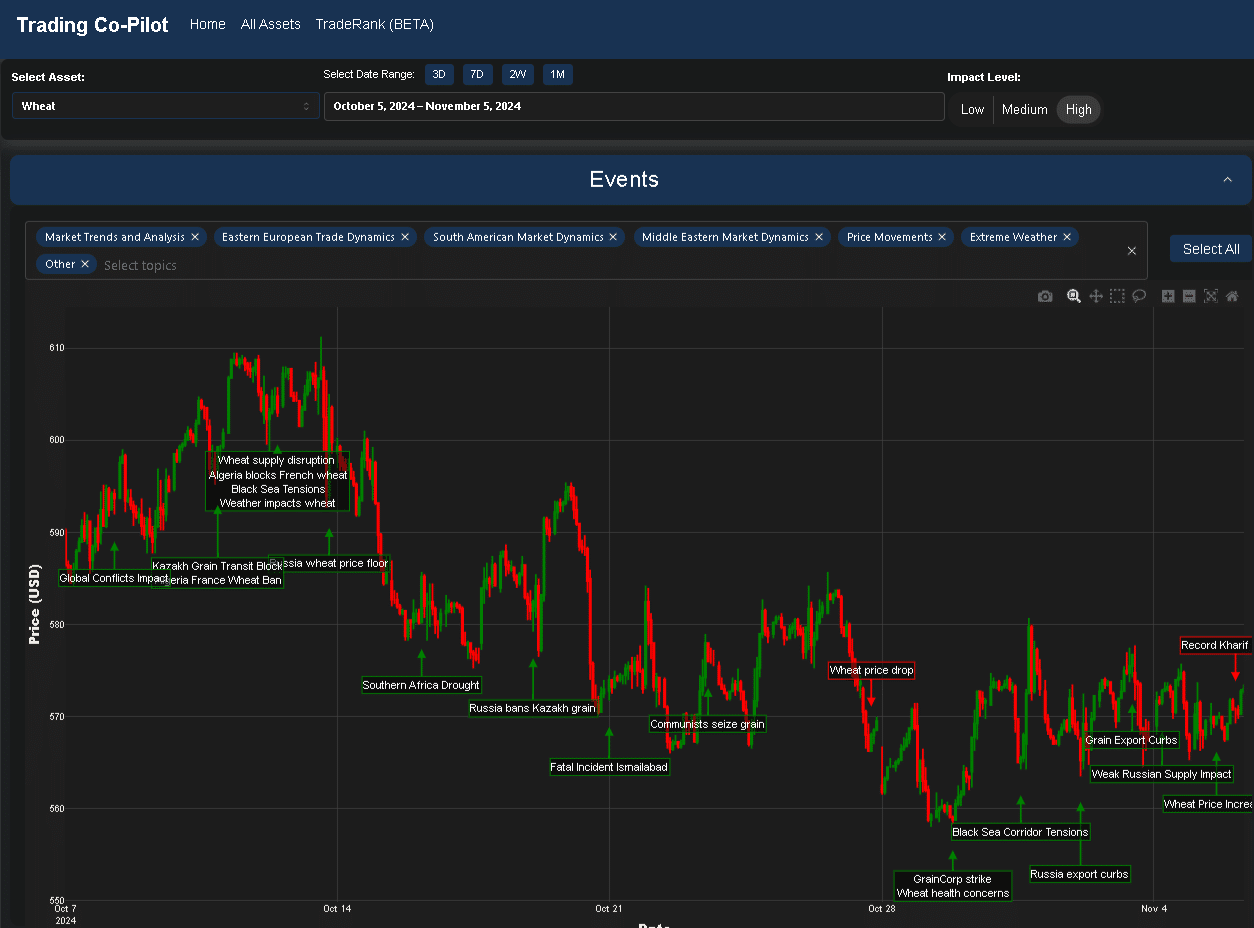
First, let’s turn our attention to Eastern European trade dynamics, where it has emerged that Russian grain export policies have become increasingly complex. Our platform not only highlighted this as a contributing factor (see image above), but also the introduction of price floors at $250/tonne. Then there was the blocking of Kazakh grain transit and escalating Black Sea corridor tensions have added layers of complexity to global wheat movements.

2. Influence of weather events and production uncertainty on price of wheat

Take a look above at the obvious correlation between weather events and price movements in recent markets. Much of the world takes for granted the stability of wheat production but the initiated among us will know that there are important developments that can change everything – as highlighted in the image above from our Trading Co-Pilot. The severe drought crisis in Southern Africa, combined with poor US winter wheat health conditions and global weather-related production concerns, has created a perfect storm of supply uncertainty.

3. Price of wheat and diplomatic relations altering trade flows

To see this point at work, look at the recent Algeria-France situation, where diplomatic tensions taking root from Algeria blocking French wheat entry are perhaps reshaping established trade relationships. You may say, “So what?” But the link with broader market dynamics is crucial, as these diplomatic shifts can create sudden changes in supply and demand patterns. This is true in the context of global trade flows, where our Trading Co-Pilot frequently tracks how diplomatic tensions rapidly reshape established patterns and create new market opportunities.

4. Market structure evolution and price of wheat formation

The picture we are seeking to paint here is one of interconnected market forces, where changes in one region can have unexpected consequences globally. It’s a remarkable time with nail-biting developments in how price discovery occurs, particularly as technology enables faster and more sophisticated market analysis. Of course, you may be a skeptic and continue to watch traditional indicators, but a cynic might observe that these often lag behind real-time events, making them less valuable for active traders. And it is precisely this kind of feedback we have been receiving from early users of our Trading Co-Pilot – and among them are traders at some of the biggest companies involved in trading commodities.

Leveraging our Trading Co-Pilot’s market intelligence


As an example of our platform’s capabilities, consider how our Trading Co-Pilot processes thousands of market events daily scanning 20,000 articles every hour across 50,000 news sources  , identifying critical price drivers and correlating seemingly unrelated events to provide actionable trading signals. This is the result of sophisticated algorithms combined with deep market understanding, enabling traders to detect emerging market trends before they become obvious to the broader market.

Key market indicators we track include but are not limited to:


  1. Real-time price movements
  2. Supply chain disruptions
  3. Weather pattern impacts
  4. Geopolitical developments
  5. Diplomatic relations
  6. Regional trade flows
  7. Market structure changes

Request a free trial of our Trading Co-Pilot

Only five early access positions remaining for our Trading Co-Pilot. Join leading energy trading houses in shaping the future of commodities trading intelligence. Our early access partners receive priority platform customisation, a dedicated account strategist, advanced feature releases, and direct development team support. Get ahead with tech-enabled competitive advantage with our 30-day unrestricted platform access. Simply fill in the form below to get in touch or to schedule your private demo and discuss your specific trading requirements. Don’t miss this opportunity to transform your commodities trading strategy with institutional-grade market intelligence.


Unlocking the power of global news sources for informed trading decisions in 2024

In the dynamic world of financial trading, information is not just power—it’s profit. Understanding the pulse of global events as they unfold allows traders to make informed trading decisions, often ahead of market moves. At the heart of this strategy lies the ability to analyse and interpret news from a myriad of sources worldwide.

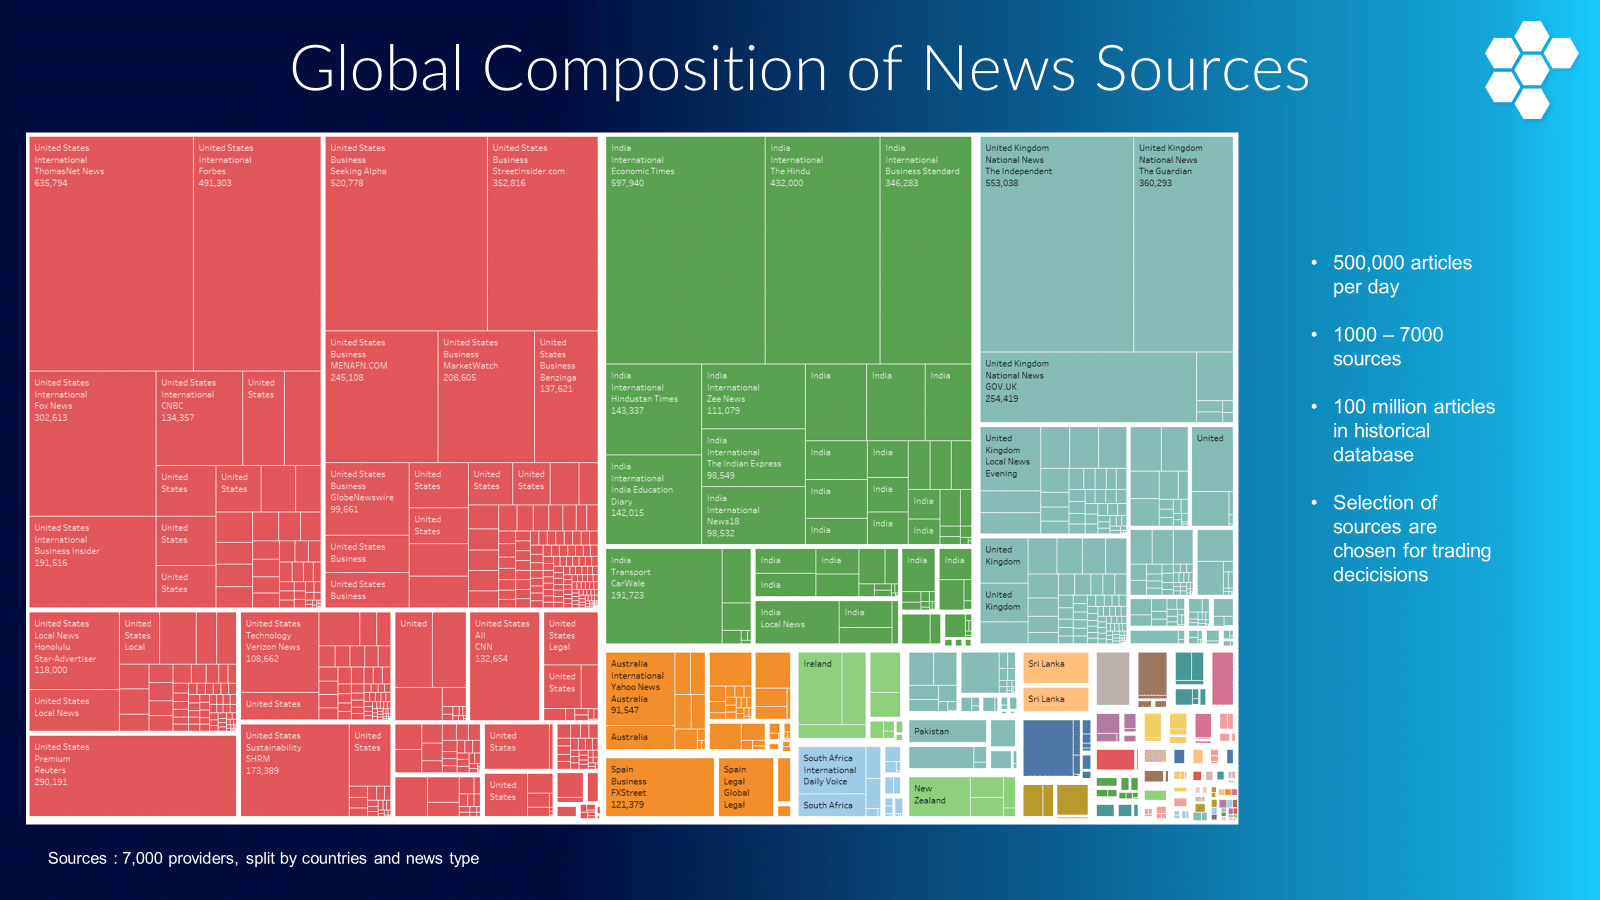
The infographic we have generated above is a detailed treemap representing the global distribution of news sources. It highlights the breadth and depth of information we make available to traders using our database.

The power of visual data: Understanding the treemap

This treemap infographic is a powerful tool that visually captures the distribution of over 100 million articles sourced from approximately 7,000 news providers across the globe. This design not only makes the volume of information comprehensible at a glance but also highlights the geographical diversity of the data. The size of each block within the treemap is proportional to the volume of articles from that region, providing an immediate sense of where the most reporting is generated.

Prominently featured are the United States, India, and the United Kingdom—regions that not only have a high volume of news output but are also key players in the global financial markets. These countries are critical hubs for both political and economic news, influencing market trends and trading strategies worldwide.

Diving deeper: The significance of varied sources in trading decisions

The choice to categorise the news sources by country and volume is intentional. It reflects the importance of geopolitical contexts in financial decision-making. For instance, political stability, economic announcements, and market-moving events are often region-specific, and having a granular view of these sources allows traders to make better trading decisions by pinpointing where significant developments are likely to occur.

The extensive range that we have highlighted from 7,000 providers means that our database is not just vast; it’s nuanced. It includes major global news conglomerates, regional newspapers, and even specialised trade publications. This diversity ensures that traders can access a wide angle of perspectives, from macroeconomic trends to niche industry news—each adding layers of depth to market analysis.

The impact on trading decisions

For traders, the value of this infographic—and the underlying database—is clear. By understanding where news is originating and the volume of output, traders can better assess the reliability and relevance of the information resulting in better trading decisions. This is crucial in a world where the timeliness and accuracy of news can sway markets in moments.

Access to such a comprehensive dataset also allows for the use of advanced analytical techniques, such as sentiment analysis and predictive modelling. Traders can discern patterns and sentiments across different regions, applying these insights to anticipate market movements and inform trading strategies.

Expanding our scope at Permutable AI

At Permutable AI, our commitment to innovation transcends the mere provision of data for enhanced trading decisions. We are at the forefront of developing proprietary algorithms that significantly enhance the predictive capabilities of our platform. By harnessing the power of machine learning and artificial intelligence, our technology does more than just track real-time data—it forecasts future market trends with remarkable accuracy.

This advanced predictive ability allows our clients not merely to react to current events but to proactively strategise and prepare for future scenarios. This capacity to anticipate market movements is a significant competitive advantage, particularly in the fast-paced world of finance where being ahead of the curve is paramount.

Additionally, our ongoing research and development are focused on continuously refining these algorithms to better understand and predict complex market dynamics. This includes the integration of sophisticated models that can analyse vast datasets, identify patterns, and predict outcomes with a higher degree of precision. These models are trained on historical data but are adept at adapting to new, unforeseen market conditions—ensuring they remain relevant and extremely effective.

As we continue to push the boundaries of what is possible in financial data analytics, Permutable AI remains dedicated to its vision of empowering traders with the most accurate, timely, and actionable information available. Through constant innovation and a relentless focus on quality, we strive to redefine the standards of financial trading, making it more informed, secure, and effective for everyone involved.

Step into the future of trading technology with our artificial intelligence trading platform

Are you ready to join us as an early adopter of our artificial intelligence trading platform? Your chance to embrace the future of finance by exploring our groundbreaking Level 4/5 artificial intelligence system, designed to enhance decision-making and maximise market opportunities starts here. Dive into our vision now—because when it comes to the evolution of trading, staying ahead isn’t just an option; it’s a necessity. Discover how we’re transforming the trading landscape and how you can be a part of this change by reaching out to us at enquiries@permutable.ai or by filling in the form below.