The tide turns on Russia inflation outlook as drone strikes spread from refineries to warehouses

In this article we examine a growing divergence in Russia inflation outlook using the Global Macro Sentiment Indices. The Bank of Russia has cut its key rate substantially since 2025 as price pressures eased. Yet the latest GMSI signals across monetary policy, supply chains and inflation are now moving the other way, pointing to renewed pressure beneath the official disinflation.

For most of the past eighteen months Russia inflation outlook has been running a disinflation  story that looked, until recently, close to completion. Annual inflation fell from above 10% in early 2025 to roughly 5.3% by the beginning of this summer, allowing the central bank to lower its key rate from 21% to 14%.By June, however, inflation was back at 6%. The tide had begun to turn. The four sentiment panels below show how that reversal was already taking shape across monetary policy, supply chains, prices and political tension, leaving the earlier disinflation story looking increasingly fragile.

A hawkish cut?
Russia policy outlook

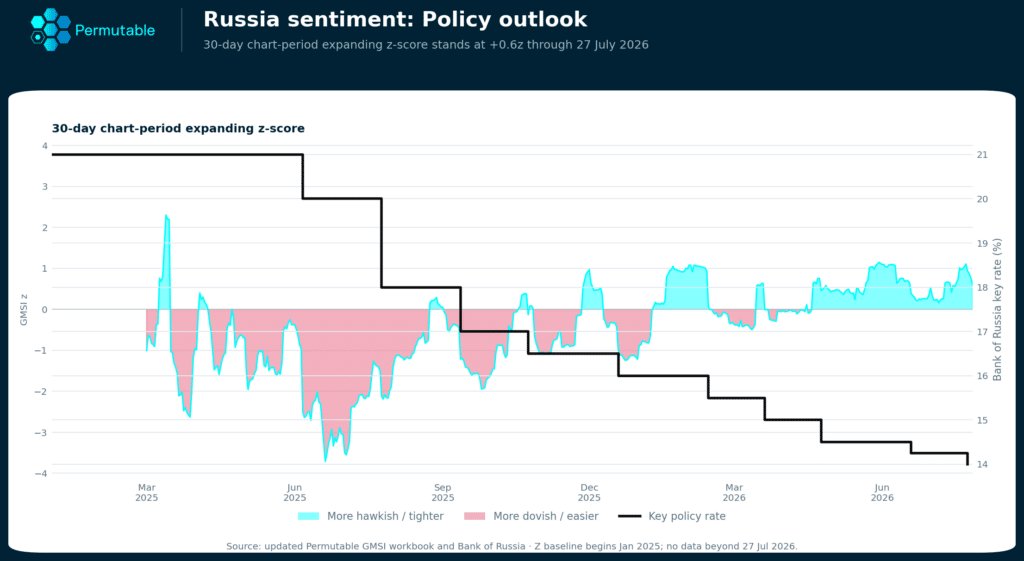
On the policy-outlook chart, the run of rate cuts appears as a long descending staircase. Yet directional sentiment focused on macroeconomic implication shows that coverage has pivoted the other way, shifting through the first half of 2026 towards the hawkish side of neutral to stand at +0.6z, even as the Bank of Russia has continued to ease. The signal tracks the direction of policy commentary rather than a market instrument, so it is best read as evidence that the expected policy path is becoming tighter while the current rate still falls.

The July decision brought that tension into the open. The central bank lowered the key rate, but raised its inflation forecast, lifted the projected rate path and said further cuts would proceed more slowly, citing inflation expectations, impaired production capacity and a more expansionary fiscal outlook. It also warned that a wider structural deficit could keep policy tighter than its baseline assumes. That matters, because it means the pressure on rates is not only a temporary supply story: fiscal demand is reducing the room to look through the shock.

The pressure runs in the other direction as well. In the run-up to the meeting, businesses squeezed by high borrowing costs pushed for relief, and calls from Moscow had called for further cuts. The Bank is therefore not simply weighing inflation against growth. It is trying to slow its own easing cycle while much of the corporate sector presses for cheaper credit. 

From refineries to warehouses
Russia supply chain risk

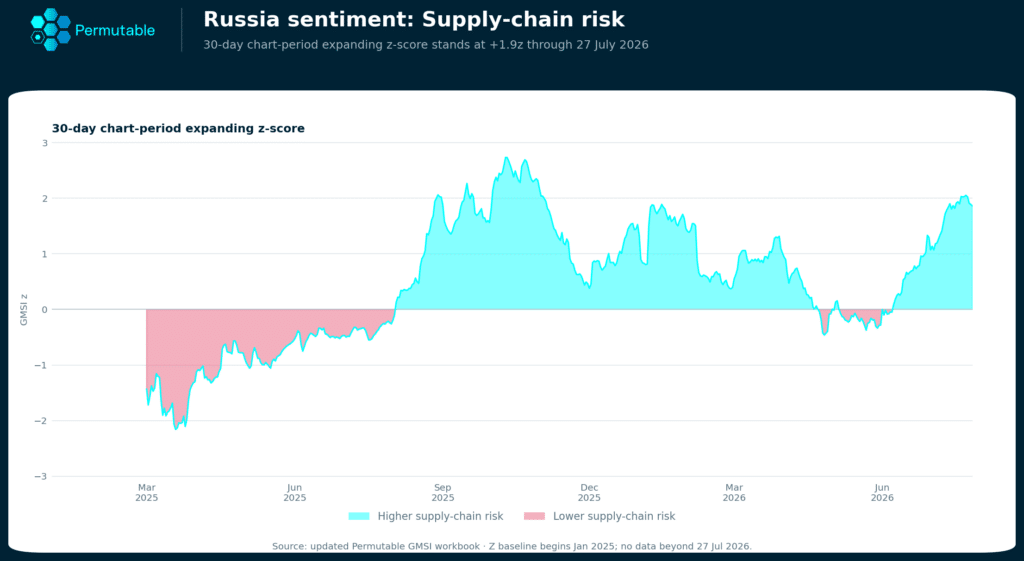
The pressure now sits in supply. The supply-chain risk panel has climbed to +1.9z, close to the top of its two-year range, after rising sharply since June. At first, the move reflected attacks on refineries, oil depots and transport routes, alongside fuel shortages and tighter diesel supply. What has changed is where the disruption bites. For much of the war, the economic strain was concentrated in the oil complex. It has now moved closer to the infrastructure of everyday consumption.

Since 18 July, Ukrainian drones have struck warehouse facilities operated by Wildberries, Russia’s largest online retailer. The first attacks hit logistics hubs in Kotovsk and Elektrostal, killing workers and injuring dozens. Further sites were later affected in southern Russia and near St Petersburg. By late July, warehouses representing roughly 10% of the company’s logistics capacity had reportedly been attacked, while separate estimates placed the share potentially out of service nearer 8%.

These are not peripheral targets. Russia’s leading online marketplaces handle goods and services worth the equivalent of roughly 8.5% of GDP and support about four million jobs. They have become part of the country’s consumer infrastructure, particularly in regions where physical retail is thinner. Strikes on refineries raise costs upstream; strikes on warehouses bring the disruption closer to the shelf.

The attacks have also landed on a retail system with limited spare capacity. Russia’s number of physical shops fell over the past year, the first nationwide decline reported in a quarter of a century, with thousands of outlets disappearing from Moscow and St Petersburg. That does not imply national shortages. It does leave fewer alternatives when a major distribution hub is disrupted, particularly outside the largest cities.

The same imbalance is visible in fuel distribution. Supplies have been redirected from Siberia and supplemented with imports from Belarus to stabilise the Moscow region, while shortages have persisted elsewhere. The result is a more uneven geography of disruption-and a growing sense that the economic burden is no longer confined to refineries, ports or the front.

The descent stalls
Russia inflation outlook

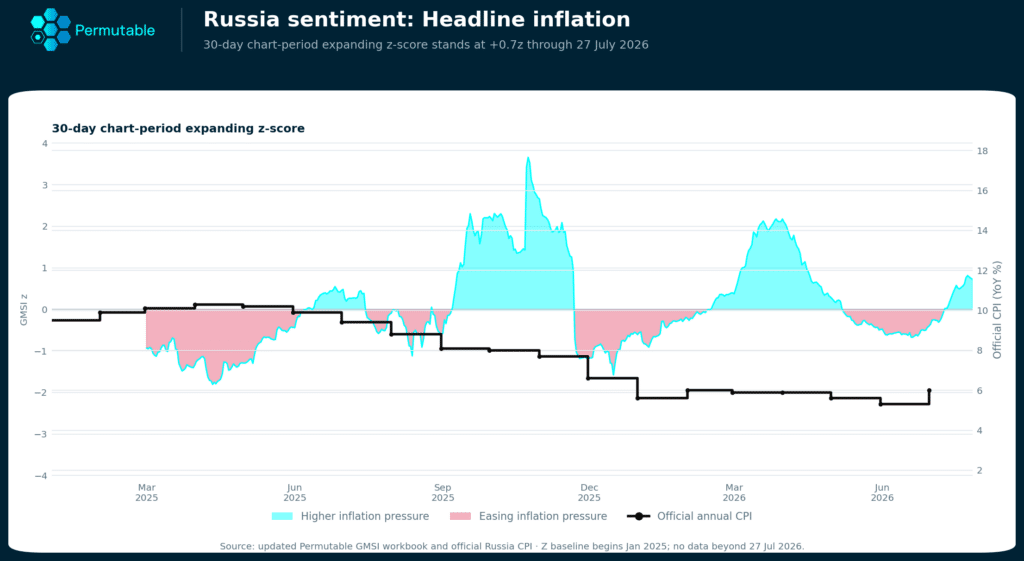
Bottlenecks and constraints on the domestic supply chains are beginning to coincide with renewed price pressure. The headline-inflation sentiment has risen to +0.7z after spending much of the disinflation below neutral, turning before the published series. Annual inflation, having fallen to around 5.5% earlier in the summer, stood closer to 6% by late June. 

Much of the pressure predates the warehouse attacks. Inflation was already firming through fuel as repeated strikes on refining infrastructure soured the availability of supply. Reports of shortages and queues at petrol stations became more common palace in parts of the country. Petrol prices rose by 6.88% m-o-m in June, while diesel costs also increased during the agricultural season, with farmers being particularly worse off and having limited scope to reduce consumption.

The Bank of Russia has acknowledged that higher fuel costs are spreading into a broader range of goods and services, prompting it to raise its 2026 inflation forecast to 6–7%. Its assessment remains measured: much of the increase is considered temporary, underlying inflation is put at 4-5%, and weaker demand is expected to limit further pass-through. Fuel, fruit and vegetables have accounted for much of the recent volatility, reflecting both seasonal supply conditions and the higher cost of transporting perishable goods quickly through the distribution network. The inflation outlook is becoming increasingly uneven as the pressure is no longer confined to a single category. 

Bringing the war home
Russia political tension

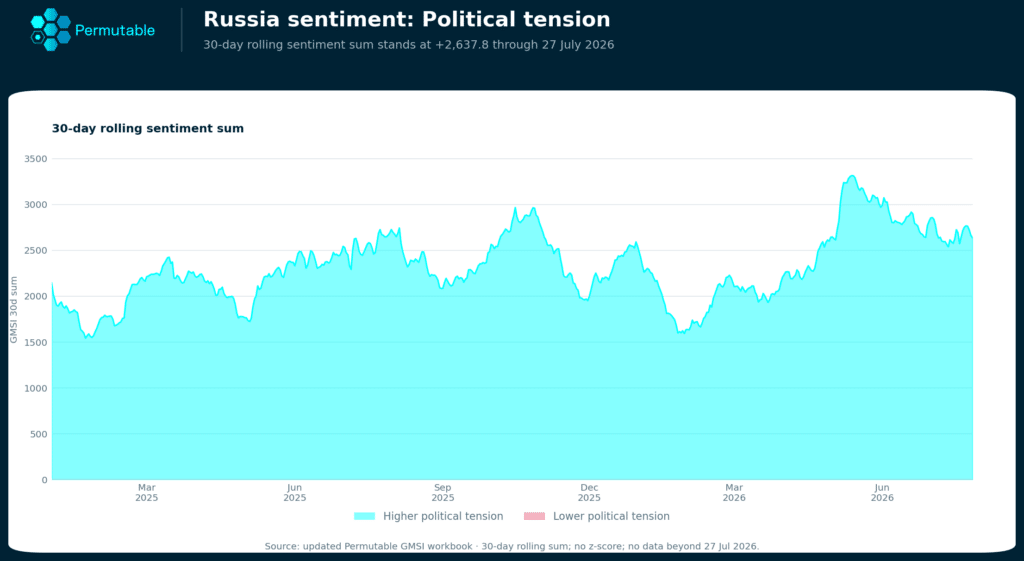
The attacks on warehouses form one part of a wider rise in the domestic economic cost of the war. The political-tension panel remains close to the top of its two-year range, although the recent increase is not driven by logistics alone. The underlying coverage extends to mobilisation and preparations for possible unrest, disputes over wage arrears and staff shortages, public dissatisfaction and reported friction within the political system.

The panel is shown as a rolling sentiment sum rather than a standardised score because the signal has remained elevated for so long that z-scoring compresses the change that matters. At around 2,640, it remains well above the levels recorded in early 2025, even after easing from its June peak.

The reading comes with one caveat: much of the late-July coverage is international reporting on these themes rather than a direct measure of Russian public reaction. Its political significance lies less in any single headline than in the growing visibility of the war’s social cost. Fuel shortages, transport disruption, delayed wages and the prospect of further mobilisation are becoming harder to contain within the economic sphere alone.

Diminishing policy room

The Central Bank had good reason to continue cutting. Inflation had fallen materially, domestic demand was weakening and business expectations for output had softened. Lending growth had slowed to a crawl, consumer-facing firms were under pressure and high borrowing costs were suppressing discretionary spending.

The forces now pushing in the opposite direction are largely supply-driven: damaged refining capacity, more expensive transport and disruption to the distribution of consumer goods. Interest rates cannot repair a refinery or replace a warehouse. But cutting too quickly while those shocks feed into expectations risks turning a temporary rise in prices into persistent inflationary pressure. Households’ own expectations tell the story, perceived inflation rose to 14.7% in July from 12.4% in June, far above the Bank’s revised forecast of 6-7%.

Keeping policy restrictive carries costs of its own. Credit conditions remain tight, businesses are pressing for cheaper borrowing and consumer-facing activity is weakening. At the same time, a more expansionary budget as the conflict persists would leave monetary policy carrying a greater share of the burden.

Where the government and central bank go next will depend in part on whether strikes against refineries and warehouses continue. Damaged capacity creates immediate disruption, but much of it can eventually be rebuilt. The greater risk is that a prolonged deterioration in supply chains pushes costs further into services and hardens wage demands. That would be far more difficult to reverse. The first signs of renewed price pressure have therefore left the Bank in an increasingly precarious position, with its tolerance for further inflation likely to be tested at the next meeting.

Read through the official data alone, Russia in mid-2026 appears to be an economy in which disinflation has progressed far enough to permit lower interest rates. The point in time sentiment from the GMSI offers a less settled reading. The decline in inflation was genuine, but it is meeting a fresh round of supply pressure just as the central bank has begun to ease. The first shock came through fuel and refining capacity and has spread into freight, food and services, while the attacks on major warehouses have exposed the vulnerability of the consumer-distribution network. None of this yet amounts to a return to the inflation regime of 2024 or early 2025. It does make the final stage of disinflation harder, and the next rate cut less straightforward.



How to turn news sentiment into strategy: A guide for institutional investors

This is a comprehensive guide for institutional investors, quants, and macro strategists on applying news sentiment to trading, risk management, and regime detection, with examples taken from Permutable AI’s market sentiment data

We’re often asked how to apply our market sentiment insights in practice, how to turn the behavioural layer of markets into measurable, actionable intelligence. This guide brings together our best practices, use cases, and live results to show how news sentiment in trading can be harnessed across asset classes.

Real-time insight into the forces driving risk and return

Markets move on perception before they move on data. Whether it is fear, optimism, or conviction, each leaves a measurable trace. The challenge has been turning those traces into something institutions can trust and use. That is where market sentiment adds edge: it quantifies the market narrative and converts it into a tradable, target-aware signal that leads the data and sharpens price discovery.

Our market sentiment intelligence does precisely that. We capture global financial, geopolitical, and policy news in real time, measure tone across millions of headlines, and translate the flow into structured, time-stamped data. The outcome is a continuous read of market perception, supported by more than ten years of history, providing a behavioural pulse that complements fundamentals and price action. Every observation is version controlled, time stamped, and traceable to source for full transparency and auditability.

Delivered via our Trading Co-Pilot and alert system, or directly through an API, our signals give economists, portfolio managers, and quants a faster view of shifting narratives and a practical way to turn that insight into strategy. In a world where policy rhetoric, supply shocks, and geopolitical risk shape expectations ahead of official releases, market sentiment supplies the missing layer of context. It shows not only what has happened, but what the market believes is happening, and belief often moves first.

The two charts below illustrate how this works in practice across both an asset and macro level. At the asset level, gold’s monetary-policy sentiment series captures how shifts in central-bank communication, liquidity expectations and policy risk premia accumulate into market positioning long before those dynamics are visible in price alone. At the macro level, Japan’s inflation sentiment provides a high-frequency reading of narrative pressure around prices and wages, often anticipating inflection points in core CPI. 

Taken together, they show how sentiment functions as a real-time gauge of market interpretation,  revealing investors are processing news flow, giving clients an earlier and more nuanced read on evolving regimes.

Gold monetary policy sentiment
Left: Gold monetary-policy sentiment, capturing shifts in central-bank narrative and liquidity expectations ahead of price.
Japan inflation sentiment
Right: Japan inflation sentiment, showing how policy and news flow accumulate across the wider economy and provide an alternative lens on inflation.

Proving the concept: Sentiment proven alpha in our trading strategy

At Permutable, we don’t just provide market sentiment intelligence, we trade on it ourselves. For the past twelve months, we’ve run a fully audited systematic commodity strategy driven entirely by our sentiment signals. This wasn’t a backtest or simulation. It was real capital, real markets, and real risk.

AI for commodity trading 2

From October 2024 to November 2025, our strategy delivered:

  • 20.6% return with 7.3% volatility.
  • Sharpe ratio of 2.85, demonstrating consistent risk-adjusted performance.
  • Maximum drawdown of just 4.4%, showing disciplined risk control.
  • 0.12 correlation to the S&P 500, providing genuine diversification

Our systematic strategy runs a balanced long-short structure across six liquid front-month contracts in energy, agriculture, and precious metals, distributing risk evenly across sectors. Every position is driven by sentiment signals. 

Why does this matter? 

Because it proves sentiment-driven trading isn’t theoretical. When market narratives shift, whether due to sanctions, weather, or policy changes, our signals capture those shifts early and translate them into disciplined, profitable positions. The track record validates what we offer: intelligence that consistently outperforms the market.

Brent systematic trading
Brent’s bid in October – (left) Sentiment flagged the bullish turn early as trade tensions, sanctions and supply signals aligned into a clear regime shift. (right) Our strategy captured the move well ahead of price.

In October 2024, our strategy generated a 13.6% return on Brent and 21.8% on natural gas by capturing narrative shifts before they appeared in pricing. When fresh sanctions on Russian producers shifted the risk position from production to logistics, longer routes, compliance costs, vessel uncertainty, our sentiment layers detected trade tensions and shipping disruption in the news flow early, initiating long exposure ahead of the rebound while earlier shorts cushioned drawdowns. 

Similarly, when winter demand risk, record US exports, and volatile weather converged to flip natural gas sentiment sharply bullish, the model closed shorts ahead of the rally, held through the surge, then trimmed as momentum faded, preserving profits through disciplined regime adaptation. This is market sentiment in action, identifying not just what is moving, but why, and positioning accordingly before the rest of the market has a chance to catch up.

The economist’s lens: Turning perception into structure

Traditional economics measures outcomes. Market sentiment measures perception. Each headline carries a measurable tone, expressed as a score between +1 and -1. We apply news sentiment analysis across more than 50 traded assets spanning energy, metals, agriculture, FX, crypto and equities. Each headline is scored and fed into 2,580 asset-level indices, refreshed with upwards of 500,000 new stories each day. 

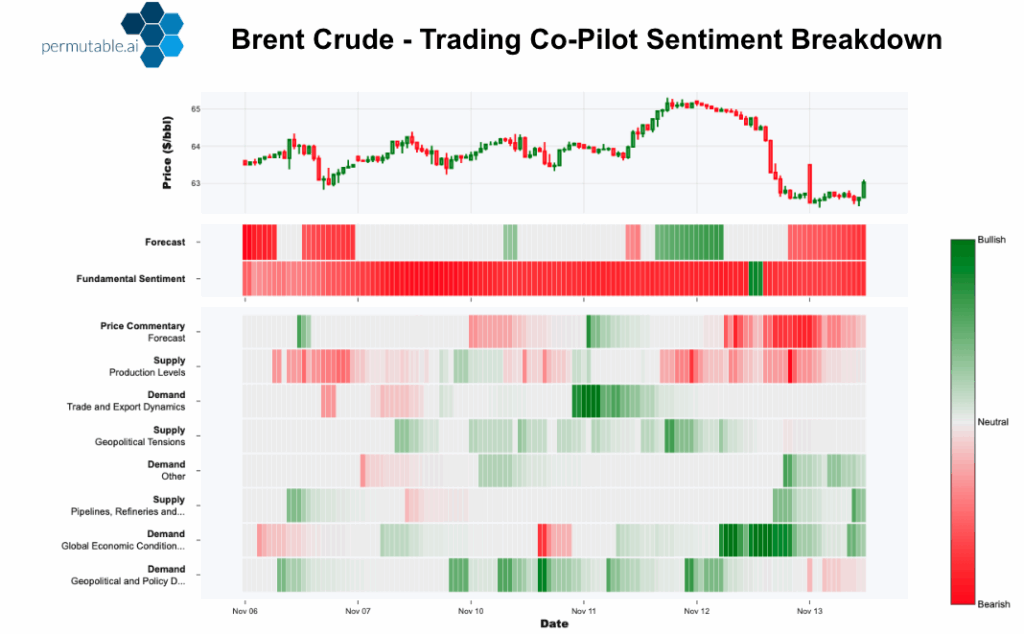
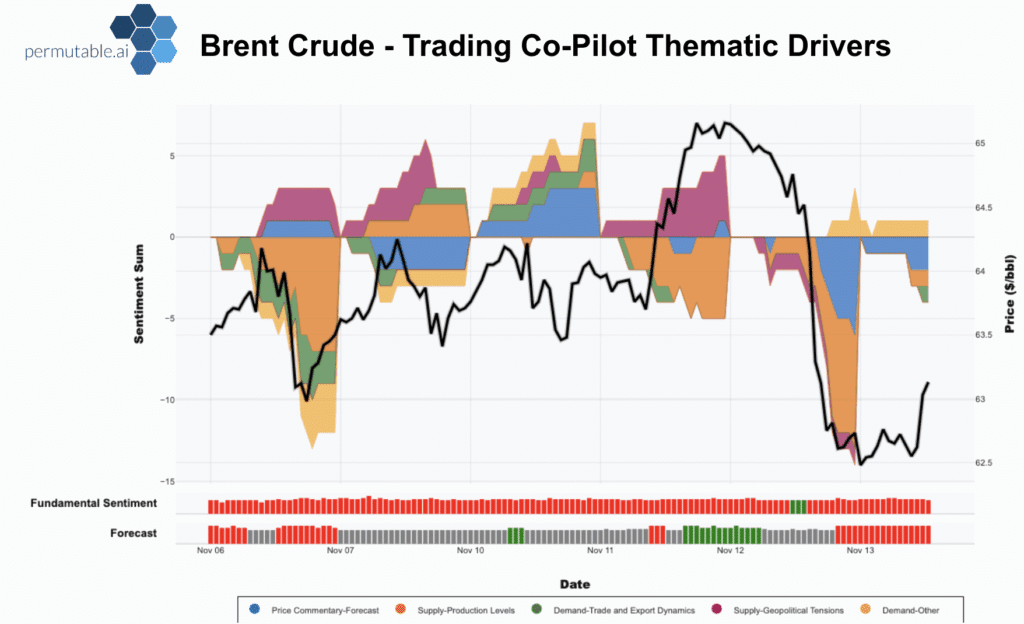
This turns the market narrative into structured, high-frequency signals that behave like traditional market indicators yet respond immediately to changes in news flow. In the Brent chart below, those same signals are decomposed into supply, demand, trade and geopolitical themes to show which narratives are driving prices.

Brent thematic sentiment
Our Trading Co-Pilot shows the breakdown of topic-layer sentiment revealing which narratives are driving the market, supply stress, trade risk and demand signals shifting ahead of the price break.

At the macro level we take the same approach, aggregating local-language news from global sources into 2,640 regional macro indices with more than a decade of history across over 30 regions. For each topic we split news sentiment into international and domestic lenses, separating how the story is told on the ground from how it is framed globally. 

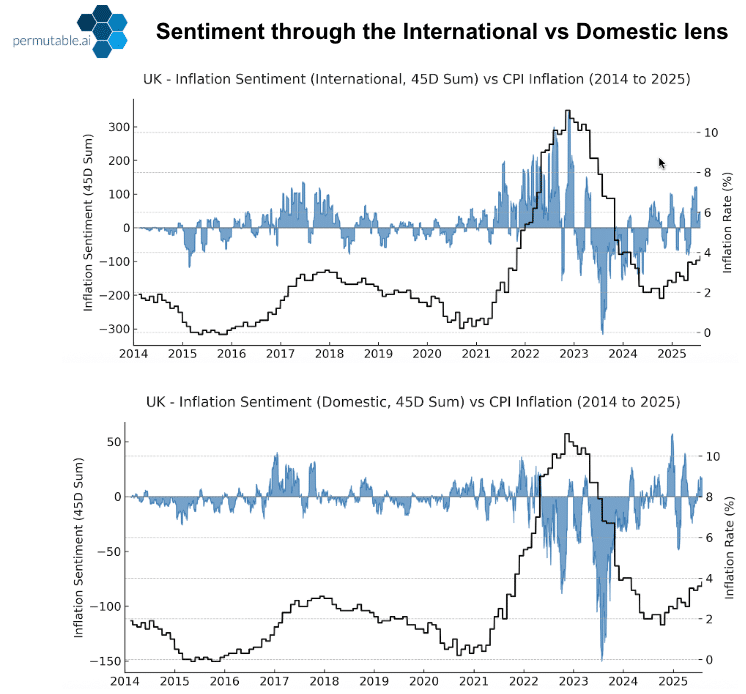
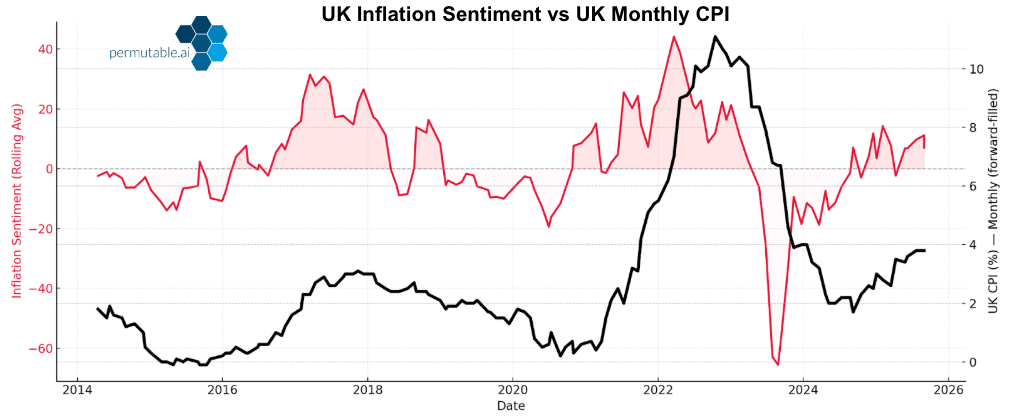
The chart below compares UK inflation sentiment from these two angles, international headlines and domestic news, against CPI, showing how global and local narratives can diverge or move together before the official data. Applied at scale, these indices behave like familiar economic time series but move at the speed of real-time news, flagging shifts in growth, inflation, labour markets, policy and political risk ahead of releases.

UK inflation sentiment domestic vs international
Charts above give two lens views on sentiment from a domestic and international perspective: Domestic headlines track the lived pressure of inflation. While international headlines focus on data, policy and wider macro implications. Together they provide a fuller read on UK inflation sentiment.

Unlike surveys, which are periodic, lagging and prone to response bias, market sentiment indices update continuously with the flow of information, providing an immediate map of collective perception. Structured into indices, these readings become early indicators of how economies and assets are evolving, and where pressure is building or fading.

The raw signal captures tone, rolling averages smooth short-term noise, z-scores can help place narratives today in historical context, and topic-level breakdowns show where attention is clustering, whether around inflation, labour markets, political tension, energy supply or policy risk, across both assets and macro.

Opening new analytical ground:

  • Macro-leading inputs: Enrich nowcasts, dynamic factor models, and regime detectors, identifying turning points ahead of official prints.
  • Policy signalling: Track hawkish or dovish drift and liquidity shifts, anticipating changes in term premia, credit spreads, and volatility.
  • Growth and inflation read: Distinguish demand and supply shocks, aligning with output, prices, labour, and trade in real time.
  • Transmission mapping: Trace policy and geopolitical shocks through FX, rates, commodities, and equities for stress and scenario analysis.
  • Narrative calibration: Provide a live read on how policy, supply chains, and fiscal shifts are interpreted domestically and internationally.
  • Attribution with context: Explain moves by topic, source, and region to identify true drivers and behavioural bias.
  • Research-ready series: Clean, version-controlled, and backtestable, ready for factor blends, forecast combinations, and portfolio models.

Market sentiment does not replace traditional data, it refines it. It turns narrative into measurable evidence and connects perception with reality.

The systematic lens: Turning market sentiment into alpha

For systematic investors and quantitative teams, market sentiment is a live signal rather than a concept. Each score is a numerical input, time-stamped, replicable, and ready for testing, converting unstructured information into tradable behavioural factors.

Tuned market sentiment windows identify when optimism or pressure is building and how persistent that move is. Within systematic strategies, market sentiment plays three clear roles:

Systematic sentiment
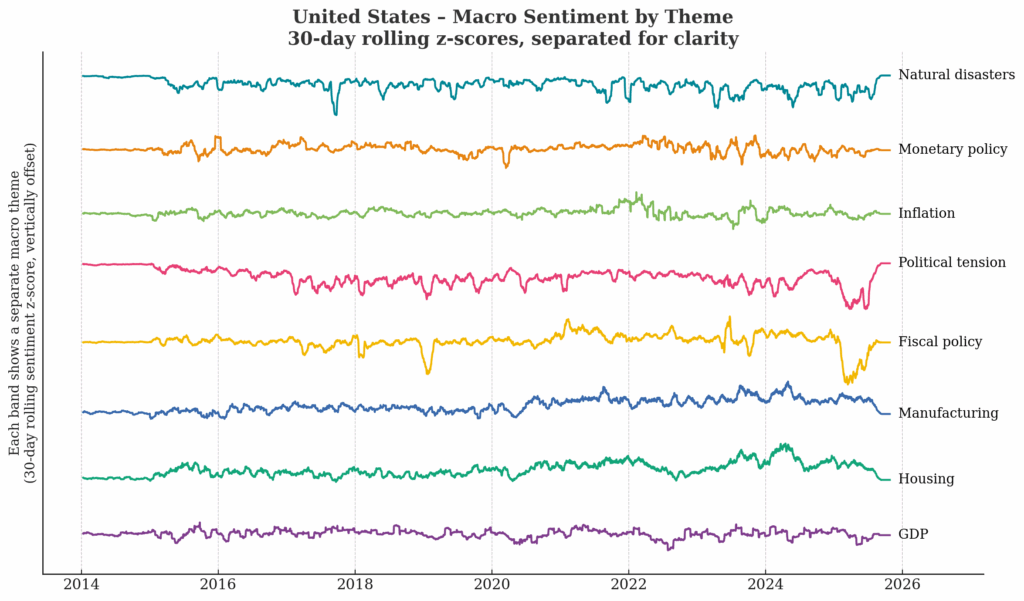
Normalised regional macro-sentiment data sets give quants a clean read on regime shifts, separating themes, controlling for volume, and revealing pattern changes that feed directly into systematic models.

This chart tracks Permutable’s US macro sentiment indices, normalised and smoothed over 30 days so you can see the underlying regimes across growth, housing, manufacturing, policy and politics without getting lost in day-to-day noise. 

Looking at the themes side by side lets a systematic user spot persistent patterns and turning points, then test them properly: which narratives tend to move first, which ones line up with future returns, spreads or macro surprises, and which are mostly noise. From there you can group themes into cleaner factors, build “policy pressure” or “growth risk” baskets, and drop weaker signals, giving you a more stable feature set and a better chance of keeping performance out of sample.

This framework extends naturally across energy, metals, and agriculture. By embedding market sentiment feeds into systematic workflows, traders capture not only what has moved but why, improving conviction, responsiveness, and drawdown control.

Our own trading strategy demonstrates this in practice: a 2.85 Sharpe ratio over twelve months shows what’s possible when sentiment signals are integrated systematically.

Market sentiment in practice: Quantifying markets

Markets are narratives in motion. Quantifying them requires objectivity, scale, and continuous monitoring.

Our framework translates headlines and policy commentary into structured evidence of how investors interpret change. When positive or negative market sentiment dominates coverage, liquidity adjusts and risk premia shifts. As news sentiment builds in one direction, positioning often changes before fundamentals do. These behavioural transitions, visible in tone, emphasis, and persistence, underpin market sentiment’s reflexive power.

Tracking how narratives cluster and evolve allows our indices to surface early signals of where attention, confidence, and stress are shifting, the same forces that drive asset repricing.

Institutional workflows and applications

Commodity and energy desks

Track evolving narratives around supply, demand, regulation, and weather. Shifts in policy or disruption tone appear first in market sentiment data, often preceding volatility or curve steepening across oil, gas, metals, and agriculture. Our October Brent performance, capturing the sanctions-to-logistics narrative shift, illustrates this edge in practice.

Multi-asset strategy teams

Use market sentiment as a high-frequency complement to conventional indicators. Changes in tone around growth, inflation, and policy frequently precede data releases or surveys, sharpening scenario analysis and turning-point detection.

Systematic and quant investors

Treat market sentiment as a behavioural factor that can be tested directly within trend, carry, or volatility models, enriching alpha generation and regime classification. Our live 2.85 Sharpe demonstrates this isn’t theory, it’s repeatable performance.

FX and macro strategists

Monitor divergences in growth, policy and news sentiment between economies. When tone splits meaningfully across regions, it can highlight curve misalignments or FX asymmetries before markets adjust.

Risk and portfolio oversight

Identify where stress is building and where complacency persists. Real-time news sentiment provides early signals of overheating or uncertainty, adding a behavioural lens to leverage, liquidity, and hedge calibration.

Sharper market insights, powered by our Trading Co-Pilot intelligence suite

Brent crude sentiment regime
Brent crude’s intraday price action alongside our Trading Co-Pilot sentiment layers. Fundamental sentiment and short-term forecast signals sit directly beneath price, highlighting shifts in tone and direction. Green shades indicate rising bullish tone, red shades indicate bearish pressure, and neutral areas reflect balanced or low-intensity flow. Together, these layers provide a real-time map of the narratives influencing key thematic drivers and directional bias.

Our Trading Co-Pilot turns sentiment data into clear visual intelligence on market conditions. It highlights the headlines shaping each sentiment regime, maps bullish or bearish shifts across categories like supply, demand, and policy, and aligns these directly with asset-price behaviour.

From the bullish rotation in Brent to volatility spikes in metals or FX turbulence ahead of policy meetings, each chart combines sentiment and price action to provide an immediate, explainable view of the forces driving regime change.

For quant, systematic, and data-sourcing teams, the API delivers the same intelligence at scale: structured, transparent, and ready to integrate into dashboards, quantitative models, or automated trading systems.

Where market sentiment becomes edge

The edge now lies not in spotting the fundamentals first, but in understanding how the market already feels about them, and news sentiment makes that visible.

At Permutable AI, we convert global news and policy narratives into real-time, explainable signals that strengthen timing, conviction, and risk control across asset classes. For economists, portfolio managers, and quants, our Trading Co-Pilot and API provide a structured bridge between perception and performance. Market sentiment becomes a live input to strategy, continuously testing house views against the information set and signalling where narratives are shifting before prices move.

Here, it is important to note that news sentiment does not replace expertise, it amplifies it. It gives investment teams a systematic read on market psychology, transforming perception into foresight and narrative into alpha.

We don’t just sell these signals. We trade them ourselves. And over the past twelve months, we’ve demonstrated they work: 20.6% returns, 2.85 Sharpe, and 4.4% maximum drawdown in live markets.

Next steps: Explore how our solutions can fit into your workflow:

  • Request a live demo of our Trading Co-Pilot intelligence suite.
  • Access our market sentiment indices through our API to test within your own models (covering 50+ assets across energy, metals, agriculture, FX, and equities).
  • Discuss integration or strategic partnership options tailored to your macro, quantitative, or commodity focus.

Reach out to our team at enquiries@permutable.ai to see how our real-time news sentiment intelligence can enhance your decision-making across markets, assets and strategies.

AI for commodity trading: Permutable AI’s one-year results review

Although at Permutable, our core offering is market intelligence, one of our key differentiators is that we run a live systematic commodity trading strategy built on those insights which has delivered clear, repeatable results over the past year. 

Clients asked whether our sentiment signals only back-test well. We took this one step further – using our AI for commodity trading, leveraging our AI-driven signals  in real time. The result is a disciplined commodity trading strategy that has not only navigated tariff headlines and geopolitics with conviction, but taken the right side of regime shifts, and delivered consistent risk-adjusted returns. Against other benchmarks we have outperformed 90%+ of CTAs, proving that sentiment is not only actionable but has clear alpha. 

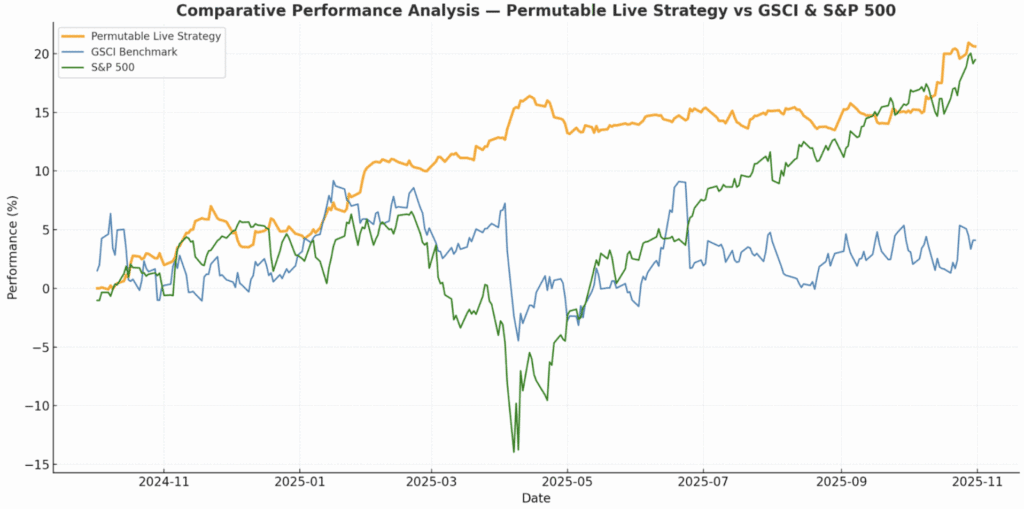
From 1 Oct 2024 to 1 Nov 2025 our live book outperformed major benchmarks with low equity beta and tight drawdown control. The track record stands at 20.6% with 7.3% volatility, a 4.4% maximum drawdown and a Sharpe of 2.85. Over the same period the S&P 500 returned 18.1% with 18.2% volatility, while the GSCI delivered 4.1% with 17.2% volatility. We run a balanced long and short structure, trade highly liquid front-month futures, and spread risk evenly across energy, agriculture and metals. 

AI for commodity trading 2
Strategy: A simple balance mixed 50/50 long-short commodity book of six highly liquid contracts across energy, agriculture and precious metals. These results highlight the effectiveness of using AI for commodity trading in delivering steady, risk-adjusted performance even amid volatile global markets.

Performance Snapshot (live, 1 Oct 2024 to 1 Nov 2025)

  • Return: 20.6%
  • Volatility: 7.3%
  • Max drawdown: 4.4%
  • Sharpe ratio: 2.85
  • Correlation to S&P 500: ~12.2%
  • Risk Allocation: Evenly distributed VaR across global energy, agriculture, and metals markets.

October strategy review

October Review

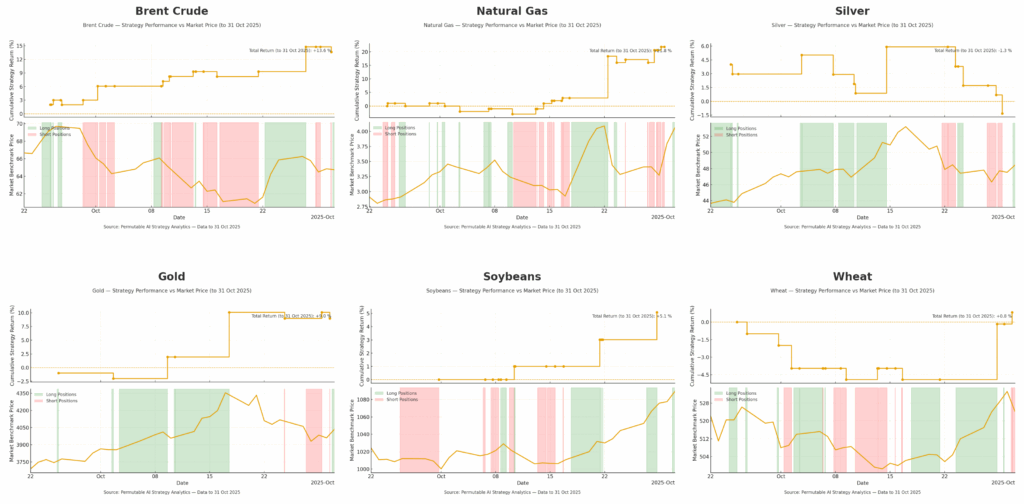
Brent Crude (+13.6%)
Brent delivered a firm 13.6% return over October, with our strategy capturing both the early-month softness and the subsequent recovery. A series of well-timed long entries into the late-month rebound drove gains, while short exposure earlier in the period cushioned the drawdown. The performance reflects a measured approach to positioning in a market that remained volatile but directional.

Our AI-driven signals turned higher as sanctions tightened and shipping/insurance frictions pushed a premium into prompt barrels. With logistics risk lifting the front of the curve, conviction rose and we seized longs while keeping discipline as spreads cooled. This is reflected in the graph below, where our system detected the convergence of bullish factors for Brent crude oil in late October and made a timely long call that captured the upside.  

Brent rally

Natural Gas (+21.8%)
Natural gas was the standout performer, returning 21.8% across a turbulent month. The model navigated sharp reversals effectively, closing shorts before the mid-October rally and maintaining disciplined long exposure as prices surged. This result underlines the strategy’s capacity to handle high volatility and extract value from rapid shifts in market sentiment.

The signal pivot came as weather risk and record US export prints outweighed supply additions. Alerts around project restarts and cargo cancellations kept risk light into early November, preserving gains as momentum faded.

Silver (-1.3%)
Silver finished marginally lower, hindered by premature long entries ahead of a short-lived correction. Losses were contained, however, with risk controls limiting downside. The strategy adapted well in the first half of the month, realigning with renewed downside pressure. Overall, performance was steady given the reversal of conditions in precious metals.

Gold (+9.0%)
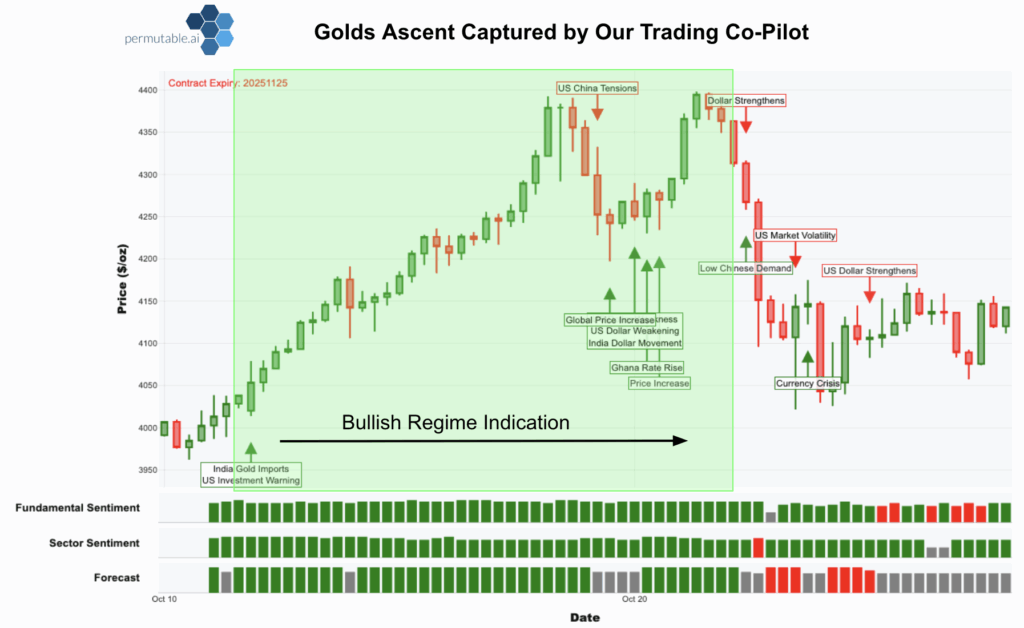
Gold posted a formidable 9% gain, benefitting from well-placed long exposure during the mid-month rally. The strategy avoided early noise and tracked the broader risk-off theme that spurred precious metals. Its patience in holding positions through the mid-October climb captured the bulk of the upward move, reinforcing gold’s value as a defensive trade.

Conviction eased later in the month as the cooling of tension and risk appetite re-emerged, cooling the heat out of the yellow metals run. We followed the signal back to neutral stance and banked the long position, treating following movements as profit-taking within a still supportive structural backdrop of central-bank and Asian demand.

Golds ascent

Soybeans (+5.1%)
Soybeans advanced 5.1% as the model successfully rotated from short to long in the second half of the month. The strategy captured the late-October recovery in agricultural prices, with improved timing following a choppy start. The gain reflects stronger trend recognition and tighter discipline in execution.

Policy tone improved with Washington–Beijing détente and re-emergence of Chinese booking late October, we rotated long and trimmed as headlines faded and momentum cooled into month-end.

Wheat (+0.8%)
Wheat recovered from early losses to close modestly higher at 0.8%. Initial exposure proved to miss the mark, but later long entries boded well in the late-month rebound. The system’s adjustments helped preserve capital through volatility, as momentum pivoted.

In late October the easing trade tensions lifted confidence in forward purchasing, yet a comfortable supply backdrop (Russia, Argentina, Western Australia) capped bullish enthusiasm. Signals supported a tactical long bias late in the month, with risk kept modest given soft US inspections and slower EU exports.

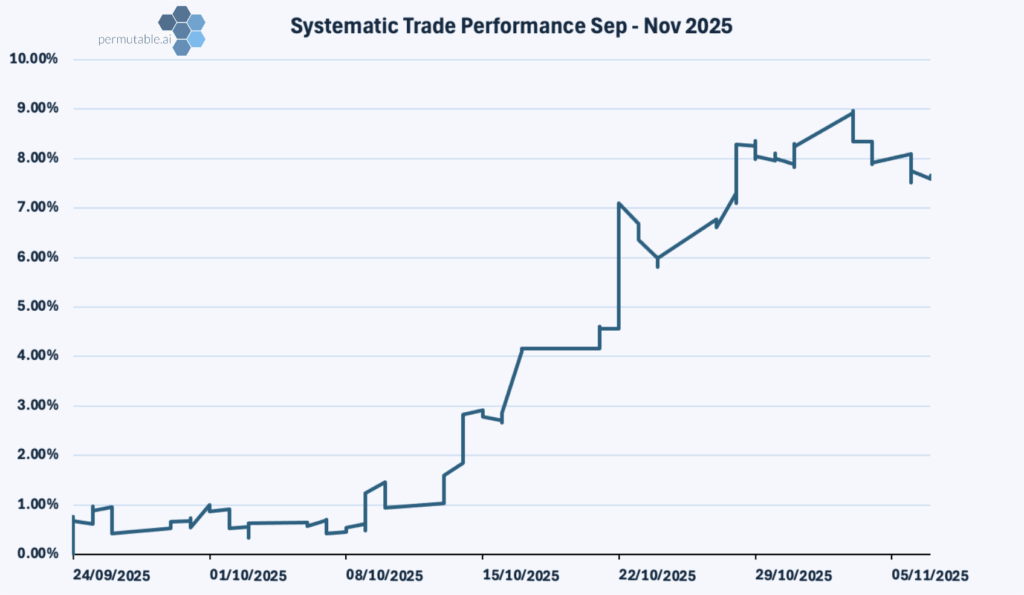
Each commodity’s performance further validates our thesis: that AI for commodity trading can recognise shifting market narratives earlier than price and guide positioning with measurable confidence. Our systematic trade performance from late September to early November reflects the effectiveness of signals and strategy.   

systematic trade

How this fits into client strategy and workflow: The case for AI for commodity trading

Our approach offers institutional desks a practical way to integrate AI for commodity trading directly into macro, CTA, and multi-asset strategies – providing low-correlation returns and explainable signals.

Where it fits
  • Diversifier with low equity beta: Adds a differentiated return stream through commodities market due to the current stock rally, correlation ~0.12 to the S&P 500.
  • Macro overlay: Signals highlight regime shifts around tariffs, supply dislocations and geopolitics, supporting tilt decisions in broader macro books.
  • CTA complement: Cleaner risk profile and shorter reaction time versus broad commodity indices.
Transparency
  • Explainable signals: Each change is accompanied by a short note on drivers, including from geo-political, supply, demand, broken down further through region, to which narratives are dominant.
  • Audit trail: Version controlled signal history, orders and fills, with a daily, weekly and monthly review.
Benefits to the desks and PMs
  • Earlier conviction: Signals often turn ahead of price, helping analysts and PMs to lean into market moves rather than chase them.
  • Clean event narratives: Clear asset agnostic event allocation capturing the drivers as they unfold in real-time, allowing them to keep on top of regimes and infection points.
  • Operational ease: Delivered as an API plus an intuitive UI dashboard, ready for modelling, market catch ups for morning meetings and intelligent insights briefing notes.

Why Permutable is the leader in AI for commodity trading

Running the strategy live demonstrates what matters for investors: sentiment is actionable. The same domestic and international lenses that power our research inform entries, exits and risk allocation, helping us spot regime shifts early, lean into market narratives that matter, capturing the alpha. Our systematic performance record makes the case clear, sentiment matters more than ever whilst AI for commodity trading can operationalise that insight at scale.

How clients work with us

We have often been asked why we haven’t launched a fund to showcase our systematic strategy. The answer is simple – our goal isn’t to compete with clients or run capital, but to provide technology, data, signals and workflow infrastructure directly to institutional partners in a variety of ways.

Through our API Licence, partners can access our asset- and macro-level APIs, embedding real-time signals and alerts into existing OMS and trading systems without the friction of new infrastructure. For those seeking a more visual experience, our Trading Co-Pilot dashboard offers secure access to live signals and alerts, market intelligence, and event-driven reporting – ready to plug into existing workflows.

We recognise that adopting new AI systems can come with integration and governance challenges, so our model is designed for transparency, explainability, and control – helping partners deploy adaptive AI with minimal disruption.

Explore our systematic trading solutions or read our case study to see how institutions are using our approach in practice. To stay up to date, sign up for our newsletter or contact us at enquiries@permutable.ai to find out more.

UK inflation sentiment: An early warning on policy credibility

In this article we examine the interplay between UK inflation dynamics, policy credibility, and the long end of the gilt curve. Inflation has become the fault line for UK markets, with the long end of the yield curve now serving as the clearest test of policy credibility. The 30-year gilt has emerged as the market’s barometer of confidence in fiscal prudence and the Bank of England’s policy stance, with shifts in inflation sentiment increasingly offering an advance signal of repricing.

Unravelling the Market Narratives Driving UK Inflation

Markets no longer move solely on the data itself, they respond to the narratives that frame them. By tracking the market’s heartbeat through our macro indices, we measure both conviction, using the tone and intensity of commentary; but also the degree of coverage, capturing the breadth of circulation across the market discourse.

A clear example of this is evident in the recent movements in UK inflation sentiment, which began to pivot upwards ahead of July’s CPI release, a precursor signal to the subsequent upside surprise. As the print exceeded expectations, the move was swiftly transmitted into the long end, with gilt yields repricing higher. In this sequence, market sentiment did not merely echo events, it provided an early read on the market’s unease as the stir around policy credibility and risk premia built up.

UK Inflation sentiment
UK Inflation sentiment led the July CPI release, being used as an early-warning signal.

From UK Inflation to Policy Credibility

The July CPI print at 3.8% y-o-y (up from 3.6% in June), the highest since January 2024. Transport costs spurred much of the price spike, with the release coming mere weeks after the BoE cut rates to 4% in a finely balanced 5-4 decision by the MPC. While CPI has eased from its 2022–23 highs, UK inflation sentiment has begun to turn positive again in 2025, indicating that the market is bracing for renewed inflationary pressure.

In this setting, the contrast is clear. Inflation is once again surprising to the upside, yet the policy path is already unwinding. For markets, that combination has all the characteristics of a credibility dilemma – the BoE appears to be loosening its stance just as price pressures re-emerge. 

These factors are difficult to ignore, where investors had hoped for consistency, they now see policy drifting out of line. Such dissonance has unsettled market sentiment, reviving familiar questions surrounding the Bank’s stance, whether it is prepared to lean against inflation risks or whether political / growth concerns are taking precedence. As a result, the yield curve itself has become the register of doubt, with the long end bearing the imprint of a market that is no longer convinced the policy will deliver the discipline needed to anchor expectations.

Yield Stress at the Long End

The UK has broken away from its peers, standing out as the outlier in the G7. While lingering UK inflation pressures explain part of the move, the greater weight falls on a structural credibility gap that has pushed UK yields to the top of the pack. The cracks in policy credibility are widening, leaving a gap increasingly filled by risk premia and uncertainty. 

30yr government bonds
The cracks in policy credibility are widening, with UK 30-year gilts surging above 5.6%, leaving a gap increasingly filled by risk premia and uncertainty.

Nowhere is this more visible than at the long end of the curve, where 30-year gilts trade above 5.6%, compared with 4.9% in the U.S., 4.2% in France, 3.3% in Germany and 3.2% in Japan. While peers face the same global pressures, their long ends remain anchored, the UK stands alone, having broken away as gilts carry the heaviest premium amongst the advanced economies.

For investors, the repricing goes well beyond the latest inflation surprise –  it is a broader verdict on the UK’s policy stance. What is being priced is not just inflation itself but the persistence of a risk premia, the extra yield investors now demand for holding UK debt amid doubts about credibility. That shows up as a rise in the term premia, with markets requiring greater compensation to commit capital to long-dated gilts in the face of uncertainty over fiscal sustainability and the Bank of England’s reaction function. 

This structural steepening at the long end leads to higher borrowing costs for the state, crowding out for corporates, and reduced relative value appeal of gilts in foreign portfolios. In other words, the long end has become the clearest register of that unease, with each rise in yield reflecting the extra premium demanded to hold UK debt in the face of eroding credibility and the growing shadow of fiscal drift. The message is clear, credibility lost becomes costly to reclaim, and nowhere is that more plainly written than in the long-end of the yield curve.

UK 30yr gilt
This chart highlights how the long end has become the clearest register of credibility risk and market scepticism. Even when inflation sentiment softens, gilt yields remain stubborn, signalling that investors are pricing in structural doubts over the UK’s fiscal sustainability and the Bank of England’s policy stance.

The Long-Term Implications

A prolonged period of long-end stress carries broader risks.

  • Debt servicing costs rise for both government and corporates.

  • Financial conditions tighten, curbing credit availability.

  • Asset valuations weaken in sectors most sensitive to gilt yields.

With gilts at elevated levels, and underlying concerns simmering, the chain of causality is becoming clearer, UK inflation surprises erode policy credibility, long-end yields climb, and systemic risk edges higher.

Gaining the Edge

Market sentiment offers the early signal. It reveals how UK inflation narratives turn into credibility tests, and how those tests are priced into the gilt curve. Spotting this sequence early ahead of the curve transforms hindsight into foresight. That is the edge – connecting fundamentals with the market’s own heartbeat, and identifying stress before it breaks into the open.

At Permutable, we specialise in decoding these shifts in real time. Our macro sentiment indices capture the turning points in narrative and market essence before they appear in the broader consensus. 

If you’d like to explore how are data can give your team a forward-looking edge, get in touch with us at enquiries@permutable.ai

Read our latest Permutable Perspective monthly publication here and sign up to our weekly Permutable Insights newsletter here

FAQs

Q1: What does the UK Inflation Sentiment Index measure?

It captures the tone and intensity of financial media narratives around UK inflation, quantifying whether sentiment is becoming more hawkish, dovish, or credibility-focused.

Q2: How does this data act as a leading indicator?

Shifts in sentiment often appear before CPI releases or BoE moves. For example, in July 2025, inflation sentiment rose ahead of the CPI print, providing an early warning of gilt repricing.

Q3: Why focus on the long end of the gilt curve?

The 30-year gilt is now the market’s clearest register of policy credibility. Rising yields signal not only inflation expectations but also the risk premia investors demand to hold UK debt.

Q4: How can institutions use this dataset?

Risk managers, macro funds, and strategists can integrate the sentiment index into models to anticipate stress, guide hedging decisions, and refine allocation in fixed income.

Q5: What makes UK inflation sentiment unique in 2025?

Unlike peers, the UK faces a structural credibility gap. Even when inflation sentiment softens, yields remain elevated, showing markets are pricing persistent doubts in fiscal and monetary discipline.

The geopolitical risk premium takes centre stage as energy markets rally

In this article, we examine how a wave of geopolitical developments has reshaped the landscape across global energy markets. From renewed pressure on Russian energy to the unveiling of a US-EU energy pact, the past week has marked a decisive shift in the drivers of oil and gas prices.

Against this backdrop, our Trading Co-Pilot identified a build-up of bullish momentum signals across Brent, WTI, and TTF. These signals emerged alongside regime shifts, where accelerating sentiment and converging macro risks pushed markets into a new phase of price action. What we see is a market increasingly driven by political risk, regulation, and diplomatic shifts, rather than by supply-demand fundamentals alone.

Our Trading Co-Pilot surfaces a series of high-conviction entry points, each aligned with shifts in sentiment and structural market changes. These signals anticipated sharp rallies across all three benchmarks, revealing how pricing dynamics have evolved in response to rising policy pressure. We break down the political, structural, and market forces behind the moves and assess the themes likely to define the path forward for energy markets.

Brent Crude: Geopolitical Risk Offsets Increased Supply

Brent futures rose to $72.70, touching a five-week high, as sanctions risk eclipsed optimism around OPEC+ output increases. While the markets showed signs of stabilisation, the growing uncertainty around Russian-linked barrels spurred the swift price ascent.

Sanctions Over Supply: A New Risk Premium Forms

Recent policy rhetoric revived the possibility of further sanctions targeting those involved in the transport and financing of Russian energy. Even in the absence of formal enforcement, the stern message alone introduced a reputational risk premium, increasing legal and financial exposure across energy markets.

Geopolitical Drivers: A Sharp Escalation in Policy Risk

In just a few days, the U.S. administration issued a series of high-impact policy threats:

  • A 10-day ultimatum for Russia to come up with a ceasefire plan to end its invasion of Ukraine, paired with a warning of 100% secondary tariffs on Russian oil.

  • New export tariffs aimed at India and China, increasing pressure on their Russian energy imports.

  • Broader signals of enforcement against Iranian-linked crude shipments.

This sudden squeeze on trade through renewed sanction pressure, has introduced significant uncertainty across Asian energy trade routes. The market quickly repriced geopolitical risk in energy markets, as the shift from rhetoric to enforcement came into the spotlight.

Strategic Realignment: Transatlantic Energy Policy Takes Centre Stage

The US–EU energy pact formalised a structural shift away from Russian energy. While the strategic direction is now set, the timeline for execution remains constrained by infrastructure gaps, regulatory friction, and limited market coordination. Full implementation is expected by 2027, though delays remain likely.

Market views remain split. Some expect geopolitical tailwinds to keep prices elevated, driven by sustained policy risk. Others anticipate a correction as OPEC+ supply ramps up and macroeconomic pressures ease.

Our Trading Co-Pilot Tracks the Breakout

Our Trading Co-Pilot flagged the bullish momentum shift just as Brent cleared $71. The signal aligned with sanctions-driven sentiment, EU policy realignment, and OPEC+ output. Prices moved swiftly toward the $72–$73 range.

Brent Crude
Our Trading Co-Pilot captured the early inflection, as legal and political risk returned to dominate Brent price formation.

WTI Crude: Tariffs, Sanctions and Supply Signals Push Prices into Bullish Territory

WTI crude held firm near $69 per barrel this week, as geopolitical risk in energy markets overshadowed a contradictory U.S. inventory picture. The rally was not driven solely by supply dynamics, but by a surge in regulatory pressure, including threats of secondary sanctions, renewed tariff pressure, and shifting trade alignments.

WTI oil
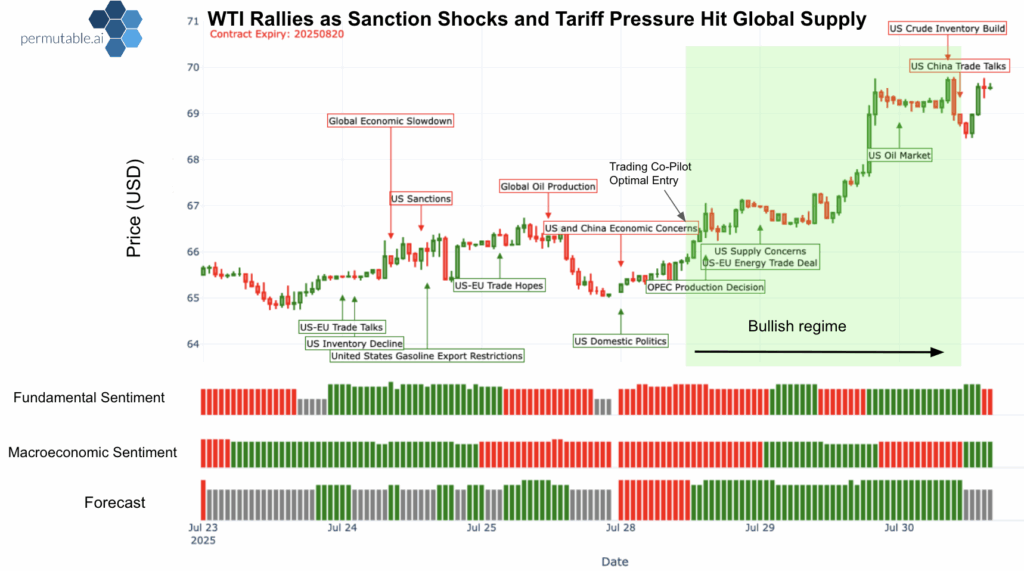
Our Trading Co-Pilot identified the optimal entry ahead of the breakout, driven by macro and sentiment alignment.

Our Trading Co-Pilot Captures the Regime Shift

Our Trading Co-Pilot identified a bullish regime shift in WTI, marking the point where escalating policy risk and rising sentiment momentum converged. The signal preceded a sharp upward move, offering clients a well-timed entry as the market transitioned into a sustained rally.

Key Movements

  • 28–29 July: WTI rallied from $66 to $69 after U.S. inventory draws and the transatlantic energy pact announcement.
  • 30–31 July: Prices dipped briefly on upside inventory surprises from EIA and API data.

While our Trading Co-Pilot’s bullish forecast reflects strong directional conviction, risks remain. Inventory build-ups and surging output confirmed by the EIA and API continue to place downward pressure on sentiment, and a proposed reintroduction of Venezuelan exports under Chevron waivers may temper further upside. Still, trade policy remains the dominant driver in the near term.

TTF Natural Gas:  Heatwaves and Supply Friction Lift Prices Despite Structural Softness

Dutch TTF gas prices rose from €32.10 to €34.90, driven by a combination of heatwave-related demand, short-term supply constraints, and speculative positioning. However, the rally appears increasingly detached from underlying fundamentals, with structural weakness continuing to weigh on the broader European gas market.

Heatwave Impact: Cooling Demand Drives Short-Term Surge

Extreme heat across Europe boosted short-term gas consumption and triggered speculative activity in power markets. Prices opened at €34.72 on 30 July, buoyed by headlines highlighting U.S.–EU LNG cooperation. Still, recent EIA data showed a drop in Dutch spot prices earlier in the month, reinforcing the view that the rally is regionally concentrated and sentiment-driven.

Supply Strains

  • Norwegian gas output declined for a fourth consecutive month.
  • UK storage builds slowed, tightening near-term balances.
  • Qatar signalled potential LNG disruptions due to maintenance risks.
  • China increased Russian pipeline uptake

While these constraints triggered upward price pressure, they are cyclical rather than structural long-term supply weakness.

Demand Headwinds: Structural Softness Still Dominates

  • Dutch gas-fired generation fell to multi-year lows.
  • EU industrial demand remains weak.
  • LNG import expansion is constrained by regulatory and infrastructure delays.
TTF gas
Our Trading Co-Pilot anticipated the sentiment-driven move, distinguishing short-term volatility from longer-term demand weakness.

Our Trading Co-Pilot Captures the Rebound

Our Trading Co-Pilot issued a timely entry just under €32.5 mark, detecting upbeat sentiment around weather risks, LNG bottlenecks, and regional supply pressures. The decisive signal positioned clients well ahead of TTF’s rebound towards €35.

Global Energy Markets: The Road Ahead

Recent price action across Brent, WTI, and TTF reflects a market increasingly shaped by political risk, regulatory intervention, and shifting global alignments. As energy markets move further away from traditional fundamentals, traders must adapt to a more volatile, policy-sensitive environment.

Bullish Catalysts

  • Enforcement of secondary sanctions on Russian or Iranian oil
  • LNG disruptions from Qatar, Hormuz, and U.S. terminals.
  • Continued weather driven demand surges in Europe or Asia.

Bearish Headwinds

  • U.S. crude builds and refinery throughput spikes.
  • Venezuelan supply returns and ramping up of OPEC+ deliveries.
  • Further demand weakness from China and a slowdown in Eurozone industrial output.

Where Signal Meets Strategy

This week’s rally across Brent, WTI, and TTF reflects a market increasingly driven by geopolitical risk in energy markets. Traders are no longer reacting solely to supply and demand data, but to policy shifts, enforcement threats, and macroeconomic volatility.

Our Trading Co-Pilot identified these inflection points in real time, blending sentiment analytics, macroeconomic filters, and policy signals into clear, actionable trade calls. Rather than relying on hindsight, our Trading Co-Pilot tracks evolving conditions as they unfold, enabling well-timed entries and exits with conviction. The result is enhanced clarity and precision in trade execution, cutting through market noise and volatility across global energy markets.

To request a demo or speak to one of our team, simply email enquiries@permutable.ai 

Inside our newly redesigned macro newsletter – and why every institutional investor needs it

In a world where market-moving information travels at the speed of light, the difference between profit and loss often comes down to having the right intelligence at precisely the right moment. That’s where our Permutable Insights Weekly macro newsletter comes in – a weekly briefing of our real-time intelligence for institutional investors who refuse to let alpha decay cost them profitable opportunities.

Beyond traditional market commentary

Traditional macro newsletters follow a predictable pattern: they analyse what happened last week, offer commentary on established trends, and provide educated guesses about what might come next. But in today’s hyperconnected markets, by the time conventional analysis reaches your inbox, the primary positioning opportunities have often passed. Our redesigned macro newsletter operates on an entirely different paradigm – we reveal how our market intelligence surfaced the signals before they became consensus.

Over the past year, our 3000+ and growing subscriber base has had a ringside seat, being walked through how our live market intelligence called Bitcoin’s surge to record heights at $123,000 to the Iran-Israel conflict that drove Brent crude from $69 to $74 ahead of time. This has all been through our macro newsletter which has provided a lens into how our market sentiment intelligence has consistently identified inflection points hours – sometimes days – before traditional indicators caught up.

Bitcoin bullish regime

Sanctions, tariffs and geopolitical risk

This was a key theme we explored in our recent newsletter editions, examining how oil and gas markets have begun moving not on inventory or consumption data, but on diplomatic signals, sanctions rhetoric, and regulatory alignment. As we highlighted to our subscribers, this represents a new regime shift where political risk now trumps traditional supply-demand narratives.

In our recent coverage, we walked subscribers through how our Trading Co-Pilot identified bullish momentum signals across WTI, Brent, and TTF, aligned with sudden changes in sentiment around sanctions, tariffs, and cross-border energy flows.

Brent Crude

Previewing our Political Tension Index

As we detailed in our recent newsletter analysis, geopolitical instability isn’t cyclical anymore – it’s systemic. Our 12-month Political Tension Index, which was featured in Trader’s Magazine, reveals deepening negative sentiment across global leadership narratives, trade policies, and regional unrest. Through our newsletter, we’ve shown subscribers how our real-time AI signals help front-run political shocks before they price in.

Our newsletter featured analysis of our Political Tension Index over the past 12 months, highlighting key global political flashpoints including US shutdown risks, tariff disputes, and high-profile leadership conflicts. As we explained to subscribers, this type of structured intelligence enables institutional investors to quantify political risk in real time and adapt strategies proactively.

Real-time intelligence that predicts market moves 

The engine behind our macro newsletter is our proprietary AI-driven intelligence platform, powered by 22 distinct macro indices including our War Sentiment Index, Trade Sentiment Index, and Political Tension Index. These aren’t simple keyword-matching tools – they represent sophisticated LLM-driven systems that process thousands of articles daily, understanding context, evaluating source credibility, and weighing geopolitical significance with analyst-grade precision.

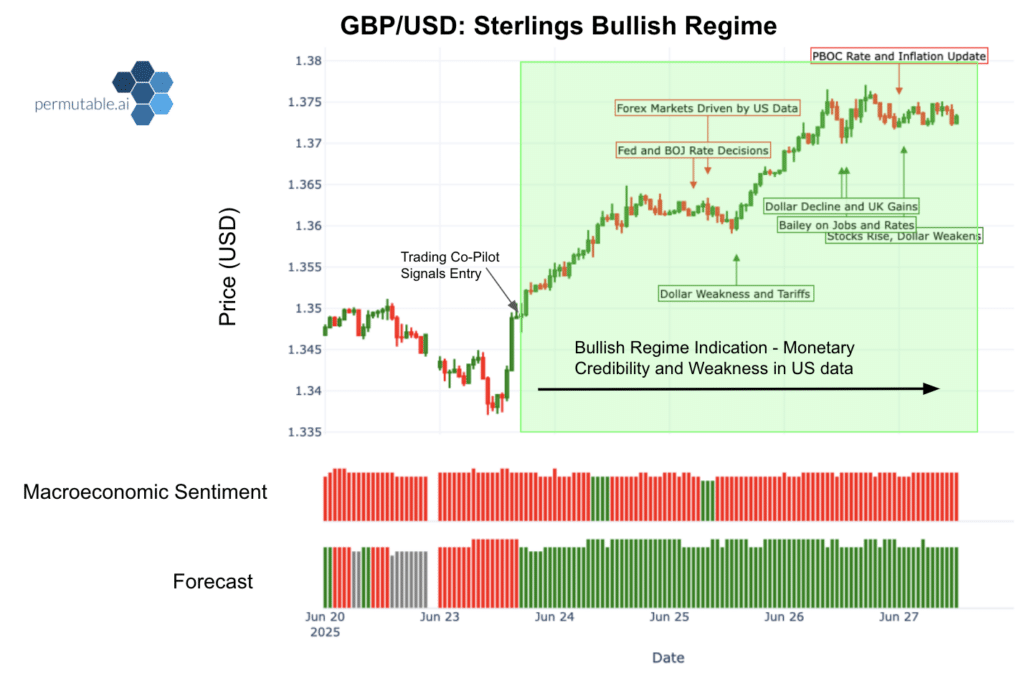
Consider our recent coverage of Sterling’s rally to 1.3740 against the dollar. While traditional FX analysis focused on interest rate differentials and economic data, our macro newsletter identified the narrative shift weeks earlier – processing divergent central bank communications and cross-referencing macro sentiment patterns that conventional analysis completely missed. 

GBP USD forecast
subscribe to our macro newsletter

What sets our macro newsletter apart

Our Insights Weekly operates on three core principles that distinguish it from every other macro newsletter in the institutional investment space:

Through The Lens of Our Intelligence: In every issue, we walk our readers through exactly how our Trading Co-Pilot saw what was happening in real-time, and more importantly, what was coming next – a perfect example here looking at the correlation between Fed rate cuts and Market Sentiment Volume which will be going out in next week’s newsletter. 

Cross-Asset Signal Correlation: Modern markets don’t respect traditional sector boundaries. A supply chain disruption in Southeast Asia impacts European automotive stocks, copper futures, emerging market currencies, and high-yield credit spreads simultaneously. In our macro newsletter, we make light of these  these interconnected signals, ensuring subscribers receive comprehensive intelligence rather than fragmented sector-specific alerts.

Actionable Implementation Guidance: In our macro newsletter, we also explore implementation pathways. Whether you’re managing systematic strategies, discretionary portfolios, or risk management frameworks, we provide the specific intelligence you need to translate signals into profitable positioning.

Institutional-grade analysis for serious investors

Our macro newsletter is fast becoming essential reading for portfolio managers at multi-billion dollar systematic funds, commodities traders at Tier 1 investment banks, and CIOs managing multi-strategy operations.  Every edition of delivers comprehensive coverage across the themes that matter most to institutional investors. Recent issues have explored Bitcoin’s transformation from speculative asset to institutional treasury holding, Japan’s economic crossroads as political instability challenges its safe-haven status, and the systematic impact of trade sentiment on multi-asset portfolio performance.

But beyond individual market calls, our macro newsletter provides strategic intelligence on the evolving landscape of institutional investment management itself. From avoiding multi-asset alpha decay through real-time intelligence integration to understanding how AI-driven sentiment analysis is becoming standard practice for professional trading operations.

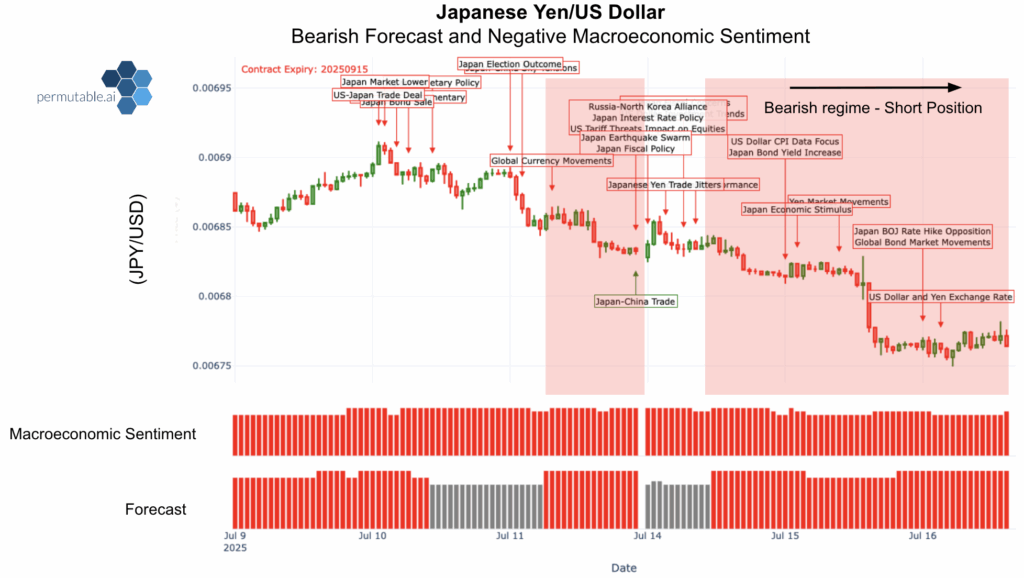
Japan's economy

Your edge in an increasingly complex world

The financial markets of 2025 demand far more than traditional analysis can provide. Geopolitical tensions drive commodity volatility, central bank communications move currencies before policy changes, and narrative shifts determine asset allocation flows across global portfolios. Our macro newsletter provides the real-time intelligence infrastructure necessary to navigate this complexity successfully.

With 3000+ followers already relying on our market intelligence across LinkedIn, and institutional clients showing consistently growing appetite for our market events intelligence, our Insights Weekly is establishing itself as the essential macro newsletter for serious institutional investors.

Now the question isn’t whether AI-driven market intelligence will become standard practice – it’s how quickly you’ll integrate these capabilities into your investment process before your competitors do. Subscribe to Permutable Insights Weekly and discover how to transform uncertainty into actionable opportunity.

subscribe to our macro newsletter

Bitcoin outlook 2025: Robust institutional momentum, supportive macro tailwinds, and improving risk appetite

In this article, we explore how macroeconomic catalysts, institutional flows, and real-time sentiment intelligence are shaping the Bitcoin outlook in 2025, positioning it as a strategic asset within diversified portfolios.

Bitcoin’s rally through July has once again captured attention, climbing to fresh record highs between $117,000 and $123,000, surpassing Gold as the top asset for 2025. But beyond the headline figures, the Bitcoin outlook is being shaped by deeper structural forces. A softer US dollar, surging equity markets, and rising institutional allocations are driving a decisive reappraisal of Bitcoin’s strategic role in portfolios.

Our Trading Co-Pilot has been tracking this market sentiment shift in real time. Its signals are clear – investor conviction is rising, and risk appetite is firmly back in play.

Macro Pivot: The Return of Risk Appetite

The macroeconomic backdrop has become increasingly supportive of risk-aligned assets. Inflation has softened, consumer demand remains robust, and the Fed has adopted a more dovish tone. Markets have moved past questioning if the Fed will cut rates, the focus is now on when the first cut will arrive in 2025.

Meanwhile, US Treasury yields have eased, and the dollar has weakened due to trade frictions and fiscal concerns. These shifts have reignited demand for alternative assets.

Our Trading Co-Pilot flagged these early: sentiment surged around Fed Chair Powell’s political risk, fiscal deterioration, and crypto legislation momentum, including Trump’s backing of the GENIUS Act and stablecoin regulations.

These macro shifts have highlighted Bitcoin’s growing appeal as a hedge against fiat credibility concerns and political pressure on central banks.

Trading Co-Pilot Signals: From Bullish Breakout to Caution

A bullish sentiment shift was detected by our Trading Co-Pilot as early as 8 July, driven by falling inflation expectations, dovish Fed language, and accelerating institutional inflows.

By 14 July, Bitcoin hit $123,000. But as signals approached overextension, our Trading Co-Pilot indicators shifted to neutral ahead of 15 July, anticipating consolidation and profit-taking.

The system also flagged risk events like government BTC sales and large whale transfers before they impacted price, enabling institutional users to adjust in real time.

Bitcoin bullish regime
Trading Co-Pilot View: Fundamental and sectoral sentiment turned decisively positive in early July, supporting Bitcoin’s ascent to a record high of $123,000. Our Trading Co-Pilot detected these conditions in real time, issuing a bullish ‘Buy’ signal from 8th to 14th July, accurately anticipating the rally amid improving risk appetite, dovish macro signals, and institutional inflows.

Institutional Momentum: Bitcoin’s Financial Recognition

Bitcoin is gaining traction as a mainstream financial instrument, as demonstrated by a surge in institutional flows during July 2025. The chart below, titled Bitcoin: Bullish Regime and Pivot, illustrates a sharp rise in volume and price on 14 July, which coincided with major sentiment-driven news and institutional announcements.

Key institutional developments included:

  • MicroStrategy and Grupo Murano expanding their BTC treasury allocations.
  • JPMorgan and other lenders offering BTC-backed credit facilities.
  • ETF holdings across U.S. vehicles surpassing $50 billion, highlighting sustained demand.

These moves signal a broader shift in market perception. Bitcoin is no longer treated as a speculative asset but is increasingly recognised as:

  • Institutional-grade collateral
  • A macroeconomic hedge
  • A strategic portfolio diversifier
Bitcoin price activity
Bitcoin market activity surged, as BTC price spiked to $123,000 on 14 July alongside an influx of volumes, driven by institutional momentum. As sentiment peaked, the market pivoted to consolidation, with lower volumes and stabilising price action.

Crypto Regulation: From Friction to Foundation

The GENIUS Act, signed into law on 18 July, marked a watershed moment. It mandates hard-asset reserves for stablecoins, routine audits, and institutional clarity.

Our Trading Co-Pilot detected a sentiment rally post-signing, as regulatory friction gave way to infrastructure. Regulation is no longer seen as a headwind, but as the foundation for scalable institutional adoption.

Rotation Signals: Ethereum Gains, Bitcoin Pauses

Following Bitcoin’s July rally, Trading Co-Pilot flagged a rotation toward Ethereum and layer-1 alternatives:

  • Bitcoin as a reserve asset
  • Ethereum as infrastructure
  • Altcoins as thematic and yield-oriented plays

Post-15 July, the Trading Co-Pilot’s neutral signal helped clients tactically rebalance without fully exiting digital markets.

Volatility Repriced: Sentiment Resilience Amid Shocks

Volatility remains, but institutional confidence has matured. Major reported selloffs, including talks of UK government budget fix and $1bn whale transfers, failed to derail sentiment with our Trading Co-Pilot detecting stability throughout.

Throughout, ETF inflows remained strong, with over $7bn added in one July week. To add to this, Sequans’ decision to hold BTC in treasury signalled continued structural demand.

Day-by-Day Breakdown:  Drivers and Signals

Our Trading Co-Pilot revealed how sentiment, headlines, and price moved in tandem through July. The chart below presents a clear timeline of daily highs, lows, volume, and key market commentary, emphasising how sentiment shifts closely mirror intraday dynamics.

bitcoin timeline 2

1. Price Action Anchored by Sentiment Floors (7 – 14 July)

  • Macro optimism and institutional flows lifted BTC above $123k to record high.
  • Volume spiked to $181bn on 14 July alongside MicroStrategy news.
  • Our Trading Co-Pilot flagged overextension ahead of a sentiment shift.

2. News-Driven Volatility and Sentiment Divergence (15 – 18 July)

  • Regulatory headlines, Fed signals, and whale transfers drove volatility.
  • Momentum faded despite bullish news flow.
  • Prices ranged between $115k – $120k amid uncertainty.

3. Rotation, Caution, and Consolidation (19 – 22 July)

  • ETH rotation and miner selling limited BTC upside.
  • Sentiment held firm as our Trading Co-Pilot signals stayed firm.
  • Bullish forecast pivot returned on 22 July after Grupo Murano’s large BTC acquisition.

Bitcoin Outlook: Consolidation, Confidence, and What’s Next

Bitcoin has found support near $117k, but conviction is cooler. Institutional activity remains robust, but inflows have normalised.

With real yields falling and the dollar softening, Bitcoin’s long standing perception as a gamble is fading, now being aligned as an institutional-grade asset that responds to policy pivots and sentiment signals. Looking ahead, the Bitcoin outlook remains highly sensitive to macro catalysts, ETF flows, and sentiment shifts.

Will You See the Signal in Time?

This is not the Bitcoin of 2021. Institutional flows, macro shifts, and regulation are now the primary drivers influencing the Bitcoin outlook.

Our Trading Co-Pilot has continually demonstrated its value in identifying regime shifts, capturing inflection points, and translating macro noise into clear signals.

Another market pivot is on the horizon. The only question is, will you see it in time?

To learn how our Trading Co-Pilot delivers real-time intelligence for institutional strategy, contact our team at enquiries@permutable.ai

Commodity prices: Cross-asset analysis – mid-February 2025 outlook

As we move into mid February, the obvious pattern emerging across commodity markets is that of an intensifying impact of trade tensions and extreme weather events. There is no doubting that each commodity class is responding uniquely to these catalysts, creating a complex trading environment that demands sophisticated analysis. In this article, we take a look at the commodity prices outlook for this week, using analysis from our Trading Co-Pilot.

Energy markets 

Henry Hub natural gas

You can make the argument that this has been the most dramatic mover in terms of commodity prices, with a 9% surge on February 3rd reaching significant technical levels. The hardest part is distinguishing between weather-driven spikes and structural shifts. Severe winter storms across the Midwest and Northeast have created a significant uptick in energy demand, while critical supply shortfalls in southern regions reinforce bullish momentum. Current Henry Hub market dynamics suggest this strength could persist beyond the immediate weather impact. Regional supply constraints and increased demand for gas-fired power generation create a supportive backdrop for prices. The question is how long these conditions will maintain their influence over price action, particularly as we approach the shoulder season.

TTF natural gas

Then there is the challenge of European gas markets, where prices reflect multiple pressures. Slovakia’s increased imports and resumed Russian gas flows provided initial stability, but escalating Ukraine conflict creates persistent uncertainty. Critical gas needs in southern Ukraine add another layer of complexity to the supply picture. The market’s response to these developments has been notably volatile, with traders attempting to price in both immediate supply concerns and longer-term structural changes to European gas markets. Supply diversification efforts, including rare Australian shipments, indicate the market’s adaptation to new geopolitical realities.

Heating oil

Looking an the broader issue of commodity prices, one finds that the situation is little more complicated in heating oil markets, where tariffs on Canadian oil combine with extreme weather to drive prices higher. The fact that NYC landlords are switching to less clean heating oil due to high gas bills indicates a structural demand shift that could have lasting implications for the market. This transition in consumer behaviour, particularly in the Northeast, suggests a fundamental change in regional energy dynamics. The impact of tariffs extends beyond immediate price effects, potentially reshaping traditional supply routes and trading patterns. Storage levels and distribution challenges in key consumption areas add another layer of complexity to the current market structure.

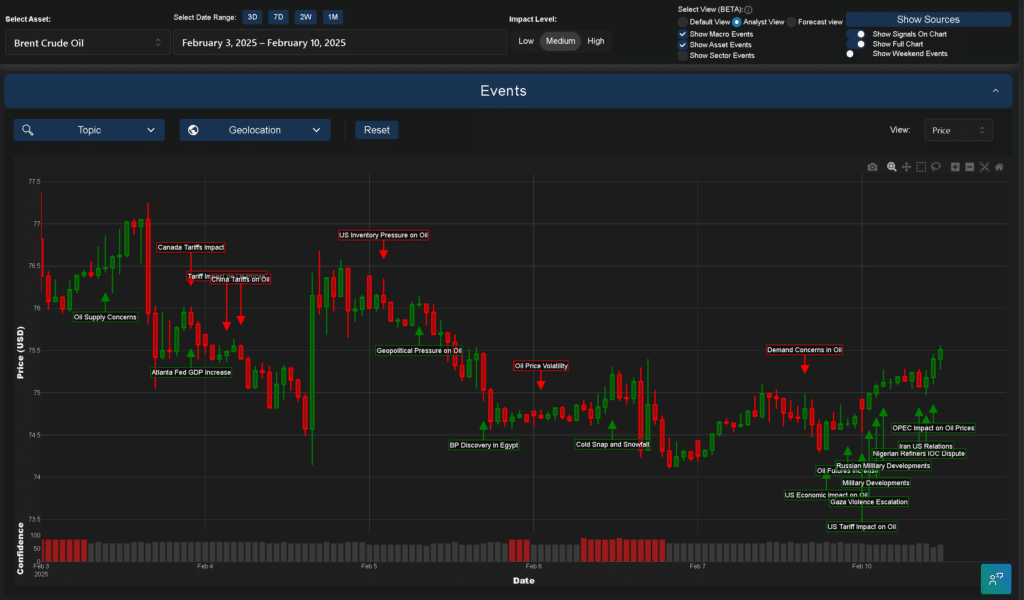
Brent Crude

Of course,  recent cold snaps in the US have supported prices, countering earlier bearish sentiment. Meanwhile, ongoing military tensions in Ukraine and Middle East sanctions continue to influence supply concerns, despite rising inventories in key storage hubs. The market’s reaction to these conflicting signals has been notably measured, suggesting traders are carefully weighing immediate weather-driven demand against broader macroeconomic concerns. The interplay between OPEC+ output decisions and US inventory builds creates an additional dynamic that warrants close monitoring.

Metals market

Gold

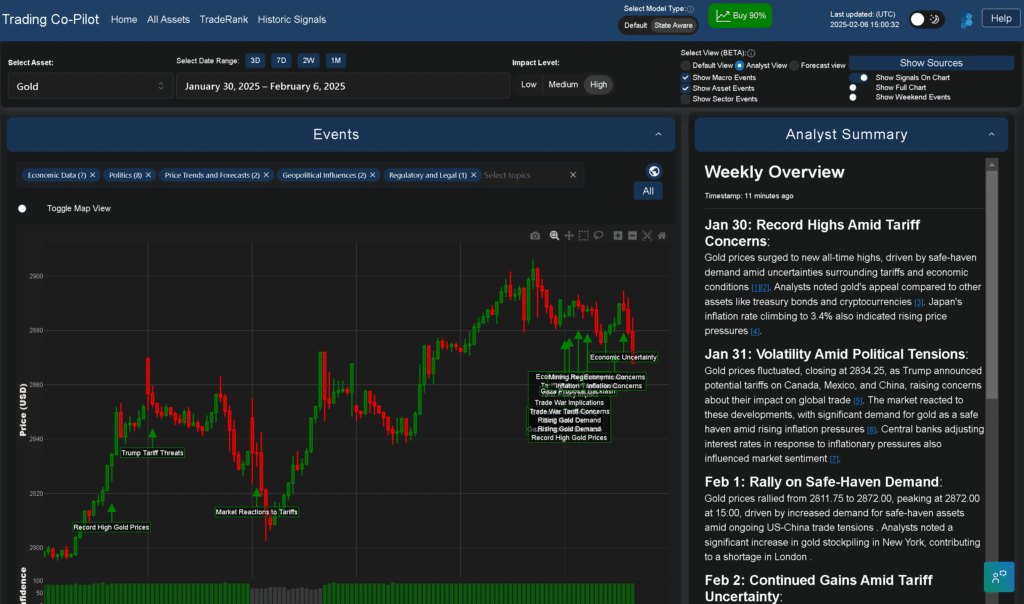
The big recent news across commodity prices is that gold continues to see remarkable strength near $3,000. The game changer here has been combined monetary easing signals from central banks (RBI and BOE) alongside escalating geopolitical tensions. Safe-haven demand remains robust amid uncertain economic conditions. Technical analysis suggests the current price levels could establish new support zones, particularly if trade tensions escalate further. The correlation between gold prices and real yields continues to provide a helpful framework for understanding price movements, while physical demand from key Asian markets adds fundamental support.

Platinum

Here, we’re seeing the impact of China’s manufacturing slowdown (PMI at 50.1) combined with Anglo American Platinum’s profit decline. The automotive sector’s weakness, particularly in Germany, has created significant headwinds for demand, leading to the current bearish outlook. Supply-side dynamics, including potential production cuts and recycling rates, could provide some price support. However, the structural shift in automotive technology preferences continues to cast a shadow over longer-term demand prospects.

Palladium

The question here is whether positive US manufacturing data can offset European automotive weakness. This divergence in regional industrial activity creates a complex trading environment for a metal heavily dependent on automotive catalytic converter demand. Recent market behaviour suggests a delicate balance between supply constraints and demand concerns. While US economic resilience provides some support, the German industrial production drop signals potential weakness in a key consumption center. For now, the automotive sector’s ongoing transition toward electric vehicles adds another layer of uncertainty to longer-term demand projections.

Silver

Despite initial bullish signals from strong demand and positive drill results, inflation fears and trade tensions have created choppy trading conditions for silver. The metal’s dual role as both an industrial and precious metal continues to create complex price dynamics. While safe-haven demand provides some support during periods of market stress, industrial demand concerns and correlation with gold prices remain key drivers of market sentiment for silver.

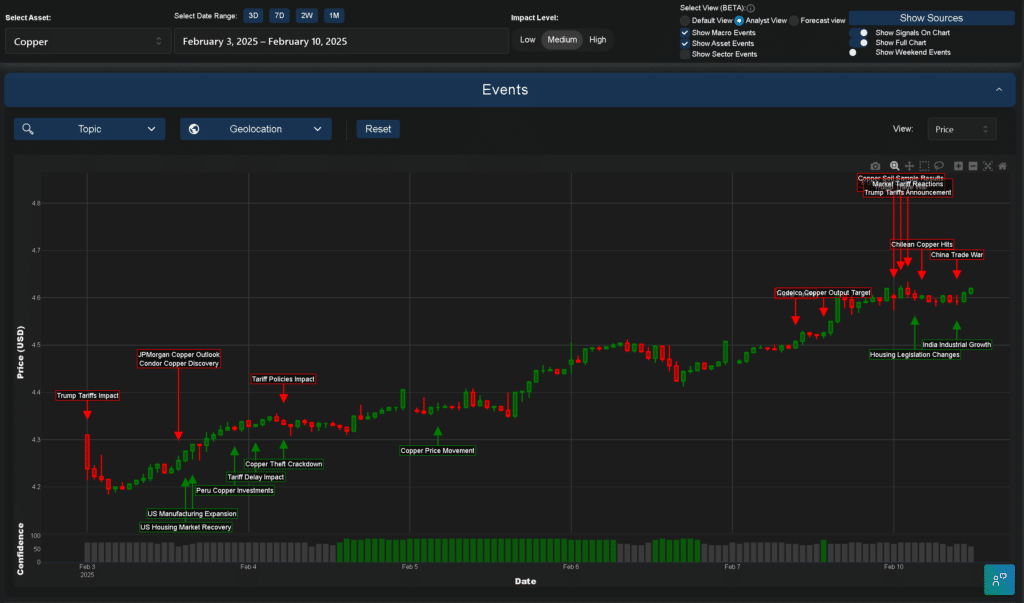
Copper

While housing market recovery provides some support, trade tensions create significant uncertainty for copper. Recent price movements reflect the market’s struggle to balance positive economic indicators against rising geopolitical risks. The broader implications of Trump’s reciprocal tariffs could fundamentally alter trading patterns in industrial metals. Concurrently, infrastructure development plans in key economies remain a potential catalyst for demand growth, but uncertainty around implementation and timing keeps market sentiment cautious.

copper commodity prices feb 2025

Agricultural markets 

Wheat

Initial bullish momentum in wheat markets driven by severe weather disruptions – drought in Argentina and flooding in Australia – has given way to bearish sentiment as of February 10th, with Chinese tariffs and fears of US retaliation creating significant headwinds. Growing Canadian stocks and increased local production suggest ample supply, while forecasts of declining global imports add further pressure. This alignment of negative factors suggests continued downward pressure on wheat prices in the near term, despite earlier weather-related supply concerns. 

Coffee 

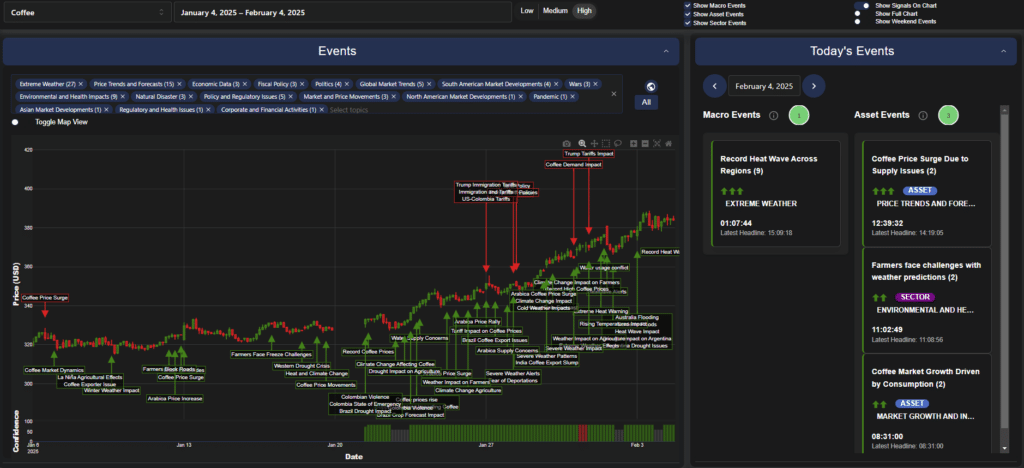
We live in an age of highly volatile geopolitics and commodity prices, with coffee prices have reached record highs driven by fundamental supply fears and severe weather impacts. Arabica’s recent price action reflects both immediate supply constraints and longer-term structural changes in production patterns. Nestlé’s Indian market expansion signals growing demand in emerging markets, while weather-related supply disruptions continue to support prices. The potential for further supply chain disruptions, particularly in key growing regions, suggests continued price strength in the near term.

Corn

The present outlook for corn reflects complex crosscurrents in both supply and demand. Argentina’s severe drought has tightened supply expectations, while Mexico’s decision to rescind its ban on U.S. biotech corn provides some positive sentiment for traders. However, the broader impact of trade tensions and potential new tariffs creates significant headwinds. Fund positioning indicates some market confidence, but recent declines in Chicago corn futures suggest traders remain cautious amid these conflicting signals.

Cotton

Cotton markets are facing multiple challenges from both weather events and trade tensions. Queensland flooding and California’s adverse weather conditions raise significant concerns about agricultural productivity and potential supply shortages. The market’s recent rally gave way to more cautious sentiment as traders assessed the implications of new U.S. tariffs on China. These developments raise broader concerns about inflation impacts and potential demand destruction in key consumption markets.

Sugar

The sugar market presents a particularly nuanced picture amid current volatility. Once again, severe flooding in Queensland and ongoing drought challenges in Argentina have raised serious concerns about agricultural output and potential supply disruptions. While temporary support came from reduced Indian production and improved realisations for sugar companies, the stronger US dollar and projections of a global surplus create counterbalancing pressures. Recent developments suggest potential for recovery, but weather concerns and mixed economic indicators maintain market uncertainty.

Milling wheat

Markets have now  pushed to four-month high levels amid severe flooding in North Queensland and ongoing Ukraine-Russia supply disruptions. The impact of these weather events on global supply chains has been particularly acute given the already strained market conditions. The announcement of retaliatory tariffs by China and Trump’s reciprocal measures adds another layer of complexity to traditional trading patterns. While some weakness emerged towards the end of the week, the overall trend remains bullish as markets continue to price in supply risks and shifting trade flows.

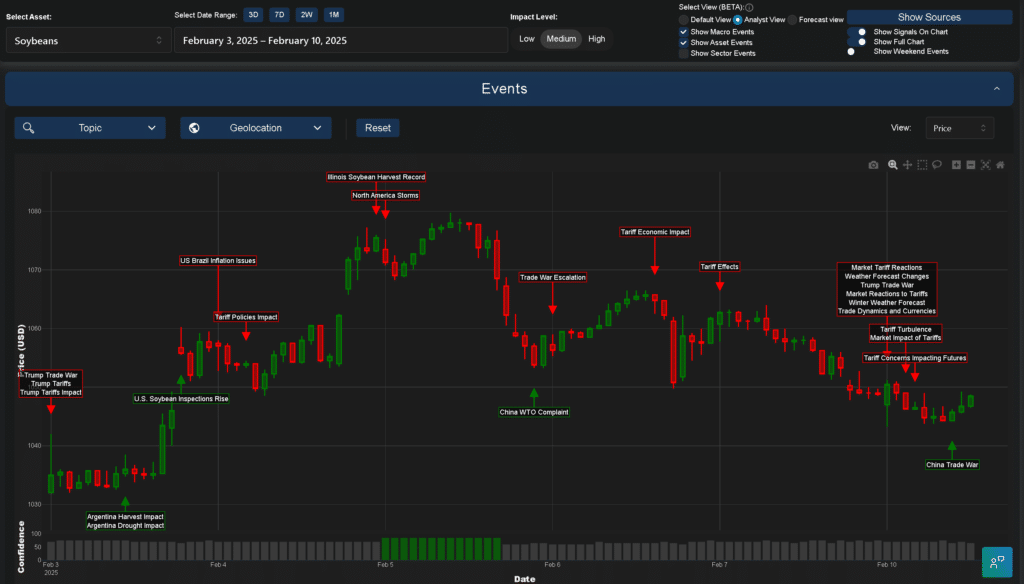
Soybeans

There are several areas where trade tensions impact is evident, none more so than soybeans. Recent tariff announcements have amplified bearish sentiment, with prices declining as traders anticipate further volatility and potential supply chain disruptions. This dovetails with weather-related concerns in Argentina and North America, creating a complex market dynamic. The combination of trade uncertainty and adverse weather conditions suggests continued pressure on prices, with particular attention needed on Chinese demand patterns and South American production levels.

Looking ahead on commodity prices 

If narratives shape politics, then current trade tensions suggest continued market volatility across commodity sectors. What this reveals is the increasing importance of real-time market intelligence in navigating these complex conditions. Commodity traders must remain vigilant to both immediate catalysts and longer-term structural shifts, particularly as weather patterns and geopolitical developments continue to drive price action.

The interconnectedness of commodity markets has never been more evident, with developments in one sector frequently creating spillover effects in others. Successful trading strategies will require careful monitoring of cross-commodity correlations by using tools like our Trading Co-Pilot and the ability to quickly adapt to changing market conditions.

Get ahead of commodity price movements

Our Trading Co-Pilot can enhance your commodity trading operations with real-time cross-asset insights. It works by analysing the complex interplay of weather events, trade policies, and supply chain dynamics as well as other market factors across energy, metals, and agricultural markets, helping you identify price movements before they emerge. Our enterprise solution offers real-time analysis of market-moving events, cross-commodity correlation insights, early warning signals for price movements, and comprehensive monitoring of supply chain announcements, weather impacts, and trade flows.

To arrange a demo or request a free enterprise trial get in touch with our team at enquiries@permutable.ai or simply fill in the form below to see how our AI-driven market intelligence can complement your existing trading strategies. We’re currently offering a 14-day trial for qualified institutional traders (subject to approval) to experience our next-generation market intelligence . Find out how it can start maximising your trading potential today.

Request demo/free trial


Gold markets: A week of record highs and trade war tensions

All eyes have been on gold markets once again this week, with prices surging to an all-time high of 2902.50.  As geopolitical tensions escalate, for traders  seeking to navigate these volatile conditions, understanding the underlying drivers becomes increasingly key. In this article, we’ll take a lookback at the latest from the gold markets over the last week, with insights from our Trading Co-Pilot.

Trade war tensions and gold markets

Safe to say, that all of this dovetails with growing concerns about Trump’s recent tariff announcements, which has been amplified by deteriorating US-China relations. Only a few days earlier, gold had been trading at 2849.75, but escalating trade tensions pushed prices to new records. It has come to something when even seasoned traders are surprised by the pace of these movements, suggesting a fundamental shift in market dynamics that requires careful analysis.

What is it about gold markets that makes them so sensitive to geopolitical tensions? Both feature in our analysis: safe-haven demand and inflation concerns. Incidentally, the European Central Bank’s recent rate cut has added another dimension to the bullish narrative, creating a perfect storm of supportive factors that continues to drive prices higher.

Market dynamics and supply constraints

For those of us who follow gold markets closely, the emergence of physical supply constraints is also another interesting factor in the mix. A significant shortage in London, driven by increased stockpiling in New York, has emerged. But still, the market continues on, albeit with increased volatility. Trading strategies must now account for these physical market dynamics, which can create unexpected price movements and arbitrage opportunities.

So what, you may think, about these supply constraints? But what’s important to note here is the potential for these shortages to create additional price pressures. These days, the interplay between physical and paper gold markets has become increasingly complex, requiring traders to maintain awareness of conditions in both markets to execute effective strategies.

Gold markets sentiment analysis February 2025

Above: Gold markets sentiment and price drivers using Analyst View of our Trading Co-Pilot

Central bank activity and market impact

And then there has been significant central bank purchases, which reveals an underlying shift in institutional attitudes toward gold. Many will still find it surprising that central banks are increasing their gold reserves at such a rapid pace, particularly given the elevated price levels. This institutional buying provides a strong fundamental underpinning to the market that simply cannot be ignored. 

Obviously, this fact has contributed to the current price levels, principally because of the signal it sends to other market participants about deeper concerns regarding global economic conditions.

Trading patterns and market sentiment

There is, as ever, a strong correlation between geopolitical uncertainty and gold prices, Not merely because of safe-haven demand, but also due to currency market volatility. The answer, it turns out, lies in the complex interplay between various market factors that traders must monitor continuously. And so, understanding these correlations will continue to  provide valuable insights for timing market entries and exits.

Interestingly, the market has maintained relatively orderly trading despite the record prices. And it will be fascinating to see how these patterns develop, particularly if trade tensions continue to escalate with Trump pressing down on nation states. Overall, gold traders will need to pay special attention to volume patterns and market depth, which can provide early warning signals of potential price movements.

Future outlook for gold markets

Looking ahead, gold traders should focus on several key areas. Ongoing trade tensions and tariff concerns continue to dominate sentiment, while physical supply constraints in key markets may create additional volatility. Meanwhile, strong central bank buying activity suggests sustained institutional interest, while increasing safe-haven demand could provide support during periods of market stress. And then there’s the potential for trade policies to generate inflation pressures adds another layer of complexity to the market outlook.

Suffice to say that successful trading in current gold markets requires a comprehensive understanding of all of these factors. Traders will be keeping a close eye on  developments in US-China trade relations – and quite rightly so –  as these continue to drive short-term price movements. Ultimately, changes in central bank buying patterns could signal shifts in institutional sentiment, while physical supply dynamics between London and New York may create arbitrage opportunities. All this means that currency market volatility and inflation indicators provide important context for price movements.

The current situation in gold markets reflects a complex interplay of geopolitical, economic, and market-specific factors. As prices continue to trade near record highs, understanding these dynamics becomes increasingly important for gold and precious metals traders. In the current scenario, the combination of trade tensions, safe-haven demand, and physical supply constraints suggests that volatility may continue in the near term, making careful risk management essential for successful trading outcomes.

Navigating the complexity of gold markets 

And with that, we’d like to invite you to experience how our Trading Co-Pilot can improve your precious metals trading results. Our platform seamlessly integrates real-time analysis of geopolitical events, supply chain dynamics, and market sentiment to provide you with actionable insights across gold, silver, platinum, and palladium markets.

Over a personalised live demo, we’ll help you discover how our AI-driven platform can enhance your trading operations and how we’re already  Our helping institutional traders identify emerging opportunities, manage risk more effectively, and stay ahead of market-moving events. For qualified enterprise clients, we’re currently offering a 14-day trial of our platform, allowing you to experience firsthand how our advanced analytics can complement your existing trading strategies.

Simply get in touch with us at enquiries@permutable.ai or scheduling a demonstration by filling in the form below and be part of a group of early adopter trading houses who are already using our next-generation market intelligence to navigate the evolving commodities trading landscape.

Request a demo


Factors affecting coffee prices: A deep dive into the recent market rally

Understanding the factors affecting coffee prices has never been more key, especially as we look at the recent coffee market rally when coffee prices began their  ascent towards 400 USD. According to our Trading Co-Pilot’s analysis, multiple interconnected factors drove this surge, creating a complex web of market influences that continues to shape the coffee trading landscape. Understanding these dynamics offers valuable insights for commodity traders, producers, and industry stakeholders alike. In this article we’ll take a closer look at the events that led to this historic milestone.

factors affecting coffee prices

Climate and weather: A primary factor affecting coffee prices

This year has brought unprecedented weather challenges to major coffee-producing regions. The trail of blood between severe weather events and price volatility has never been more apparent. A record heat wave across key growing areas marked a turning point in market sentiment, pushing prices above key resistance levels, whilst drought conditions in Brazil, the world’s largest producer, exacerbated supply concerns. Traders monitoring these weather patterns will have found significant predictive value in tracking regional climate anomalies.

For the initiated, these weather patterns represent more than temporary disruptions amongst the factors affecting coffee prices. Whether it is these factors or longer-term climate change impacts, the coffee market faces structural challenges that could reshape pricing dynamics for years to come. Around the same time, flooding in parts of South America further complicated the supply picture, creating opportunities for traders who could accurately forecast weather impacts on production.

Supply chain dynamics and trade policy

The rivalry between major coffee-producing nations has intensified amid supply constraints, emerging as another crucial factor affecting coffee prices. In contrast to previous years, trade policies have taken centre stage. This is not a new revelation, but the impact of Trump-era tariffs and immigration policies looming over the market has added new complexities to coffee trading, requiring stakeholders to develop more sophisticated risk management strategies.

For some, this represents a fundamental shift in how coffee supply chains operate. The narrative picked up momentum when labour shortages began affecting harvesting operations. And there it sat, creating a bottleneck in the supply chain that rippled through to prices, offering opportunities for traders who could anticipate these disruptions.

Market demand: A key factor affecting coffee prices

Despite the challenges on the supply side, demand has played an equally key role among factors affecting coffee prices. Sometimes the problem lies in the changing consumption patterns across different markets. There is debate about whether these shifts represent temporary or structural changes in coffee consumption habits, with important implications for long-term price trends.

It is viewed as a potential game-changer that developing markets are showing increased appetite for premium coffee varieties. Will this last? Sentiment around coffee consumption remains strong, particularly in emerging markets where coffee culture continues to evolve, creating new opportunities for market participants.

Agricultural and production dynamics

Then there is what some would regard as the core issue: agricultural productivity as a factor affecting coffee prices. It is an experience that included both technological advances and setbacks. In the past few years, we have had a real-life experiment in how climate change affects coffee farming practices. And this is the other thing about modern coffee production: sustainability has become inseparable from pricing discussions, influencing investment decisions and risk assessments.

Economic and currency impacts

There may be something in that old saying about commodity prices and dollar strength. As we write, currency fluctuations continue to influence coffee trading patterns. There is the good, the bad, and the ugly about how exchange rates affect producer revenues and market pricing, making currency risk management an essential skill for market participants.

Both are on the radar screens of traders: inflation concerns and monetary policy shifts. It used to be the case that coffee prices moved primarily on supply-demand fundamentals. Anyway, despite all this, macroeconomic factors now play an increasingly important role, requiring a more sophisticated approach to market analysis.

Practical applications and trading strategies

These factors affecting coffee prices provide several key insights for market participants. To recap:

  • Weather pattern monitoring has become key for predicting price movements
  • Supply chain disruptions offer opportunities for prepared traders
  • Currency risk management is increasingly important
  • Sustainability considerations affect long-term price trends
  • Emerging market demand creates new trading opportunities

Analysing the factors affecting coffee prices requires a holistic understanding of multiple variables. From weather events to geopolitical tensions, from supply chain disruptions to changing consumption patterns, the coffee market continues to evolve in response to both traditional and emerging influences. Understanding and monitoring these dynamics whilst developing appropriate risk management strategies is crucial for success in today’s coffee trading environment.

Ready to improve your cross-commodity trading strategy?

Discover how our Trading Co-Pilot can improve your commodity trading operations by incorporating sophisticated coffee market insights into your portfolio. Our advanced platform seamlessly integrates real-time analysis of weather events, supply chain disruptions, and market sentiment, providing you with the competitive edge needed in today’s complex trading environment. By combining our coffee asset insights with your existing commodity strategies, you’ll unlock powerful cross-market correlation opportunities and gain access to early warning signals that can enhance your decision-making process.

We invite you to experience these capabilities firsthand through a personalised demo tailored to your institution’s specific trading requirements where we’ll show you how our AI-driven market intelligence can complement your existing operations and strengthen your risk management framework. For qualified institutional traders, we’re currently offering a 14-day trial to demonstrate the full potential of our platform in your trading environment.

Take the first step towards maximising your trading potential by contacting our enterprise team at enquiries@permutable.ai or fill in the form below to schedule your demo and join the leading trading houses already leveraging our next-generation market intelligence to stay ahead in the evolving commodity trading landscape.

Request demo