In this article, we examine how Brent’s risk premium evolved between June and July 2026. Permutable’s Brent crude sentiment indices show that the market’s pricing of conflict shifted from the probability of escalation to the viability of the routes carrying Gulf crude. The signal turned bullish before Brent repriced, while the mid-July attacks on the corridor used to bypass Iran’s restrictions help explain why the premium may prove slower to unwind.
Brent broke past the $86 mark on 14 July, the prompt market catching up with a divergence that had already been confirmed in the sentiment data. The overnight strikes on ADNOC’s Al Bahyah and Mombasa B inside Omani territorial waters did more than add a fresh war-risk premium. They ended the market’s complacent relief trade by demonstrating what it had been resting on. For the best part of June, traders had treated the Gulf’s deteriorating security as a passing headache; that view has now capitulated.
Our energy market sentiment indices told the true story in real time. Geopolitics & Conflict turned bullish, followed closely by Policy & Regulation, and the two climbed in tandem as blockades, transit levies and state-guided escorts pressed on the same shipping corridor from opposite directions. The price of passage no longer rests on whether the oil exists, but on whether it can move on terms that underwriters, charterers and shipowners will accept.

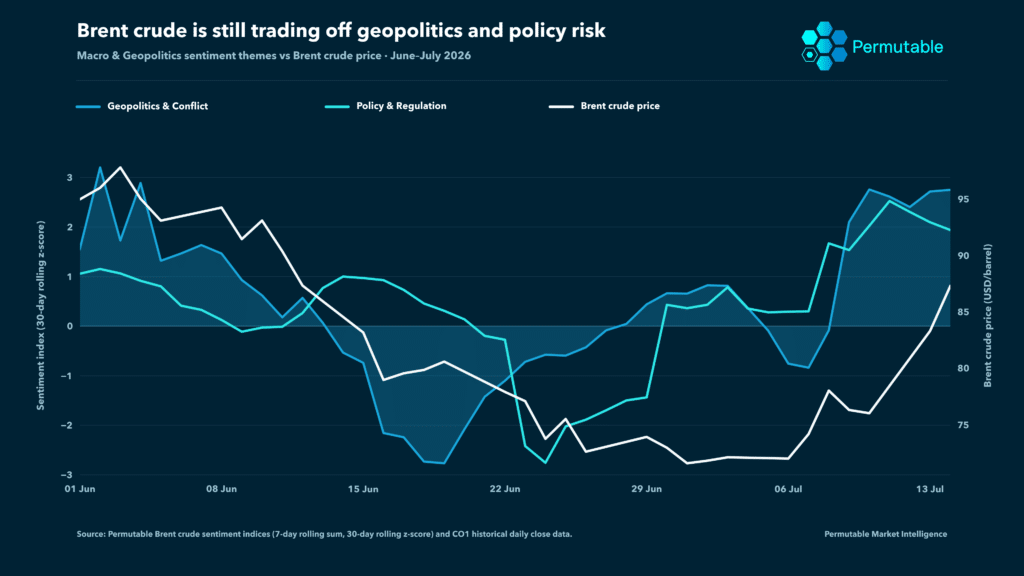
Caption: Brent sentiment began turning bullish in late June while the crude price remained close to its lows. Geopolitics & Conflict recovered first, followed by Policy & Regulation as blockades, tighter transit conditions and attacks on shipping converged on the same export corridor. Brent repriced only after both themes had moved above their recent baselines.
The chart sets two price-directional Brent sentiment themes against the CO1 daily close: Geopolitics & Conflict and Policy & Regulation. Positive readings are bullish for Brent; negative readings are bearish.
A tanker strike is operationally damaging. For Brent, it is bullish when it raises the probability that internationally traded crude will be delayed, rerouted or withheld from the market.
The spring premium was already leaking away like air from a valve by early June. Brent sat in the mid-$90s and Geopolitics & Conflict stood nearly three standard deviations above its trailing norm, but both drifted lower as cargoes kept moving and the disruption looked manageable. Policy & Regulation barely stirred, leaving the premium concentrated in the immediate risk of another strike rather than a lasting restriction on deliverability.
By late June, that relief trade had run its course. Both sentiment themes had fallen close to the bottom of their recent ranges and Brent had eased towards the mid-$70s.
The next turn appeared first in the information flow. Geopolitics & Conflict recovered, followed by a sharper rise in Policy & Regulation as missile strikes, blockade measures and tighter transit conditions accumulated. Brent remained close to its lows, with the market still treating diplomacy as sufficient to contain the disruption.
For several sessions, Brent sentiment became more bullish while the price remained anchored. The indices did not identify the exact day or size of the eventual move. They showed that the ground beneath a $75 Brent was beginning to give way.
The adjustment came in two jolts rather than a glide. Brent jumped 9.6% on 13 July after Washington announced a renewed blockade, then moved above $86 the following day as attacks on shipping and direct US-Iran escalation forced the market to reassess Gulf export capacity.
The more durable shift sat beneath the price. Geopolitics & Conflict pushed sharply above its baseline, capturing the immediate threat to shipping, while Policy & Regulation climbed with it as blockades, transit arrangements and state-guided passage became part of the same trade.
For the first time in the period, both themes were bullish and moving together.
June’s premium rested mainly on the probability of military escalation, a risk that diplomacy can remove quickly. By July, the premium also reflected the terms on which crude could still move: insurance cover, escorted passage, transit restrictions and the willingness of owners to commit vessels.
The price recorded the adjustment. The sentiment indices showed what it was made of.
The two crude carriers struck in the Strait of Hormuz were not trying to break Iran’s restrictions. They were using the route designed to work around them.
ADNOC’s Al Bahyah and Mombasa B were hit by Iranian cruise missiles in the southern lane inside Omani territorial waters. Both vessels caught fire before the blazes were brought under control.
The ships belonged to the ADNOC fleet used to shuttle Gulf crude for transhipment off the UAE and Oman. ADNOC has been among the most active participants in the US military-led effort to keep the southern corridor operating. CENTCOM said the wider operation had facilitated more than 800 vessel transits and over 400 million barrels of crude through the strait during the previous two months.
By striking there, Iran extended the disruption from the main passage through Hormuz to the system sustaining flows around its restrictions.
Traffic data show how narrow that system has become. Since the 12th July, roughly 14 ships of all types crossing Hormuz, as of the 13th this has fallen to 9 ships. When you compare with close to 130 passing the strait a day before the war, it shows the sheer magnitude of the disruption. Within that total, six visible oil and gas tanker transits were recorded, the lowest visible tanker count since late May.
AIS switch-offs mean the observed figures somewhat understates total traffic volumes, but the fall remains severe. More of the surviving flow now depends on escorted movements determined by Trumps levies policy, controlled routings and transfers outside the Gulf.
The southern lane may remain open in a legal or military sense, but commercial access is decided elsewhere. Owners must be willing to nominate vessels, charterers must absorb the extra cost and underwriters must continue providing cover on workable terms.
A lane can remain open on the map while quietly closing on the chartering desks.
An escalation premium can fade in a handful of sessions on a ceasefire, renewed talks or a pause in attacks. Route risk unwinds through evidence: repeated safe transits, falling war-risk premiums, normal fixture activity and clearer rules around the blockade, Iranian transit demands and US-guided passage.
Keeping the two indices separate becomes useful during that unwind. Geopolitics & Conflict captures the immediate probability of attack. Policy & Regulation tracks the framework governing whether crude can continue moving once the immediate threat recedes.
If the conflict signal turns bearish while policy sentiment remains bullish, the premium has not left the market. It has moved into restrictions on deliverability.
Saudi Arabia’s East-West pipeline to Yanbu and the UAE’s link to Fujairah remain the main operational alternatives to Hormuz, but neither can replace the volume that moved through the strait before the crisis.
They shift regional exposure rather than remove it. Yanbu moves crude towards the Red Sea, where renewed Houthi activity has raised the risk around shipping and infrastructure, while Fujairah remains close to the wider conflict zone.
The Cape of Good Hope answers a different problem. It allows vessels to avoid the Red Sea and Suez Canal, but tankers loading inside the Gulf must still pass through Hormuz before beginning the longer journey south.
Flows can be rerouted. The geography they cross cannot.
The downstream system had little slack before the latest attacks. European diesel margins and US refining cracks were at record levels, while Asian diesel, jet-fuel and fuel-oil margins continued to strengthen.
Hormuz is adding pressure to an existing constraint. Russian export restrictions, limited refinery capacity and depleted product inventories had already reduced the market’s ability to absorb another disruption.
The inventory cushion has thinned as well. Global stocks fell sharply between March and June, while combined US crude and product inventories are at their lowest since 2003. The spring shock was cushioned partly through stock draws. That option remains available, but from a weaker starting point.
Who is sailing will matter as much as how many are moving through. A corridor sustained mainly by escorted or state-supported movements would offer weaker evidence of normalisation than the broad return of commercial tankers and LNG carriers.
Brent sentiment can mark the stages of that unwind. Geopolitics & Conflict turning bearish while Policy & Regulation remains bullish would show the immediate threat receding while restrictions on deliverability lingering. Both indices rolling over together would point to broader normalisation.
Until traffic rebuilds, insurance terms soften and the ordinary business of chartering resumes, route risk will remain in the Brent premium.
A Brent move driven by military escalation does not persist in the same way as one reinforced by blockades, transit restrictions and impaired shipping routes.
Permutable’s Energy Indices separate those drivers within the Brent information flow, helping trading, research and risk teams see what is moving the price, how the signal is changing and what would begin to reverse it.
This article analyses how Brent crude sentiment evolved from geopolitical fear to physical supply disruption between February and May 2026, using Permutable’s driver-level energy sentiment indices to track Brent volatility. It explores how macro, supply, logistics, and market-dynamics narratives shaped repricing beneath the surface of price action. The piece is aimed at commodity traders, macro investors, hedge funds, energy analysts, and institutional research teams.
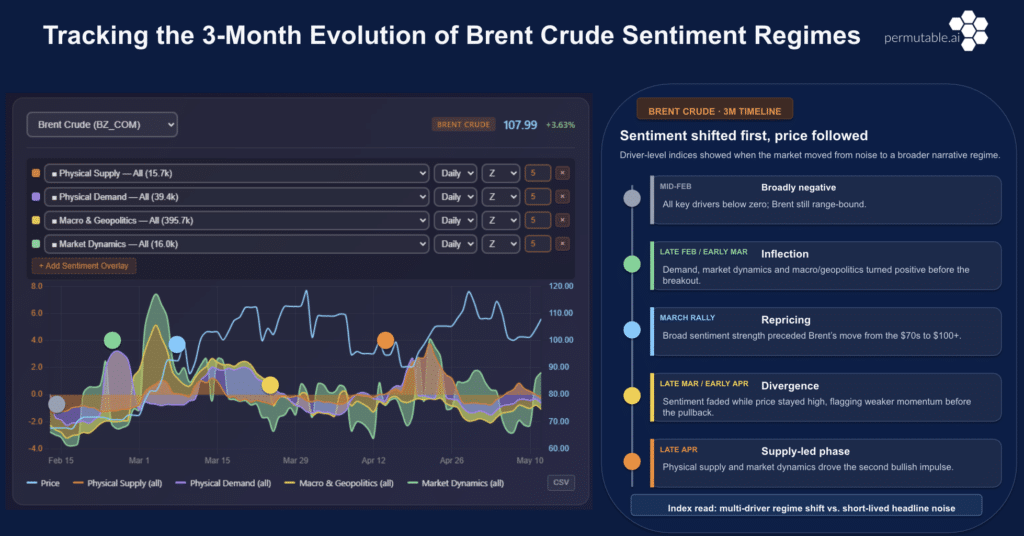
Over the past three months, the market has moved through a sequence of distinct regime phases: broad weakness, early inflection, repricing, divergence and then a supply-led impulse. Price captured the outcome. The sentiment signal showed how the character of the move was changing beneath the surface.
That capturing what’s driving the regime matters. Oil risk premiums are often treated as a single market variable. They are not. A premium built on escalation headlines can fade quickly when diplomacy. A premium rooted in refinery disruption, shipping stress, transit risk and depleted inventories has a different quality being harder to dismiss due to the physical constraint.
This is where driver-level energy sentiment has its edge. Permutable’s systematic energy indices are built from the raw material of global information flow: news and analysis across 75 languages, drawn from tens of thousands of sources that turn unstructured headlines into a processed, topic-tagged, scored for intensity and direction, then mapped to the drivers that matter for energy markets: macro and geopolitics, physical supply, demand and market dynamics.
The result is a structured sentiment signal uncovering which forces are building beneath price, which are fading, and whether the narrative behind a re-pricing is broadening into something more durable or losing the support that first gave it weight.
For Brent, the important signal was not simply that sentiment became bullish. It was how the source of bullishness changed throughout the last few months and tracking this in real time.
The three-month view below shows Brent moving through a clear sentiment sequence. All major drivers were negative in mid-February. Demand, market dynamics and macro/geopolitics then turned positive before the breakout. Broad sentiment strength preceded the March repricing, before a late-March divergence warned that price was holding a premium with weaker narrative support. By late April, physical supply and market dynamics were driving the second bullish impulse.
![]()
Permutable’s intelligence engine tracks how sentiment regimes evolve across physical supply, demand, macro/geopolitical drivers, and market dynamics -revealing when oil market repricing is driven by broad narrative convergence, divergence, or supply-led confirmation before broader consensus forms.
The three-month move in Brent can be read through five distinct phases. That is the value of driver-level sentiment: not simply showing that the market turned bullish, but showing how the character of the move changed as different forces took control.
All the major drivers sat below zero and Brent remained range-bound.
At this stage, there was no durable premium in the market, only fragmented noise. The signal showed a market still lacking narrative breadth: no clear confirmation from demand, macro/geopolitics, physical supply or market dynamics.
This was the pre-regime phase.
The first turn beneath the surface. US-Iran escalation takes hold.
Demand, market dynamics and macro/geopolitical sentiment began to move higher while Brent was still largely contained. That was the first meaningful shift: the narrative was beginning to broaden before price had fully broken out.
This is where sentiment proved its value. The market had decisively repriced, the information flow had already started to converge around a more bullish oil story.
By March, the signal had moved from early inflection to broad confirmation.
Sentiment strength across multiple drivers preceded Brent’s move from the $70s into the $100+ range. This was the first full repricing phase: the premium was no longer latent in the narrative, it had entered the price.
But the composition still mattered. This was largely a fear-led repricing, driven by macro and geopolitical stress and reinforced by market dynamics. Powerful, yes, but not yet deeply rooted in physical tightness.
That made the premium vulnerable. It depended on fear remaining the dominant driver.
Then came the warning. Peace deal talks enter the conversation.
Sentiment faded while price remained elevated. That divergence was the first sign that the rally’s underlying support was beginning to thin. The market still carried a premium, but the narrative that had built it was losing force.
Price alone suggested resilience. The driver-level signal showed something more fragile: a market whose support was weakening beneath the surface.
This was not a fresh bullish impulse. It was a warning that the first phase of the rally was becoming more exposed to reversal.
The second bullish phase was different in kind.
Physical supply and market-dynamics sentiment became the dominant forces behind the move. Refinery disruption, shipping risk, transit uncertainty and inventory drawdowns moved closer to the centre of the Brent narrative.
This was the point at which Brent stopped trading pure escalation risk and began pricing something more durable: the operational consequences of disruption.
That is the shift to pay attention to. A geopolitical premium can be softened by diplomacy. A supply-led premium, tied to disrupted flows and tighter inventories, is harder to dislodge. This was the moment when the rally changed character: from fear to friction.

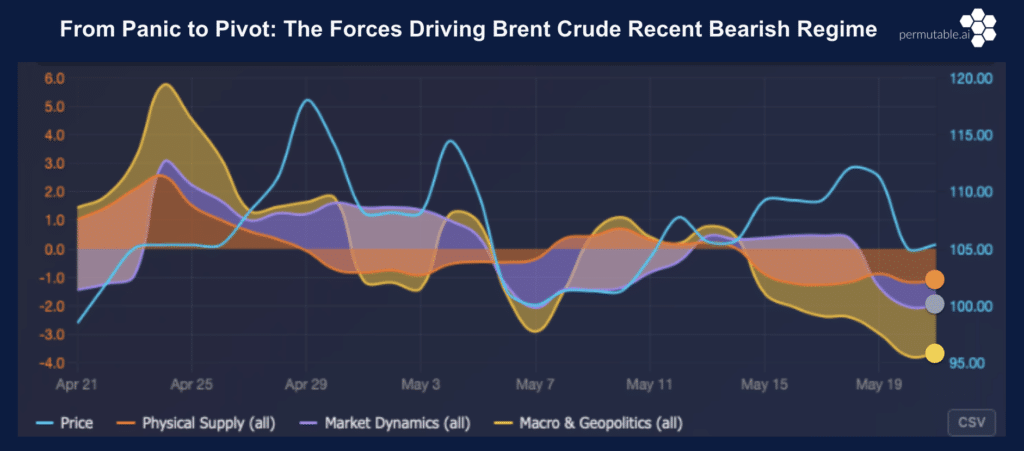
Above: Permutable’s driver-level energy sentiment intelligence shows how Brent crude transitioned from geopolitical panic premium toward a broader bearish repricing as macro sentiment, physical supply dynamics, and market structure weakened beneath the surface of price action.
The one-month view shows Brent’s latest bearish turn. Macro and geopolitical sentiment fell sharply as Trump’s Iran talks revived hopes of de-escalation, while market dynamics also rolled over into the sell-off. Physical supply sentiment weakened, but did not collapse, leaving Brent caught between diplomatic relief and unresolved supply fragility.
The latest phase is no longer about building risk premium. It is about how much of that premium survives once the panic starts to unwind.
The one-month signal shows the shift clearly. Macro and geopolitical sentiment, which had carried much of the earlier fear premium, fell sharply as Trump’s Iran negotiations moved to the centre of the market narrative. Brent followed, dropping towards the mid-$100s. That was the pivot. The market stopped adding geopolitical fear and began removing it.
But this is not a clean reset. Physical supply sentiment weakened, but did not fully break. That matters. It suggests traders are no longer paying for maximum escalation, but they are not yet ready to declare the physical premium as over. Diplomacy has removed the panic. It has not removed the friction.
The next signal is whether physical supply sentiment follows macro/geopolitics lower. If it does, Brent becomes more exposed to a deeper unwind. If it holds, the market may struggle to break materially lower, even as the Trump-Iran narrative continues to soften.
A Brent rally led by macro/geopolitics carries one message. A rally led by physical supply carries another. Demand, logistics stress, inventory pressure and market dynamics each point to a different source of pressure inside the oil market.
They also resolve in different ways.
Geopolitical sentiment can turn quickly when diplomacy improves. Physical supply sentiment needs evidence that disruption is easing. Logistics stress needs flows to normalise. Inventory pressure needs stocks to rebuild. Market dynamics can weaken once price momentum breaks.
Price compresses all of that into one number. Driver-level sentiment separates the moving parts.
This highlights the true value of treating sentiment as structured market intelligence. It reveals not just where Brent is moving, but why, identifying which macro driver is currently in control, and whether the underlying trend is gaining cross-market breadth or beginning to thin out.
Brent’s three-month signal has traced a clear sequence: broadly negative, inflection, repricing, divergence, supply-led confirmation. The one-month chart adds the latest phase: premium compression.
Trump’s Iran talks have weakened the macro/geopolitical driver that powered the panic phase. The next question is whether physical supply, logistics and inventory signals now follow lower.
If they do, Brent becomes more exposed to a deeper unwind. If they hold, the market may struggle to surrender the full premium, even as geopolitical fear fades.
Brent’s risk premium became more durable when bullish sentiment shifted from headline escalation to supply-side confirmation. The next test is whether diplomatic relief breaks the physical layer, or simply strips out the panic premium above it.
Understanding whether oil markets are repricing on fear, physical disruption, logistics stress or broader macro transmission requires more than headline monitoring. Permutable’s Energy Indices are designed to help institutional teams identify how narrative drivers evolve beneath price action in real time.
Request a walkthrough to see how our driver-level energy sentiment intelligence helps trading, research, and risk teams track shifting market regimes across crude, refined products, natural gas, power, and broader commodity markets.
This case study explores how Permutable’s real-time Brent crude intelligence identified a reversal in ceasefire and de-escalation sentiment before Brent crude sharply repriced geopolitical risk. Designed for hedge funds, commodities traders, and macro research teams, the article examines how narrative intelligence and source-traceable sentiment analysis are reshaping institutional energy trading workflows.
Brent crude’s sharp reversal this week did not begin with price action. It began with a shift in geopolitical narrative momentum that markets started repricing hours before the broader selloff accelerated.
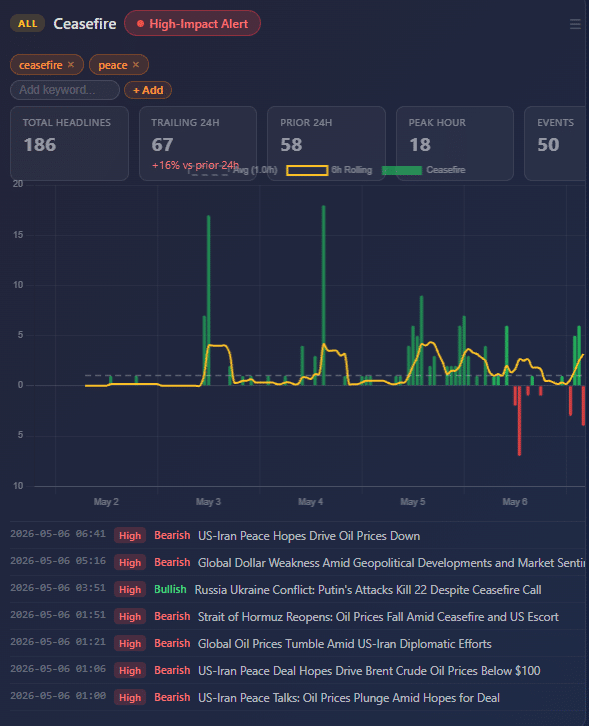
At Permutable, our customised 24-hour Brent crude sentiment tracker identified the first clear reversal in ceasefire-related sentiment before midnight on 5 May, well before crude moved sharply lower during the morning session.
At that stage, peace-deal headlines, Hormuz de-escalation narratives, and weaker disruption-risk signals had already begun clustering across the market. The tracker showed Brent’s read-through shifting away from supply-risk escalation and toward geopolitical risk-premium unwind before the move became fully visible in futures pricing.
By the time the broader repricing appeared on trading screens, narrative conditions inside the market had already changed materially.
Above: Permutable AI’s customised Brent crude sentiment tracker identified a sharp reversal in ceasefire and de-escalation narratives before oil markets rapidly unwound geopolitical risk premia.
Beneath the surface, Permutable’s system identified several important transitions developing simultaneously:
The move that followed reflected a rapid unwind of geopolitical risk premia across oil markets.
Reports of paused US Strait operations, alongside growing optimism around a potential US-Iran agreement, changed how traders assessed near-term supply disruption probabilities. As those narratives strengthened, Brent crude rapidly repriced lower.
At one stage Brent briefly approached the $98 level as markets aggressively reduced exposure linked to escalation risk.
The selloff was not caused by one headline alone. Instead, the move developed through the accumulation of multiple de-escalation signals entering markets simultaneously:
This distinction matters because modern commodities markets increasingly trade on changing probability distributions rather than static fundamentals alone.
That is precisely the reason we have been seeing institutional demand for Permutable’s real-time Brent crude intelligence accelerating across macro hedge funds, systematic, commodity and energy trading desks.
The market is no longer simply reacting to whether supply is tight or loose. It is continuously repricing the probability of future disruption scenarios. In this case, the system isolated the dominant driver clearly. This was not generic oil-news weakness. It was a ceasefire-driven repricing of geopolitical risk.
One of the more important aspects of this week’s move is that the underlying physical backdrop remained relatively supportive throughout the selloff.
Large inventory draws, constrained supply conditions, and persistent structural tightness continue to sit underneath the market. Under different geopolitical conditions, those factors could easily have pushed crude higher.
But markets temporarily prioritised diplomatic momentum over physical scarcity. That divergence highlights how oil markets increasingly behave during periods of geopolitical volatility. In practice, sentiment can overpower fundamentals in the short term, particularly when positioning becomes heavily concentrated around a single macro narrative.
Many conventional commodities research workflows still rely heavily on static news monitoring, delayed analyst interpretation, or document-level sentiment scoring. The problem is that narrative transitions rarely happen cleanly.
They emerge gradually through thousands of interconnected signals before becoming consensus positioning. By the time the narrative appears obvious through price action alone, a large portion of the move may already be complete.
During this Brent reversal, sentiment progressively rotated away from:
toward:
The reversal itself began before midnight, long before ceasefire optimism became the dominant market narrative during the following trading session.
In our view, this is one reason first-generation sentiment systems increasingly struggle during periods of geopolitical stress. Many remain overly dependent on isolated document scoring and fail to capture how narratives evolve collectively across markets.
This case study reflects a broader structural shift taking place across commodities and macro trading.
We are already seeing institutional investors are moving beyond simple positive or negative sentiment classification toward systems of the kind we have built here at Permutable capable of modelling:
The distinction is important.
Modern commodities markets increasingly move in stages:
For systematic trading teams, the challenge is identifying those narrative transitions before they become consensus market positioning.
That requires more than headline ingestion. It requires infrastructure capable of understanding how narratives spread across entities, regions, policy developments, and macro assets simultaneously. At Permutable, our real-time Brent crude intelligence is increasingly becoming part of that workflow.
The recent Brent reversal is a useful reminder that oil markets increasingly function as geopolitical probability markets layered on top of physical supply dynamics. Inventory data still matters. Supply discipline still matters. Physical tightness still matters.
But short-term price discovery is increasingly dominated by how quickly markets reassess future geopolitical outcomes. That reassessment process now happens at machine speed.
For macro systematic funds, commodities trading desks, and cross-asset research teams, the ability to monitor narrative momentum in real time is becoming increasingly important for:
The firms likely to adapt fastest are not necessarily those consuming the most headlines. They are more likely to be those capable of identifying narrative inflection points before those shifts fully propagate through markets.
For Brent crude specifically, the shift was unusually clear:
At Permutable, we provide source-traceable narrative intelligence and real-time sentiment infrastructure for institutional trading and research workflows across commodities, macro, FX, rates, and digital assets.
Our platform supports:
Our custom real-time Brent crude intelligence sentiment trackers allow trading teams to monitor the narratives that matter to their book, configure targeted alerts, and identify when market-moving themes begin to turn in real time.
To request a walkthrough of our real-time Brent crude intelligence or discuss trial access, contact the team at enquiries@permutable.ai.
This article examines how Permutable’s Regional Macro Indices captured the return of energy inflation risk in the Philippines, and how that shift is now reshaping the country’s macro outlook. The central argument is straightforward: the Bangko Sentral ng Pilipinas is being forced into a narrower and less forgiving policy choice between inflation control, currency stability and growth support. For investors and policymakers alike, the wider significance is that narrative data can often detect regime change before it appears in the official numbers.
The BSP has returned to tightening, raising its target reverse repurchase rate by 25 basis points to 4.50%, while lifting the overnight deposit and lending facility rates to 4.00% and 5.00% respectively. The move marks a decisive break from the easing bias that still framed policy earlier this year, and is a reminder of how quickly conditions can revert when an external energy inflation shock meets currency pressure and limited room for manoeuvre.
The bank’s message was plain. The inflation outlook has worsened, underlying pressures are broadening, and early action is required to preserve price stability. This is no longer fine calibration at the margins. It is defensive policymaking in a harsher environment, where imported inflation is rising, the peso remains exposed, and growth momentum is fading.
This is the trilemma now confronting the BSP: contain inflation, support the currency, and avoid tightening into weaker growth. The latest move should be read not as routine adjustment, but as recognition that policy space has narrowed sharply.
The BSP may yet prove less an outlier than an early warning. The immediate lesson is domestic: imported energy pressure, currency fragility and softer demand have already pushed policy from easing bias towards defensive tightening. The broader risk, however, lies in persistence. A short disruption may add only modestly to headline and core inflation. A longer shock could keep energy prices elevated, push headline inflation nearer a percentage point higher, and begin to seep into core prices.
In that setting, central banks that only recently moved from easing to pause may find themselves weighing rate rises into weakening activity. What looks today like a policy trilemma in Manila could, if the shock endures, become a policy trap for larger economies as well.
Permutable’s Regional Macro Indices track the tone and intensity of macro-relevant coverage across economies and themes. They are not designed to mirror official releases in real time. Their value lies in identifying when the narrative backdrop is shifting before that turn is visible in conventional data.
That matters in the Philippines, where the macro story is no longer moving through a single channel. Inflation pressure has re-emerged, the external conflict shock is feeding domestic costs, the peso remains vulnerable, rates have repriced higher, and the growth narrative has softened. Across the chart pack, those pressures appear in the narrative first and in the hard data later.
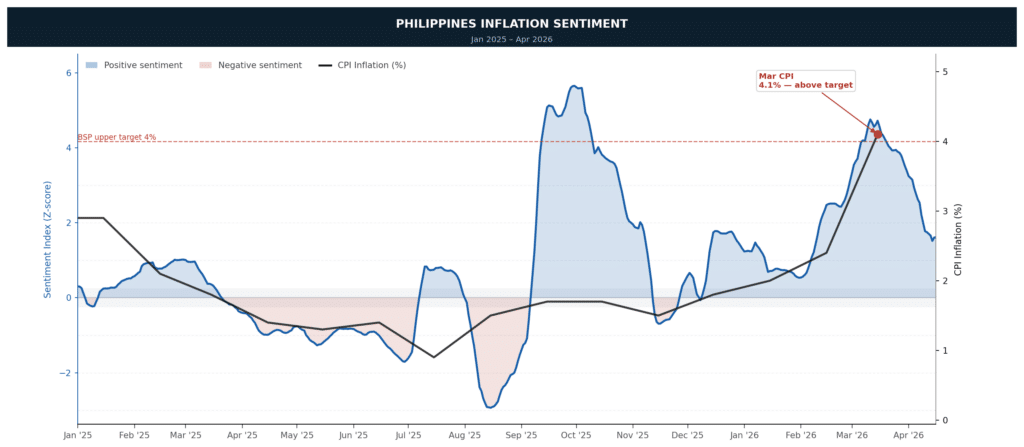
The inflation data gave the BSP a strong basis for acting. Headline inflation rose to 4.1% in March from 2.4% in February, moving above both the BSP’s 2% to 4% target band and its own March forecast range. Average inflation for the first quarter still came in at 2.8%, but the monthly acceleration was sharp enough to alter the policy tone. Core inflation also rose, to 3.2% from 2.9%, suggesting that the pressure is no longer confined to the initial fuel shock. The burden is also becoming more visible at the household level, with inflation for the bottom 30% of households accelerating to 4.2% in March.
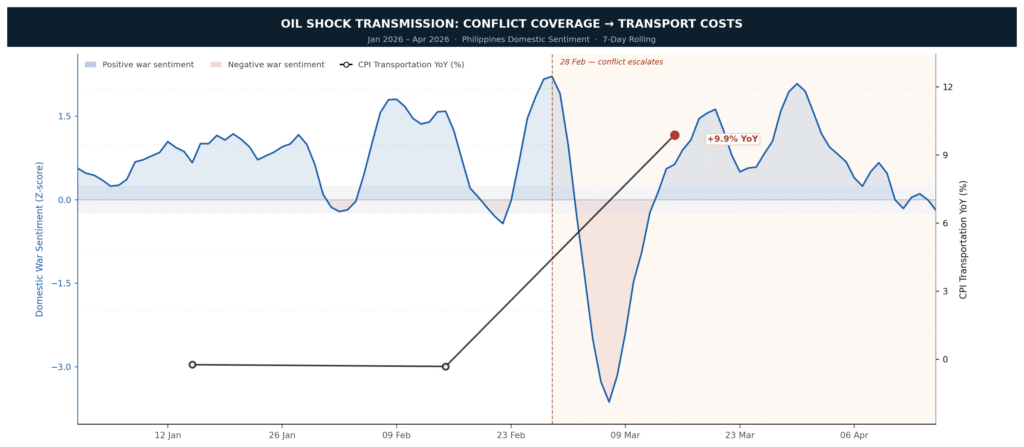
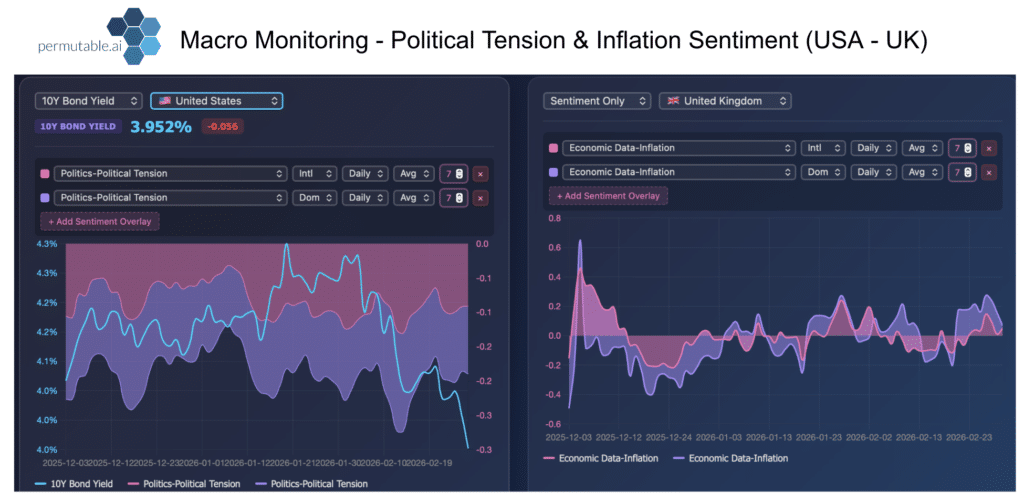
Permutable’s inflation sentiment index captures this shift in narrative. It moved out of the deeply negative territory seen in mid-2025 and into clearly positive ground by the first quarter of 2026. In that sense, the narrative around price stability had already deteriorated before the March CPI print broke above target. The official data did not initiate the story. It confirmed a change that was already visible in the discourse. When inflation coverage becomes consistently more alarmed, it may point to a broader change in regime rather than a one-off disturbance.
The March inflation breakdown helps explain why the pass-through matters. PSA data show that the acceleration was broad rather than isolated, with transport, housing and utilities, and food all contributing. Transport inflation rose 9.9% year on year. The housing, water, electricity, gas and other fuels category increased 4.5%. Food inflation also picked up as rice prices turned higher. Higher domestic petroleum prices have lifted transport and logistics costs, electricity charges have risen, and fuel costs are now feeding into the food chain through farmgate, post-harvest and distribution channels.
Domestic conflict coverage in the Philippines is therefore not simply a proxy for geopolitical anxiety abroad. It also reflects a domestic lens on energy exposure, shipping disruption, logistics strain and remittance corridor risk. That narrative intensified sharply through late February and into March. The transmission into hard data then followed quickly rather than gradually. Transport CPI, which had been quite through January and February, rose to 9.9% YoY in March. The sentiment signal did not provide a forecast of the precise number, but it did highlight the direction of risk and the likely transmission channel before the official release made the pass-through visible.
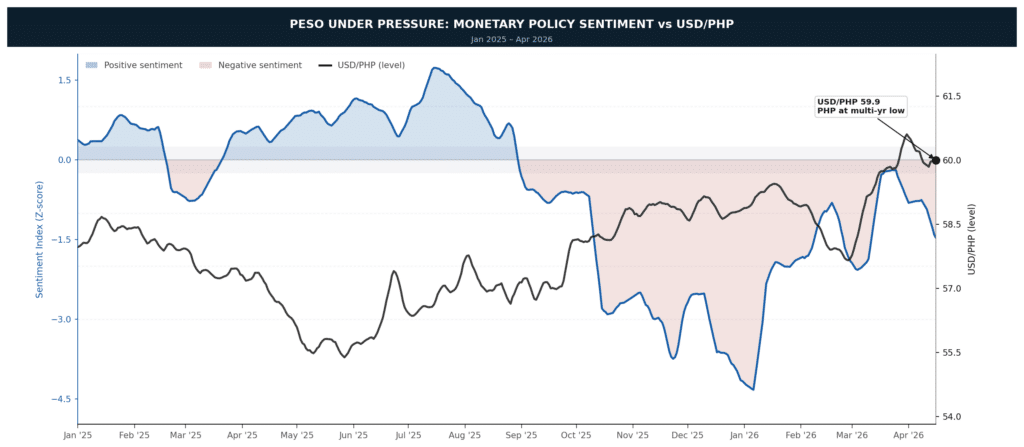
This is also an FX story. For the Philippines, tighter policy is not only about the inflation forecast. It is also about limiting the extent to which peso weakness adds to imported price pressures. March’s balance of payments deficit widened to US$2.6 billion, taking the cumulative first-quarter deficit to US$5.3 billion. Gross international reserves fell to US$106.6 billion at end-March. That still represents a meaningful external buffer, covering 7.0 months of imports and around 3.9 times short-term external debt on a residual maturity basis, but it still points to a somewhat softer external picture than the BSP would ideally face during an oil shock.
The peso remains an important part of that transmission chain. A rate increase may help limit near-term downside pressure, but it does not remove the underlying vulnerability of an economy heavily exposed to Middle Eastern oil and to external financing conditions. A negative monetary policy sentiment score should not be read simply as a signal of easier policy expectations.
In this context, it points more to a policy narrative marked by concern, constraint and limited room for manoeuvre. Negative sentiment here suggests constrained optionality rather than accommodation. Read that way, the chart alongside USD/PHP reflects the strain created by a more difficult policy mix in which the BSP is trying to contain inflation risks, defend credibility and lean against imported price pressure at the same time.
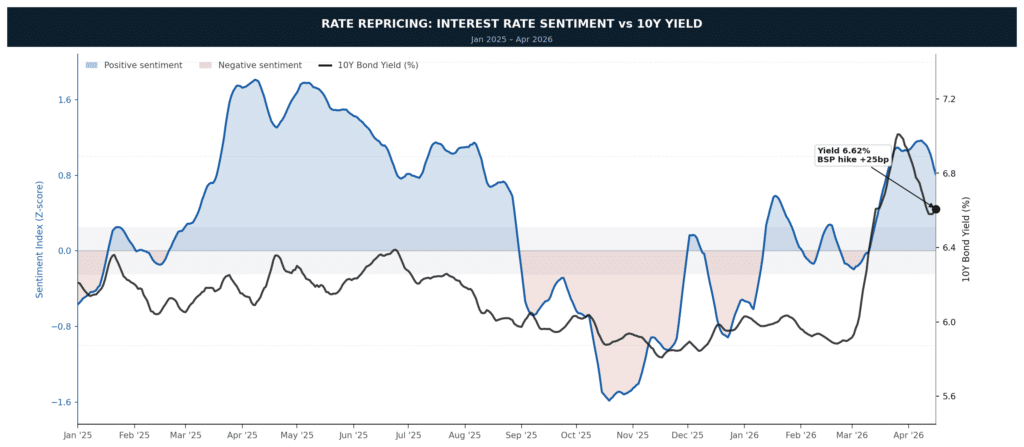
Permutable’s interest rate sentiment shows the relationship to the 10yr yield variable it is plotted against. When negative commentary around BSP policy becomes more sustained, the bond market has tended to reprice within days rather than weeks.
That is the pattern visible through the first quarter of 2026. By the time the BSP delivered its 25 basis point hike, the hawkish narrative was already established and the 10yr yield had already moved higher. A yield around 6.62% does not appear consistent with a market assuming that inflation pressures will fade quickly. Rather, it appears consistent with a market that sees the central bank as having to respond defensively to a backdrop it does not fully control.
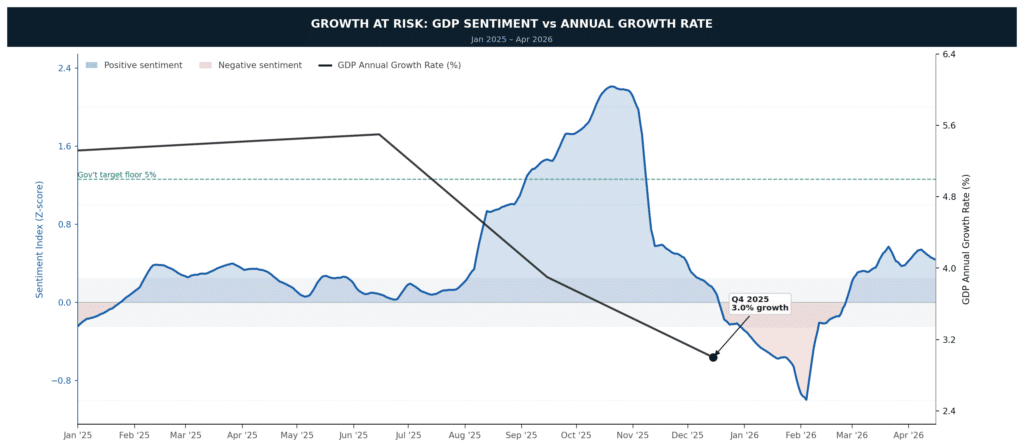
The broader context complicates the policy calculus further. Fitch affirmed the Philippines’ BBB rating but revised the outlook to negative, reflecting the economy’s exposure to the global energy shock and the drag from scandals disrupted public investment. Growth is still expected to hold up better than in some peer economies, but the medium-term outlook is softer, with 2026 GDP growth seen below the government’s 5% to 6% target range. The BSP is therefore tightening into a weaker growth backdrop, not because it is seeking to suppress demand for its own sake, but because the risk of allowing an oil shock to feed through into core inflation, food prices and the exchange rate has increased.
That softer backdrop is also visible in the GDP sentiment chart. The index is not collapsing, but neither is it offering much reassurance. A reading close to neutral during a tightening phase is rarely an entirely benign signal. Neutral growth sentiment suggests that the market narrative has become less willing to reinforce the official growth story. It has not turned clearly pessimistic, but it has become less supportive. That distinction matters. The growth narrative has lost conviction, not collapsed. Even so, that alone is enough to make the policy mix more difficult if inflation and FX pressures continue to build.
A further complication is the broader dollar environment. Safe-haven demand has supported the dollar again as tensions around Iran and the Strait of Hormuz persist, while discussion around swap lines and dollar funding conditions has added another layer of pressure for oil-importing economies trying to stabilise their currencies. That does not alter the BSP’s domestic mandate, but it does make the external setting less forgiving and narrows the room between inflation management and growth support that the central bank would ideally want to preserve.
Taken together, this looks less like a routine 25 basis point hike and more like a defensive move aimed at limiting risks across several fronts at once: inflation expectations, peso stability and second-round effects. The BSP is no longer simply fine-tuning policy. It is responding to the risk that an external oil shock could become a broader domestic inflation and FX problem.
That is also the core message of the charts. These indices are not mechanical forecasting tools. They show when the narrative around a macro theme has shifted before the official data fully reflects it.
In the Philippines, the signals are starting to line up:
The official data is now moving in the same direction, but with months lag.
For investors and macro teams looking to track sentiment can give you an insight into evolving policy risk, inflation dynamics and cross-asset transmission in real time, Permutable’s macro sentiment offers a structured view of how narratives are shifting across markets. For access or further information, contact enquiries@permutable.ai
This article explores the application of Permutable’s real-time market intelligence for LNG supply tracking. It outlines how by turning fragmented news and geopolitical events into actionable market signals.
It highlights emerging disruption risks, shifting trade flows and sentiment trends. Aimed at traders, analysts and risk teams, it demonstrates how Permutable AI helps identify meaningful signals early in an increasingly complex and event-driven LNG market.
In today’s LNG market, information is abundant but clarity is scarce. Traders, analysts and risk teams are no longer constrained by a lack of data. Instead, they are faced with an overwhelming volume of fragmented signals, often buried within news cycles, geopolitical developments and regional policy shifts. The challenge is no longer access to information. It is identifying which signals genuinely matter for supply.
At Permutable, we have been observing a clear shift in how LNG markets behave through our real-time LNG intelligence. What was once a relatively structured system driven by long term contracts and predictable demand cycles has evolved into something far more dynamic. LNG is now deeply intertwined with geopolitics, infrastructure resilience and real time sentiment. As a result, traditional approaches to market monitoring are increasingly insufficient.
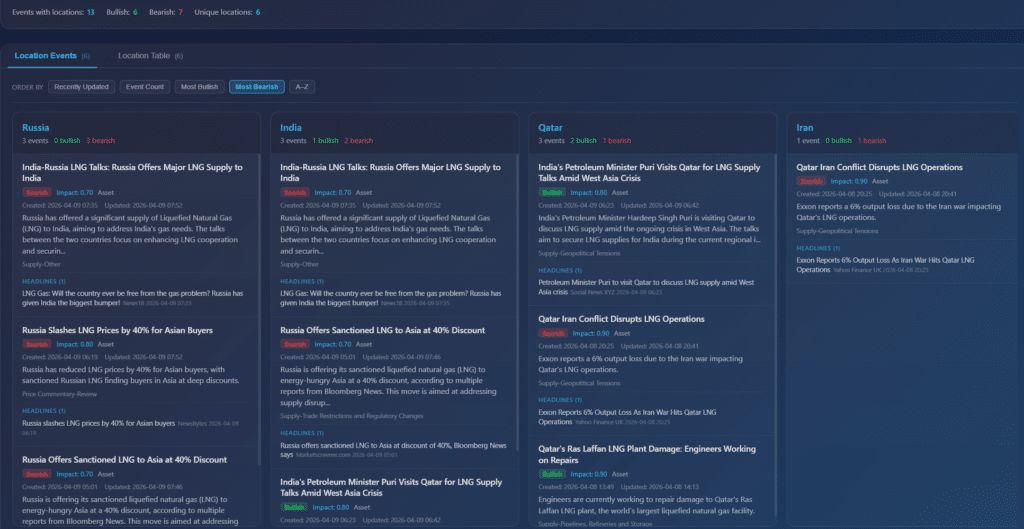
Recent market activity illustrates this transition. A cluster of events centred around the Middle East has brought renewed focus to the fragility of global LNG supply. Reports of disruption to output in Qatar, one of the world’s most significant LNG exporters, have emerged alongside geopolitical tensions involving Iran. On the surface, a six percent reduction in output may appear modest. However, when placed in context, the implications are far more meaningful.
Qatar plays a pivotal role in balancing global LNG flows. Even minor disruptions can ripple across Europe and Asia, tightening supply and influencing price expectations. These are not isolated events. They are part of a broader pattern where geopolitical developments directly influence energy availability.
At the same time, activity in Asia highlights the demand side of the equation. India has been actively engaging in LNG supply discussions, seeking to secure stable inflows amid growing uncertainty. This reflects a wider shift in behaviour among import dependent economies, where securing supply has become more urgent and more reactive to geopolitical risk.
Above: Our Real time LNG event intelligence highlighting country level supply signals, sentiment shifts and geopolitical drivers across key markets including Qatar, India and Russia
Elsewhere, Russia’s increasing presence in Asian LNG markets adds another layer of complexity. Discounted cargoes, reportedly offered at significant reductions, signal a reconfiguration of global trade flows. While this does not constitute a physical supply disruption, it introduces distortion into the market. Supply is not necessarily reduced, but it is redirected in ways that can alter regional pricing dynamics and competitive positioning.
The difficulty for market participants lies in distinguishing between these different types of signals. Not every bearish headline reflects a genuine supply shock. Some indicate temporary infrastructure issues. Others point to strategic reallocation of resources. Without context, it is easy to misinterpret their significance and overreact or underreact accordingly.
This is where real time market intelligence becomes essential. At Permutable, our approach focuses on transforming unstructured data into structured, actionable insight. Rather than treating each headline as an isolated data point, we aggregate and analyse events across multiple dimensions, including geographic clustering, sentiment classification and asset level impact.
By mapping events to specific locations and infrastructure, we can identify where disruption risk is concentrated. By classifying sentiment as bullish or bearish, we can assess how the market is likely to interpret these developments. By applying impact scoring, we can prioritise signals that carry the greatest potential to influence supply.
This allows us to move beyond simply reporting what is happening, towards understanding what matters.
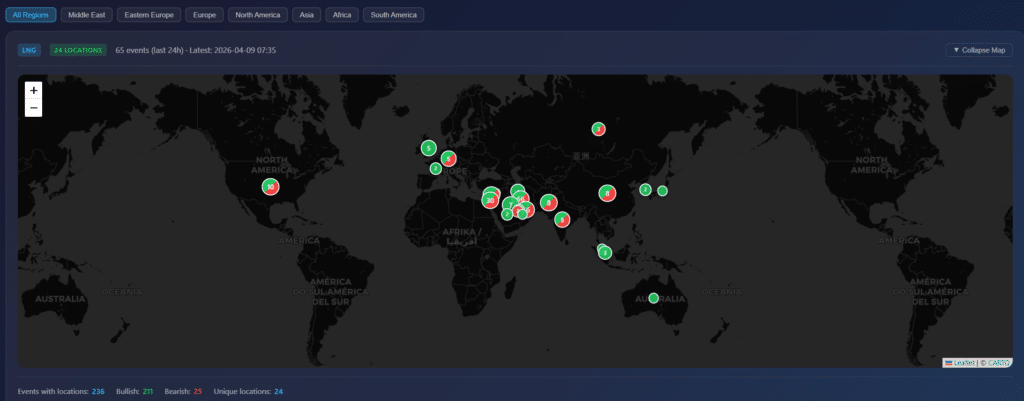
When viewed through this lens, recent LNG activity reveals a coherent narrative. The Middle East emerges as a focal point for disruption risk, driven by geopolitical tensions and infrastructure vulnerabilities. Asia, particularly India, appears as a key demand centre responding proactively to these risks. Russia’s discounted supply introduces competitive pressure and reshapes trade flows, particularly into Asian markets.
Crucially, the overall sentiment across tracked events remains strongly bullish. This suggests that market participants are interpreting current developments as supportive of tighter supply conditions. Even where disruptions are partial or temporary, they contribute to a broader expectation of constraint. This expectation, in turn, influences pricing behaviour across the market.
Above: Global view of LNG market activity showing where supply risks, demand signals and geopolitical events are concentrated in real time powered by our real-time market intelligence.
What distinguishes this approach is not simply the speed of analysis, but the ability to differentiate between signal and noise. A single report of production loss may not be sufficient to alter market positioning. However, when combined with related geopolitical events, infrastructure updates and regional demand responses, it becomes part of a larger pattern.
Identifying that pattern early is where the analytical edge lies. Traders can refine entry and exit timing based on emerging signals rather than lagging indicators. Risk managers can respond more effectively to developing threats to supply. Analysts can build a more accurate picture of how global LNG dynamics are evolving in real time.
The LNG market is no longer driven solely by fundamentals such as capacity and seasonal demand. It is shaped by a complex interplay of events that unfold continuously. Geopolitical tensions, infrastructure resilience and strategic trade decisions all contribute to a constantly shifting landscape.
In this environment, static datasets and delayed reporting are no longer sufficient. Real time intelligence offers a different approach. By continuously analysing and contextualising global events, it enables market participants to move beyond reactive decision making.
At Permutable, our focus is on enabling this shift. By surfacing the signals that matter and placing them in context, we provide a clearer view of global LNG supply dynamics. The result is not just more data, but better understanding.
As LNG markets continue to evolve, the ability to interpret real time signals will become increasingly important. Those who can distinguish meaningful disruption from background noise will be better positioned to navigate volatility and identify opportunity. In a market defined by uncertainty, clarity is a competitive advantage.
Stay ahead of LNG market disruption as it unfolds. Explore our LNG news intelligence feeds to track real time supply signals, geopolitical risk and shifting global trade flows. Surface the insights that matter, when they matter, and make faster, more informed trading and risk decisions with confidence.
To evaluate our LNG news intelligence feeds reach out to our team at enquiries@permutable.ai
This article introduces Permutable Perspective Edition 3, a research publication exploring how alternative data sets and real-time sentiment intelligence are transforming quantitative investment strategies. Aimed at hedge funds, asset managers, and quantitative researchers, it provides practical insights into converting unstructured narrative data into machine-readable signals, improving macro analysis, asset-level modelling, and decision-making in modern systematic trading environments.
The alternative data market has reached an inflection point. Institutional investors are now spending billions annually on alternative data sets, embedding them deeply into quantitative investment strategies across asset classes. Yet despite this rapid adoption, a clear challenge remains.
Access to data is no longer the edge. The edge lies in how effectively that data is transformed into actionable signal.
This is the focus of our third and latest edition of Permutable Perspective – our research-led publication designed for institutional investors, quantitative traders, and hedge funds seeking to extract edge from real-time information flows.
Over the past decade, alt data sets have evolved from niche inputs to mainstream components of modern portfolios with the ecosystem of alt data providers expanding rapidly. Today, most quantitative systematic strategies incorporate some form of alternative data sets.
But as adoption has increased, so too has competition. Many firms are now working with similar datasets, often sourced from the same providers. The result is diminishing differentiation.
This shift has changed the question institutional investors are asking.
It is no longer what data do we have access to.
It is:
And it is against that backdrop that we have put together our latest edition of Permutable Perspective.
Permutable Perspective is a practitioner-focused publication developed by our team at Permutable, designed to provide insight into how real-time sentiment intelligence can be applied to quantitative investment strategies.
Edition 3 builds on this by exploring how unstructured data, particularly narrative and sentiment, can be transformed into structured, model-ready signals.
This edition is grounded in real-world application, combining:
See this as a working blueprint for how modern quantitative strategies are evolving to incorporate real-time sentiment intelligence as we speak.
One of the central themes of Edition 3 is the transition from raw data to structured intelligence.
Many alternative data sets are delivered in formats that require significant processing before they can be used in quantitative hedge fund strategies. This introduces delays, increases complexity, and often reduces the practical value of the data.
Edition 3 explores how this bottleneck can be removed by transforming unstructured inputs into:
This shift reflects a broader trend across quantitative strategies, where the focus is moving from data acquisition to signal extraction.
A key highlight of is a deep dive into our real-time macro intelligence.
Traditional macro data is inherently lagging. By the time inflation, employment, or growth figures are released, markets have often already repriced.
Within Edition 3, we introduce a framework for capturing expectation shifts in real time, tracking macro sentiment across more than fifty economies and multiple thematic drivers.
For quantitative investment strategies, this provides:
Another major focus of Edition 3 is our asset-specific intelligence.
While many alt data providers operate at a broad or aggregated level, within we showcase how signals can be tailored to individual assets. This includes commodities such as energy and metals, as well as FX markets.
Each asset is analysed through:
For quantitative systematic strategies, this enables more precise modelling and improved alignment between signals and price behaviour.
With increasing interest in implementing market sentiment into strategies, a defining insight within Edition 3 is the growing importance of narrative in markets.
Markets are increasingly influenced not just by data, but by how that data is interpreted and communicated. Narrative dynamics – including sentiment, momentum, and persistence – play a critical role in shaping expectations.
Edition 3 explores how these dynamics can be captured and structured, providing a new input for quant strategies. This is particularly relevant in volatile environments, where traditional models may struggle to adapt quickly enough.
Edition 3 also addresses one of the most practical challenges in alternative data – integration.
In this edition, we explain how our API delivers structured, real-time intelligence through a single unified pipeline. Expect a a detailed overview of how our API works as well as how to use it with live institutional settings.
Permutable Perspective – Edition 3 is designed for professionals working at the intersection of data and markets.
This includes:
The content is tailored for those who require depth, clarity, and practical application.
Access can be requested via the form below. Requests are reviewed to ensure the material is shared with professionals for whom it is most relevant.
In this article we dive into how real-time shipping sentiment signalled the Hormuz crisis before Brent repriced, and what the data is telling energy traders and risk teams right now. For those tracking geopolitical regimes and building trade signals around narrative transitions, this is what using sentiment intelligence to gain structural edge in energy markets looks like in practice.
Oil markets are pricing a mobility premium. A logistics crisis so severe that the volume of supply has become secondary to the passage of Barrels. Without a route for barrels, the Strait Squeeze has turned one of the world’s most liquid commodity markets into a study in physical constraint.
The IEA estimates global output could fall by 8 million barrels per day in March, surpassing the 1973 Arab oil embargo, as the Strait of Hormuz, the 33km chokepoint carrying one-fifth of global seaborne oil, completes its transition from contested to closed. Tankers now run a gauntlet of missile strikes, drone attacks and explosive unmanned vessels. The moment insurers withdraw coverage, the barrels that exist perfectly well underground lose their path to market. Supply on paper and supply at the terminal are two very different balance sheets.
That gap widened materially in the last few hours. Iran’s new Supreme Leader Khamenei vowed via state television to continue blocking the Strait and avenge those killed in U.S. and Israeli strikes. Three further civilian cargo vessels were attacked in the same window. A U.S.-owned tanker was struck off Iraq by an explosive unmanned speedboat. A Chinese vessel took an unidentified projectile near the Strait with all crew evacuated. Iran has simultaneously extended missile strikes to escape routes for tankers and its neighbours in Bahrain, Oman, Dubai, Qatar.
This is no longer a shipping disruption with geopolitical overtones. It is a geopolitical confrontation with oil infrastructure as the primary theatre.

Geopolitical regimes rarely reprice in a single step. The information phase precedes the market phase, event flows densify, narrative conviction builds, and our sentiment signal accumulates well before it surfaces in spot prices.
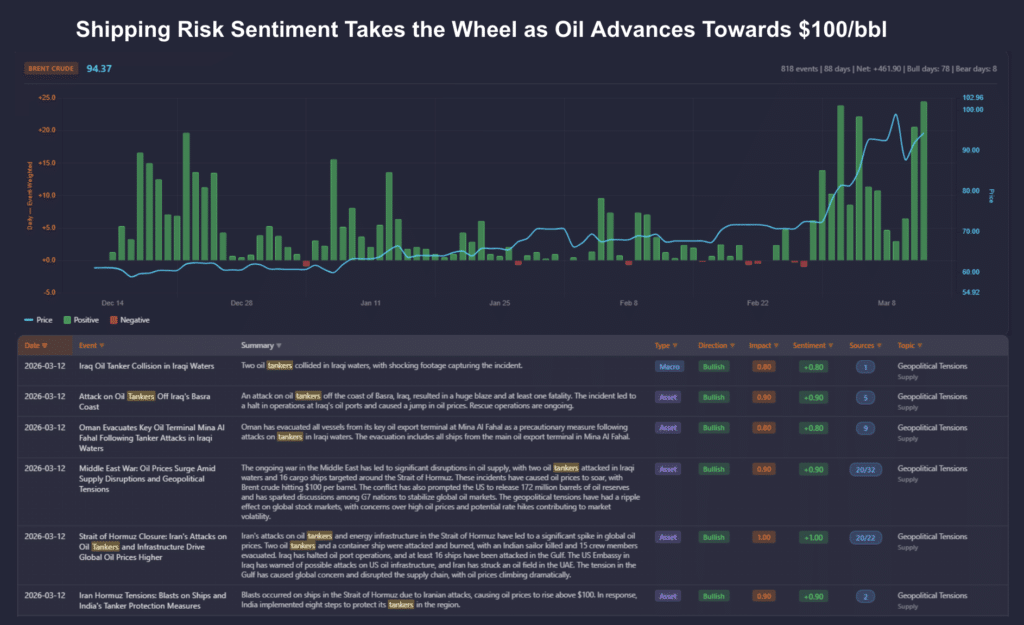
That is precisely what happened here. By the 11th and 12th of March, our maritime sentiment had registered its highest aggregate readings of the entire three-month period, flagging the intensity of the crisis at its peak, in real time. The IEA’s 400 million barrel reserve release landed and the signal accelerated regardless. Where policy saw a pressure valve, sentiment saw through it. The narrative and the price are moving in opposite directions.
The market is not pricing inventory. It is pricing access to a tanker, an open port, and a route that still exists by morning. Our signal has been tracking that question since February. The terminal screens are only just catching up.
The reserve release is not inconsequential. But it is a volumetric instrument applied to a routing problem. Strategic reserves solve supply problems. They do not solve mobility risk.
The defining development of the past 48 hours is not the magnitude of the disruption. It is the geography. Iran has begun targeting the escape routes.
The redundancy architecture producers and operators spent decades constructing, alternative routes, bypass terminals, distributed export infrastructure, is being methodically dismantled. Strategic reserves replenish a number on a balance sheet. They cannot reconstruct a port that drones just hit.
For energy traders and risk teams deploying sentiment as a live signal layer, the current bullish shipping risk intensity is at its highest in three months and accelerating into the policy response.
The signal is accessible at the instrument level. A single API endpoint surfaces the sentiment series in real time, ready for integration into live models, risk dashboards and systematic trading frameworks.
The price driver is now the integrity of the physical infrastructure chain connecting wellhead to buyer, the mobility premium in its rawest form. That is the question the IEA cannot resolve with a reserve deployment, and it is precisely what sentiment has been flagging since February.
Narrative transitions first. Price discovery follows. The structural edge is in reading the regime as it forms, identifying the accumulation phase before the market.
Shipping sentiment flagged this transition in January. It held convictions through February. It is now registering its highest intensity readings of the cycle, undeterred by the largest coordinated policy response the IEA has ever deployed. The mobility premium is not fading. Iran’s Supreme Leader has just publicly committed to ensuring it does not.
Until tanker traffic normalises across the full Arabian Sea corridor, the premium stays structurally embedded in the price. There is no observable indication that normalisation is imminent or the US is going to back down.
The signal reflects this. The question is whether your risk framework is positioned to act on it.
The mobility premium was visible in the sentiment data weeks before Brent moved. For energy traders and risk teams who want to monitor shipping risk, track narrative regime transitions and build trade signals around the intelligence that moves before price does, this is the infrastructure to do it.
Request a demo and explore our real-time commodity sentiment intelligence at enquiries@permutable.ai
This article uses Permutable AI’s oil analytics to examine the narratives currently driving Brent crude during the Middle East crisis. By analysing real-time sentiment across geopolitics, supply disruptions and macro signals, it shows how geopolitical risk is shaping oil markets. The piece is aimed at energy traders, market analysts, macro investors and institutions seeking data-driven insight into oil price movements.
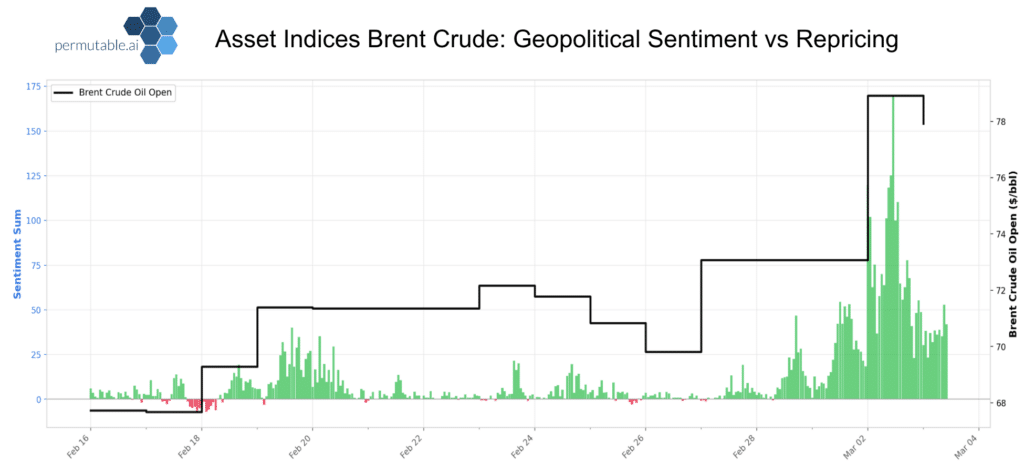
Brent crude has moved from a relatively stable trading range in February into a high volatility geopolitical regime in March. Prices opened the period near $68.9 and gradually established a new floor near $71 before accelerating sharply in early March. Within days Brent surged through the low $90s and briefly spiked to $107.67 on 8 March before correcting rapidly to $93.81 by 10 March.
For traders and analysts, moves of this magnitude are rarely explained by supply and demand fundamentals alone. During geopolitical crises, oil markets are increasingly shaped by narratives around security risks, supply disruptions and policy responses.
This is where AI-driven oil analytics become essential. At Permutable, we analyse large volumes of global news coverage extracting topic level sentiment signals making it possible to quantify which narratives are driving price behaviour in real time.
Using our Brent Crude Topic Sentiment Indices – part or newly released Asset Sentiment Indices, our in house market analysis team examined how sentiment around key oil market drivers evolved during the escalation.
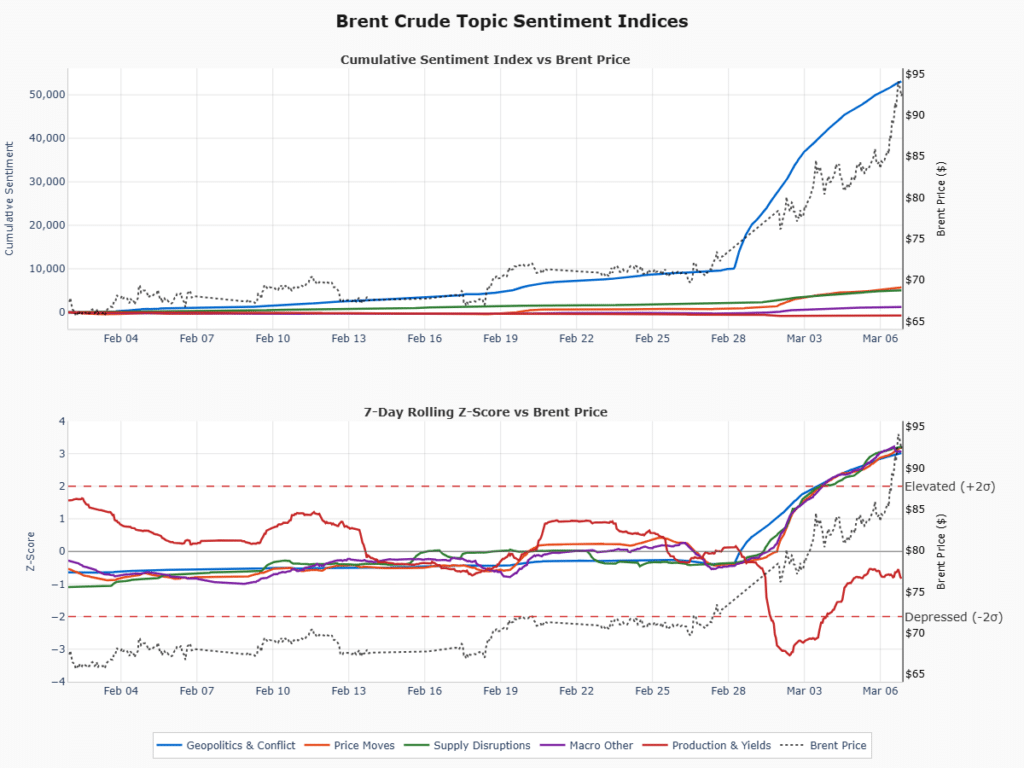
Above: Oil analytics – Sentiment signals behind Brent’s recent rally. Topic sentiment indices derived from global news coverage show a sharp surge in geopolitical risk narratives alongside rising supply disruption sentiment, coinciding with Brent crude climbing toward $95 during the current Middle East crisis.
The chart accompanying this analysis visualises how different news driven narratives influenced Brent crude during the crisis.
The top panel shows cumulative sentiment by topic alongside the Brent price. This reveals how narratives build over time and how they relate to price movements.
The lower panel shows a 7 day rolling Z score. This measures how unusually strong coverage of a given topic is relative to its recent baseline. When the Z score rises above roughly +2 or +3 standard deviations, it indicates a surge in attention that is statistically significant compared with normal levels of coverage.
The dotted black line represents the Brent crude price. Together these signals allow analysts to distinguish between background news flow and narrative shifts that are capable of moving markets.
During the recent crisis several key drivers became visible through our sentiment signals.
The strongest signal came from geopolitical sentiment, which began rising sharply from 28 February onward. This surge coincided closely with Brent’s breakout from the $70s toward the $90s. The rise in geopolitical sentiment reflected a wave of reporting around Gulf security risks, attacks on energy infrastructure and growing concerns around regional escalation.
When geopolitical sentiment reaches these levels the oil market often begins pricing in a risk premium. Traders respond to the possibility that supply flows could be disrupted even if actual production losses remain uncertain. In this case the increase in geopolitical risk coverage coincided with a rapid repricing of energy security risk across oil markets.
Alongside the geopolitical escalation, our sentiment indicators showed a sustained rise in supply disruption narratives. Coverage linked to disruption risk increased steadily through late February and early March, with a rising Z score indicating a meaningful shift in the intensity of news coverage around potential supply interruptions.
Reports driving this shift included attacks on oil depots and refining infrastructure, shipping disruptions affecting tanker routes and maritime security incidents affecting energy transit corridors. There were also reports of export disruptions and production losses among Gulf producers, including interruptions affecting Iraqi output.
Even when physical disruptions are limited, the perception of supply risk can drive significant price reactions. This dynamic was visible in the early March rally, as traders moved to secure supply and hedge against the possibility of tightening near term balances.
Our sentiment signals also captured a sharp negative shift in production related sentiment around 1 and 2 March. Coverage referencing production increases, spare capacity discussions and potential supply responses pushed the production sentiment Z score, representing an unusually strong shift in tone compared with its normal baseline.
In a calmer market environment this type of signal could place downward pressure on oil prices. However the production narrative was quickly overshadowed by the surge in geopolitical and disruption related coverage. The episode illustrates how crisis environments can temporarily shift market focus away from traditional supply demand signals and toward geopolitical risk.
Our sentiment indicators also detected a gradual rise in macro related narratives during the period. Coverage referencing economic growth expectations, inflation dynamics and global energy demand slowly increased. These narratives were not the primary catalyst for the rally but they provided supportive background sentiment.
At the same time price momentum coverage intensified as Brent rallied through the $80s and into the $90s. Financial media increasingly focused on the price move itself and on tightening energy markets. Importantly, momentum narratives tend to follow price movements rather than initiate them. However they can reinforce existing market trends by amplifying the sense that a structural shift in pricing is underway.
The most extreme move occurred on 8 March when Brent surged to $107.67. Our sentiment indicators during this period show an intense clustering of geopolitical and supply disruption narratives.
Reports described direct strikes on energy infrastructure, refinery damage and production losses among several Gulf producers. These developments briefly pushed the market into full crisis pricing mode as traders rushed to hedge against sustained supply outages.
The rally reversed sharply on 9 March when Brent fell to $92.54. This decline of roughly 14 percent in a single session reflected a sudden shift in narrative signals. Our senitment indicators show that the reversal coincided with a wave of diplomatic and policy related developments. These included discussions around potential strategic reserve releases and signals of coordinated responses among major economies.
Such signals reduced the perceived probability of a prolonged supply shock. Traders rapidly unwound positions and the geopolitical risk premium contracted just as quickly as it had formed. By 10 March Brent stabilised around $93.81 as markets attempted to balance ongoing regional risk with the possibility of policy intervention.
At time of writing, our sentiment indicators point to the fact the market remains in a highly reactive geopolitical regime. Gulf security risks and shipping disruptions continue to support an underlying geopolitical premium in prices. At the same time diplomatic engagement and the potential use of strategic reserves introduce a counterweight that may limit extreme price spikes. This combination explains the unusually high volatility observed between early March and the present.
During geopolitical crises traditional oil market indicators often lag the speed at which information reaches financial markets. Inventory data, production reports and official statistics are typically released with delays, while energy markets respond immediately to emerging developments across geopolitics, security and policy.
This is where modern AI-driven oil analytics of the kind we provide here at Permutable prove their value. Rather than relying solely on lagging physical market indicators, our intelligence layer analyses large volumes of global news, policy signals and macro developments to detect shifts in market narratives as they occur.
Our approach to oil analytics focuses on transforming unstructured global information into structured market intelligence. By applying natural language processing and topic level sentiment modelling to thousands of daily news signals, the platform identifies which themes are gaining momentum across the global information landscape and how those themes relate to commodity price movements.
In the current Middle East crisis our analytics reveal how Brent’s volatility has been driven by a combination of escalating geopolitical risk, intensifying supply disruption narratives and rapid shifts in policy expectations. Tracking these narrative dynamics provides traders and analysts with an early view of when the market is beginning to price in new risks or unwind existing ones.
This type of insight allows the clients we work with to better navigate market volatility by helping them to identify the drivers shaping commodity price behaviour before those dynamics are fully reflected in traditional market indicators.
This article examines how geopolitical narratives during the recent Middle East crisis contributed to commodity price volatility across oil, LNG and aluminium markets. Drawing on insights from Permutable AI’s Trading Co-Pilot, it shows how narrative signals can reveal emerging supply risks before traditional indicators. It is aimed at hedge funds, commodities traders, macro analysts and institutional investors navigating volatile global markets.
Periods of geopolitical tension have always been catalysts for commodity price volatility. Yet the recent escalation of tensions in the Middle East highlighted a structural shift that is becoming increasingly visible across financial markets: commodity prices are now reacting to information flows and narrative momentum long before traditional supply data confirms the move.
In recent weeks, oil, LNG and industrial metals experienced significant commodity price volatility as narratives around shipping routes, refinery capacity and regional escalation intensified. While physical disruptions still matter, markets are increasingly responding to how risk is perceived and communicated across global information networks.
At Permutable AI, we track these dynamics through narrative signals extracted from millions of global media sources. By converting these narratives into structured sentiment indices, we can observe how geopolitical narratives propagate through markets in real time. During the recent Middle East crisis, these signals offered valuable insight into how commodity price volatility was forming beneath the surface of global markets.
The Middle East remains one of the most strategically important regions for global energy supply. Consequently, even the possibility of disruption to shipping lanes, refining capacity or production infrastructure can rapidly trigger commodity price volatility.
However, price moves are rarely caused by a single geopolitical event. More often, volatility emerges as a sequence of reinforcing narratives spreads through global media. As traders and analysts interpret these signals collectively, markets begin to reprice supply risk.
This pattern was clearly visible during the latest geopolitical escalation. Reports referencing the Strait of Hormuz, refinery incidents and potential production cuts appeared across hundreds of global and regional sources. Individually these developments were manageable, yet collectively they reinforced a growing perception of supply fragility. As these narratives accumulated, commodity sentiment indices strengthened significantly, signalling that the market narrative was shifting toward supply risk.
Oil markets were naturally the focal point of commodity price volatility during the Middle East crisis. The Strait of Hormuz alone carries roughly a fifth of global oil trade, making it a critical chokepoint for energy markets.
During the period of heightened tensions, narrative signals around the region intensified. Headlines referencing potential Hormuz blockages, regional refinery disruptions and coordinated production adjustments began to increase sharply across global media.
Any single event might not have triggered major price moves. However, as these narratives accumulated, traders began to reassess the probability of supply disruption. This gradual shift in perception drove oil prices higher. By the time markets fully incorporated geopolitical risk, narrative signals had already shown sustained bullish momentum.
This dynamic illustrates an increasingly important feature of modern commodity markets: commodity price volatility often reflects the accumulation of narrative signals rather than a single supply shock.
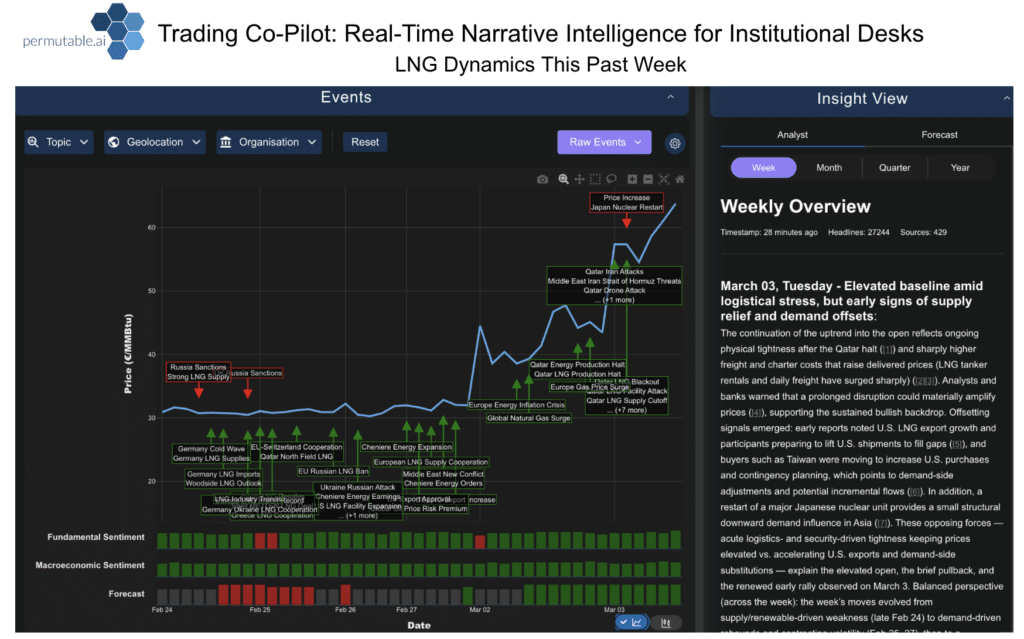
Above: Oil price movements during the recent Middle East escalation, annotated with narrative events detected by our Trading Co-Pilot intelligence layer. As geopolitical headlines around Strait of Hormuz disruptions, refinery incidents, production shifts and strategic reserve discussions accumulated, sentiment signals strengthened and prices moved higher. The chart illustrates how narrative-driven signals can highlight emerging commodity price volatility before markets fully price in geopolitical risk.
LNG markets also experienced notable commodity price volatility during the same period. While LNG supply chains differ from crude oil, they remain highly sensitive to geopolitical developments in the Gulf.
Narratives around potential LNG export disruption, shipping security and broader energy market tightness began circulating widely across both regional and international media outlets. At the same time, demand signals such as weather forecasts and storage expectations added further complexity to the market narrative. The result was a measurable increase in sentiment intensity around LNG supply risk.
Interestingly, these narrative signals appeared before the most pronounced price movements occurred. As supply risk narratives gained traction, LNG prices began to climb, reflecting a market responding not only to current conditions but also to the expectation of future disruption. This again demonstrates how commodity price volatility can emerge from shifting expectations rather than immediate physical shortages.
Above: Natural gas price movements during the recent period of Middle East geopolitical tensions, annotated with narrative signals detected by our Trading Co-Pilot intelligence layer. Events including Strait of Hormuz supply risks, LNG export disruption narratives, extreme weather signals and shifts in global demand contributed to rising commodity price volatility in natural gas markets.
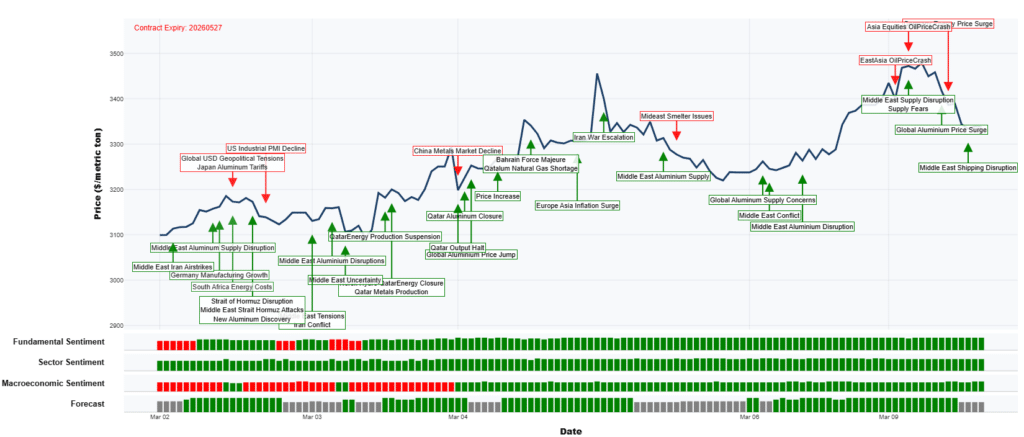
While oil dominated headlines during the Middle East crisis, industrial metals quietly reflected many of the same narrative dynamics. Aluminium markets in particular experienced rising narrative momentum linked to energy supply concerns and potential disruptions to smelting capacity. Aluminium production is highly energy intensive, meaning instability in regional energy markets can quickly influence supply expectations.
Reports referencing Middle Eastern energy disruptions, shipping delays and industrial supply constraints began appearing across a wide range of global sources. Initially these developments attracted relatively little attention compared with oil. However, sentiment signals suggested that the narrative around aluminium supply risk was gradually strengthening. As these narratives intensified, aluminium prices began trending upward, illustrating how commodity price volatility can spread across seemingly unrelated markets.
Industrial metals, often overlooked during geopolitical crises, can therefore provide early signals of broader supply stress within global commodity markets.
Above: Aluminium price movements during the recent period of geopolitical tension in the Middle East, annotated with narrative signals identified by our Trading Co-Pilot intelligence layer. Events including regional energy disruptions, smelter issues, shipping risks and broader supply chain concerns contributed to rising commodity price volatility in aluminium markets.
Tracking thousands of headlines manually is impossible for traders and analysts operating in fast-moving markets. This is where structured narrative analysis becomes increasingly valuable.
Our Trading Co-Pilot intelligence layer processes narratives from more than 250,000 global sources and converts them into asset-specific sentiment signals. Each signal reflects the directional probability of impact on a given asset.
During the Middle East crisis, these signals revealed how geopolitical narratives were influencing sentiment across energy and metals simultaneously. By structuring narrative data into measurable indices, analysts can better understand how commodity price volatility is forming in real time.
Importantly, this approach does not attempt to predict geopolitical events themselves. Instead, it focuses on identifying how geopolitical market narratives evolve, which often provides earlier insight into emerging volatility.
The recent Middle East crisis provides a clear example of how modern markets process information. Commodity price volatility is no longer driven solely by official supply data, inventory statistics or production figures. Instead, markets react continuously to evolving narratives as traders interpret new information. Oil, LNG and aluminium each demonstrated this pattern during the latest geopolitical tensions. As narratives around supply risk accumulated, sentiment signals strengthened and prices followed.
Looking ahead, this dynamic is likely to become even more pronounced. As information flows accelerate and geopolitical risks remain elevated, commodity price volatility will increasingly reflect the speed and spread of narratives across global markets. For investors and traders navigating these conditions, understanding how narratives evolve may become just as important as analysing traditional supply and demand fundamentals.
Request a demo and explore our real-time commodity sentiment intelligence below or reach out to our team at enquiries@permutable.ai
This article examines how structured workflow provides a competitive edge in volatile markets by reducing the opportunity cost created by limited clarity. It is aimed at hedge fund portfolio managers, macro strategists, quantitative teams and risk desks seeking to convert high-volume narrative flow into structured, trade-relevant signals and act before regime shifts are fully priced into markets.
What happens to trading performance when volatility spikes, information floods the market, yet tradable clarity remains out of reach – and how much opportunity is lost while teams wait for conviction that never fully arrives? The outcome is consistent. Uncertainty creeps into the process, conviction is eroded by unfiltered noise, and action is delayed until the risk is already priced and the timing advantage has vanished.
To address this, we have built a solution that slots directly into institutional workflow, whether a team wants structured data feeds through our Systematic Asset Indices, macro context through our Regional Macro Indices, or the full stack delivered through our Trading Co-Pilot.
It is designed for exactly these moments. It does not add to the noise, it converts fast-moving narrative flow into structured, trade-relevant signals, restoring visibility and tightening the path from interpretation to execution.
Central to this is the notion that workflow matters as much as the regime you are trading. In fast markets, the dividing line between proactive and reactive is rarely talent. It is infrastructure and the right toolkit.
Without it, desks tend to recognise regime change only once price has done the repricing and consensus has formed around the explanation. With it, systematic inputs and a discretionary interface work in tandem, giving teams a coherent view across assets and macro – allowing them to catch the inflection point, watch the shift develop, judge whether it is persisting, and act while the market is still figuring out what narrative to trade off.

The energy market is the primary transmission channel of the current conflict. Strait of Hormuz transit risk, tanker insurance repricing and Gulf supply node disruption are generating continuous, high-volume headline flow, the majority of which is noise.
The operational problem for desks and quantitative models alike is extraction: identifying which part of that flow carries genuine signal on supply constraint, and whether that signal is persisting or fading.
Most desks are currently solving this through a combination of analyst coverage, Bloomberg headline monitoring and periodic research updates. The limitation is not effort, it is frequency. Analyst synthesis is episodic.
From Episodic Research to Continuous Signal
The Systematic Asset Indices replace that episodic layer with a continuous one, ingesting unstructured sentiment data from energy market headlines in real time and processing it into structured, quantified signals that are directly consumable as model inputs or desk-level monitoring feeds.
For the energy complex specifically, this means systematic tracking of sentiment across crude, refined products, LNG and associated supply chain narratives, covering tanker availability, rerouting risk, and production precaution versus physical closure, as they develop rather than after they have settled.
Persistence Is the Signal
The signal value in this environment lies in persistence and the monitoring of inflection points. A single-session spike in energy disruption sentiment is a volatility event. Elevated sentiment that sustains across multiple sessions, broadens geographically across Gulf supply nodes, and transmits into LNG and refinery margin narratives is a regime move. When the tankers change course, the signal moves before the price does.
That distinction is not visible in price alone and it is not resolvable through periodic research. Desks using the Indices have visibility on narrative momentum building in real time, typically several hours ahead of the point at which that momentum is reflected in analyst consensus or price-implied positioning. It is precisely this continuous, structured feed that quantifies narrative momentum as it builds and delivers it into models and trading infrastructure.
A Structured Input for Risk Infrastructure
For risk desks specifically, the Indices provide a structured sentiment input that can be incorporated directly into factor models and stress testing frameworks, offering a more responsive lead indicator of supply regime change than price-based signals alone.
Note the persistence of crude sentiment above the disruption threshold from day three onward. That is the signal that separates a spike from a structural move.
Price moves in energy are the first-order effect. The more consequential analytical challenge, and the one that determines medium-term positioning, is mapping second-order transmission: where an energy shock blends into macro regime change, and which countries, currencies and central bank reaction functions are caught in the crosscurrent.
The Structural Limits of Traditional Macro Monitoring
Standard macro monitoring, whether through wire services, central bank communications or sell-side research, covers this terrain but with two structural constraints. Coverage is concentrated in major economies and English-language sources, and synthesis is retrospective rather than continuous.
Our Regional Macro Indices address both directly. As a real-time data feed spanning more than 50 countries with multilingual source coverage across 26 discrete macro topics, it provides institutional desks with the country-level signal that wire services and research coverage consistently are unable to solve, turning unstructured information into a structured signal. In the current conflict context, that breadth is material.
Second-order transmission does not respect G10 boundaries, and the macro risk embedded in import-dependent emerging market economies is often precisely where the most asymmetric positioning sits.
Three Transmission Channels That Define the Regime
The analytical focus in the present tentative backdrop resolves to three transmission channels.
Inflation
A sustained energy shock does not remain contained within the energy complex. It feeds directly into CPI expectations, particularly in import-dependent economies across Europe and Asia. When oil prices catch a geopolitical tailwind of this magnitude, the inflationary pressure that follows is rarely contained at the pump.
The Indices track inflation sentiment at country level in real time, allowing desks to monitor where the energy-to-inflation transmission is being priced into forward expectations and whether central bank communication is shifting in response, before that shift appears in formal guidance or consensus forecasts.
Central bank reaction
The critical question for rates positioning is whether policymakers frame the shock as transitory supply noise or a renewed inflation impulse requiring a policy response. Central banks navigating a geopolitical storm of this nature face an uncomfortable choice: tighten into a slowdown or tolerate an inflation overshoot. That framing varies materially by country and becomes visible in real time through the macro sentiment feed well before it crystallises into formal guidance.
Desks with access to the country-level data can track the divergence in central bank tone across the Federal Reserve, the ECB and major emerging market central banks as the energy shock develops, giving them a read on the rates landscape that is several days ahead of what sell-side research will reflect.
Political risk and safe haven rotation
Country-level macro risk sentiment, covering geopolitical exposure, fiscal strain and political vulnerability, drives the initial safe haven rotation and determines which currency pairs and sovereign bond markets carry the most asymmetric risk in an escalation scenario.
In a geopolitical storm, not every port offers shelter equally, and the Indices make that distinction visible at country level in real time, giving desks a structured basis for FX and rates positioning that goes considerably beyond headline geopolitical proximity.
The point at which multiple country signals elevate simultaneously is where a bilateral tension becomes a systemic pricing event. That is the threshold the heatmap is designed to make visible before the broader market has charted the same course.
The data layer answers what is moving and why. The execution and analytical layer answers what to do about it and when. Trading Co-Pilot is the interface that bridges that gap, a continuously updating visual environment that compiles thousands of headlines per day into the market-moving signals that matter, without requiring manual synthesis.
Solving the Scale Problem in Modern Markets
In the past week alone, our Trading Co-Pilot processed 404,956 headlines across 43,006 events, drawn from 66 languages. No desk can synthesise that volume manually at the speed the market requires.
The alternative, relying on a curated selection of tier-one sources and analyst summaries, reduces noise but sacrifices coverage precisely where geopolitical and supply chain risk tends to surface first: regional sources, non-English language reporting and specialist trade publications that precede mainstream financial coverage by several hours.
By the time that signal reaches a standard research workflow, the ship has often already sailed. Co-Pilot compresses the full breadth of that flow into a continuously updated visual read, structured, ranked and oriented around what is actually driving the market rather than what is simply generating the most volume.
Three Structured Lenses on Market Drivers
In a live escalation environment, the Trading Co-Pilot provides a real-time read on the commodity complex through three structured lenses: Fundamental, Sectoral and Macroeconomic Risk, each expressed in terms of market sentiment. Every lens is continuously refreshed as news flow develops, giving desks an asset-aware view that reflects the actual drivers of commodity price at any given moment.
The event feed surfaces the most consequential developments as they land, ranked by market relevance rather than recency. Sentiment analysis runs continuously across the incoming flow, providing a quantified read on whether the dominant narrative is intensifying or fading.
As conditions shift, real-time insights flag when the balance of drivers is changing, when supply disruption sentiment begins transmitting into demand destruction signals, or when macroeconomic risk factors start overriding commodity-specific fundamentals.
Compressing Interpretation Time as a Structural Edge
For desks managing positions across a fast-moving energy and geopolitical landscape, our Trading Co-Pilot removes the latency between news flow and structured interpretation. The interface is designed for speed.
A desk should be able to form an accurate read on the state of the market within seconds rather than minutes, and track how that read is evolving as conditions develop. In environments where the window between signal and consensus is measured in hours, that compression of interpretation time is a structural advantage.
In energy-led geopolitical shock environments, the cost of a wait-and-see posture compounds quickly. The window between signal formation and market repricing is where positioning carries asymmetric value. Once consensus is fully priced, the convexity is gone, liquidity is thinner and the clean expressions have moved. At that point, the opportunity has sailed and the market has moved on to pricing the next chapter.
The Systematic Asset Indices, Regional Macro Indices and Trading Co-Pilot operate as a continuous, integrated workflow built for exactly this environment. Each layer addresses a distinct part of the problem and feeds directly into the next.
Systematic Asset Indices: persistent, quantified sentiment signals extracted from high-volume energy market headline flow, updated continuously and consumable directly as model inputs or desk-level monitoring feeds.
Regional Macro Indices: second-order transmission tracked across more than 50 countries and 26 macro topics, covering inflation expectations, central bank tone and political risk in real time, across languages and markets that standard research routinely misses.
Trading Co-Pilot: thousands of daily inputs compressed into a single continuously updated visual interface, structured, ranked and market-relevant. An analytical read on what is driving price, available in seconds.
Three layers. One integrated workflow. No gap between signal and execution.
The next escalation will not announce itself. Every hour a desk operates without structured signals in this environment is an hour the market is pricing something they cannot yet see. In fast-moving regimes, flying blind is not a neutral position. It is a losing one.
The desks that act with conviction in fast-moving markets are not better informed, they are better equipped. When the geopolitical weather turns, the advantage belongs to those who saw the front moving in, not those waiting for the storm to arrive before adjusting their sails.
Structured commodity sentiment data, continuous country-level macro feeds and a real-time visual interface are not enhancements to existing workflow. In volatile regimes, they are the workflow.
Permutable AI’s Systematic Asset Indices, Regional Macro Indices and Trading Co-Pilot are available now, with API integration that sits cleanly alongside existing market data infrastructure. Institutional teams can access a sample data pull from the current escalation window, a live walkthrough of the Co-Pilot interface, or full technical integration documentation – whichever is the most useful starting point for evaluation.
To request API access or to arrange a walkthrough to discuss integration, contact us at enquiries@permutable.ai