Copper Sentiment Data for Institutional Commodities Desks: How Sentiment Flagged the 2026 Supply Squeeze Early

Copper sentiment data from Permutable’s Asset Sentiment Indices registered tightening availability almost ten weeks before July’s return to sustained backwardation, offering an early read on a squeeze that would go on to reprice prompt delivery.

After a year in which copper warehouse stocks accumulated, availability concerns intensified and the nearby curve swung into steep backwardation, copper enters the fourth quarter with much of its advance intact. LME three-month metal stands at $14,366 a tonne, approximately 15% above its level at the end of 2025 and 36% higher than in early October last year. The rise in quarterly averages underscores how far the market has travelled: Q3 averaged $14,034 a tonne, compared with $9,849 a year earlier.

While recent consolidation has left the copper benchmark close to its early-September rally level, renewed widening in the cash premium has kept prompt availability in focus. Cash copper reached $14,430 on 5 October, lifting its premium over three-month metal from $35 to $64 a tonne in a single session. The spread remains substantially narrower than in August, although its latest movement points to continuing sensitivity around immediate delivery.

From Contango to Backwardation: Tracking Copper’s 2026 Squeeze

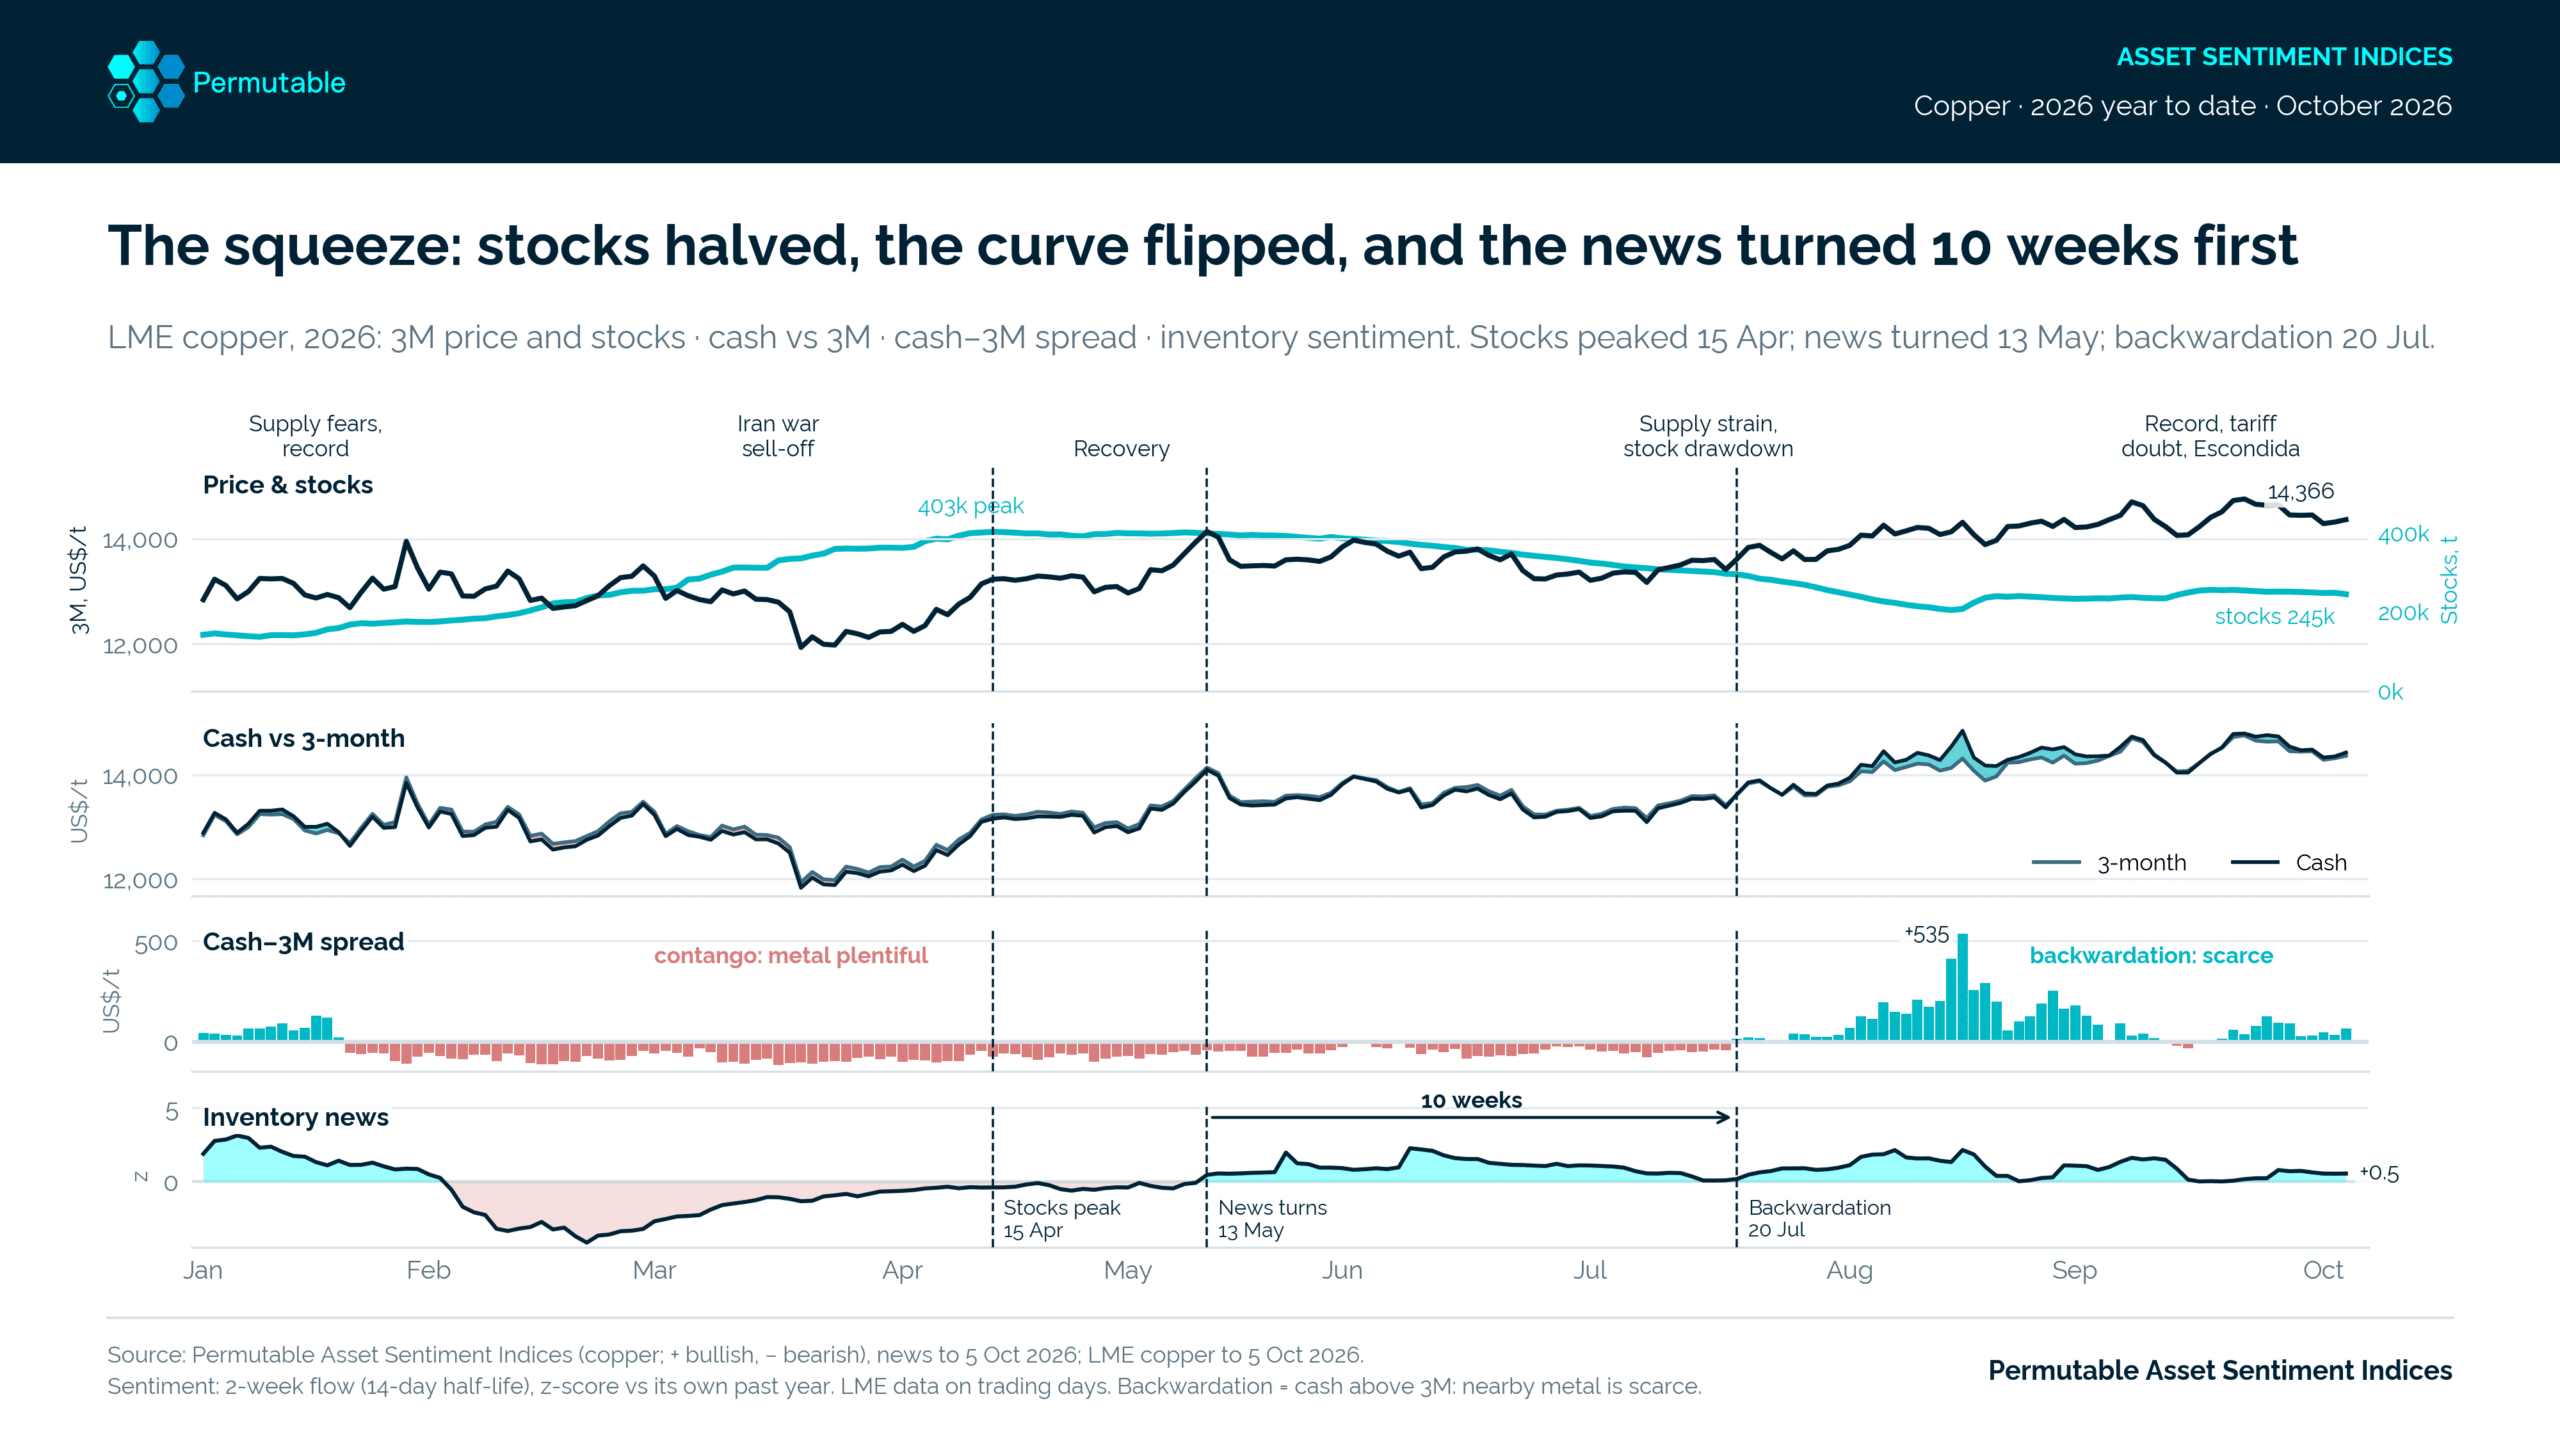
The inventory chronology traced by Permutable’s Asset Sentiment Indices reveals how that sensitivity developed while the visible stockpile still appeared substantial. Total LME stocks rose from approximately 147,000 tonnes at the start of January to 403,000 tonnes on 15 April. When inventory sentiment crossed above its trailing-year norm on 13 May, stocks remained close to their April peak and cash copper traded at a $43 discount to three-month metal.

Almost ten weeks separated that sentiment turn from the curve’s return to sustained backwardation on 20 July, before stocks reached roughly 205,000 tonnes in mid-August, 49% below their April peak. Availability coverage had become more bullish during the early drawdown, well before the summer’s delivery pressure found pronounced expression in the nearby spread (Chart 1).

copper supply squeeze

Over the summer months, the premium for obtaining copper promptly increased sharply. Cash metal traded at an average discount of about $82 a tonne during February–April, then commanded an average premium of approximately $198 in August, reaching $535 on 17 August. Read alongside the inventory series, the sequence suggests that deteriorating availability deserved attention even while warehouse holdings remained large; the changing news flow supplied information about the developing pressure that the stock level alone could obscure.

From Geopolitics to Supply: How Copper’s Narrative Shifted in 2026

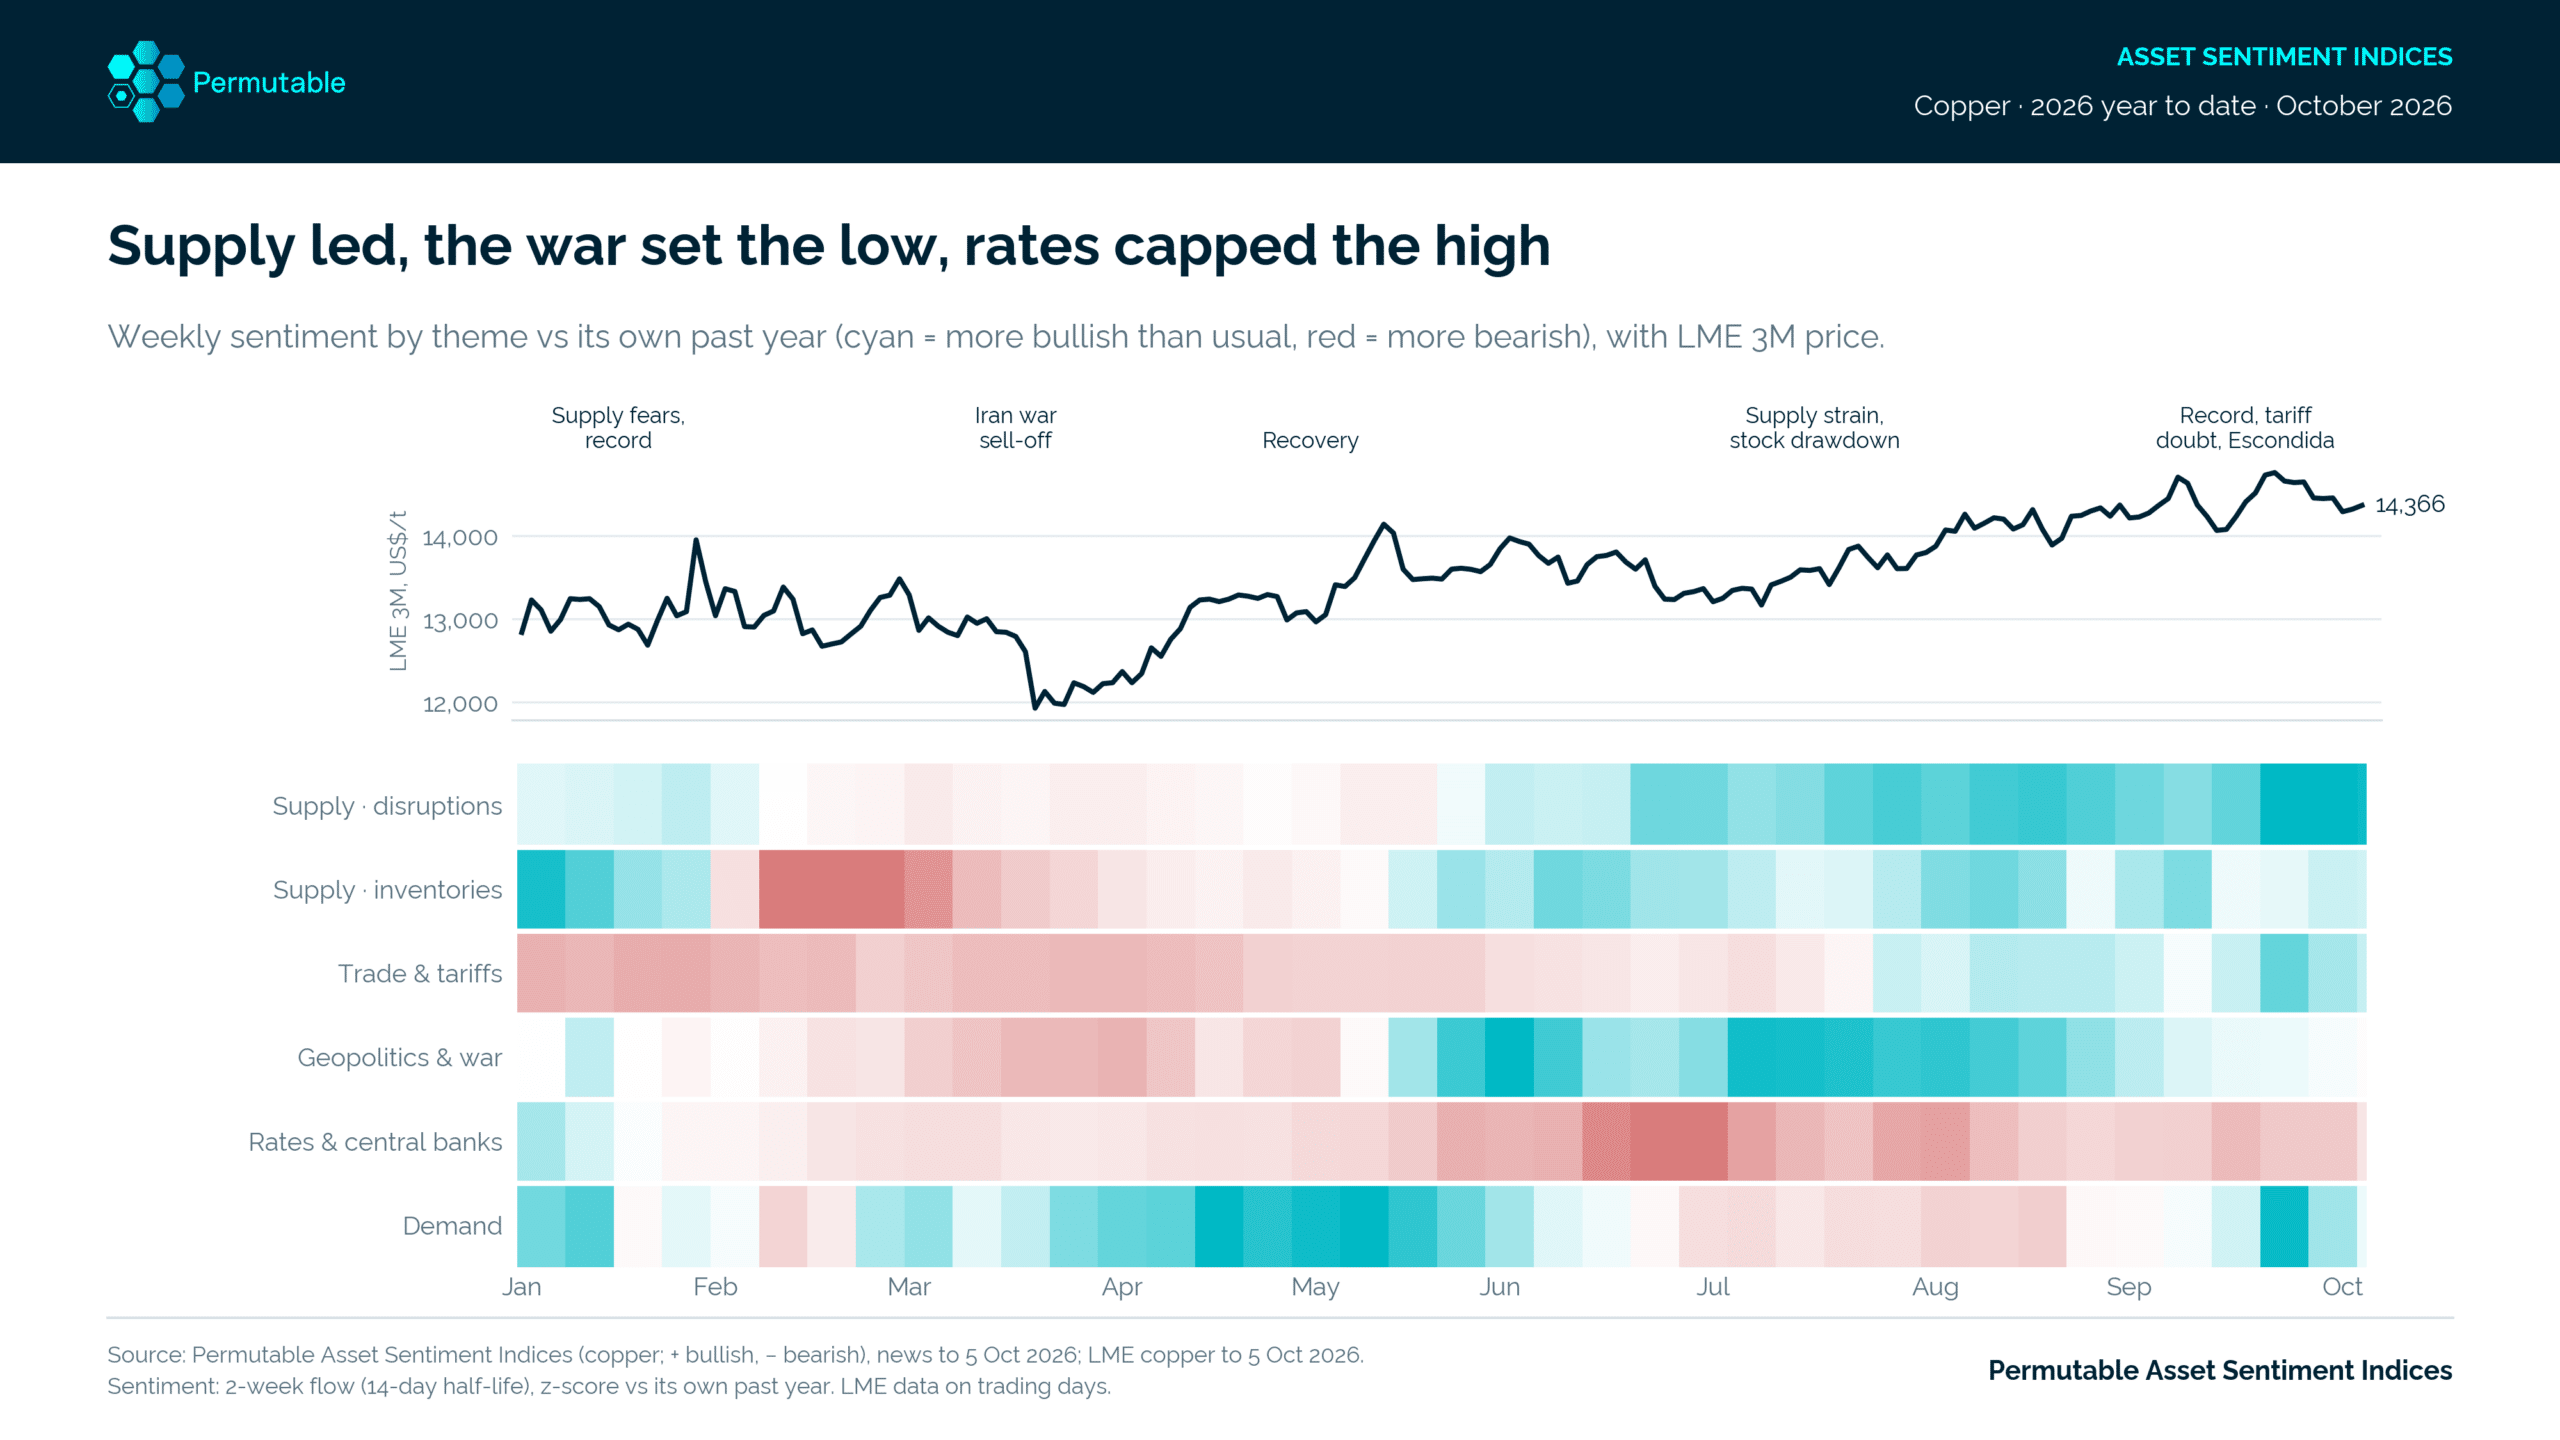
Through successive phases of the rally, the supporting coverage also shifted, with Permutable’s thematic readings recording a handover between geopolitical, demand and supply narratives. Comparatively bearish geopolitical news accompanied the March sell-off, stronger demand sentiment emerged during April and May, and disruption coverage became persistently bullish from June. Rates sentiment weakened through the summer, introducing a monetary counterweight as supply concern gathered force (Chart 2).

Copper sentiment heat map

The latest snapshot retains a broadly supportive bias, with six of the nine thematic series above their respective one-year norms. Industrial demand stands at +0.9 and trade and tariffs at +0.7, while the broader demand reading of +0.2 shows more modest optimism relative to its own history. Rates and currency register the clearest negative deviations, at −0.6 and −0.9 respectively, with rates coverage remaining below its norm every day since 1 June.

Trade policy adds a geographical complication because the incentive to hold copper depends partly on the jurisdiction in which it can be delivered. Expectations of possible US refined-copper tariffs have encouraged accumulation in American warehouses, reducing availability elsewhere. Pressure in the LME system can therefore coexist with considerable holdings outside it, making the distribution and accessibility of inventories central to interpreting the curve.

Why Inventory Sentiment Matters for Copper Availability

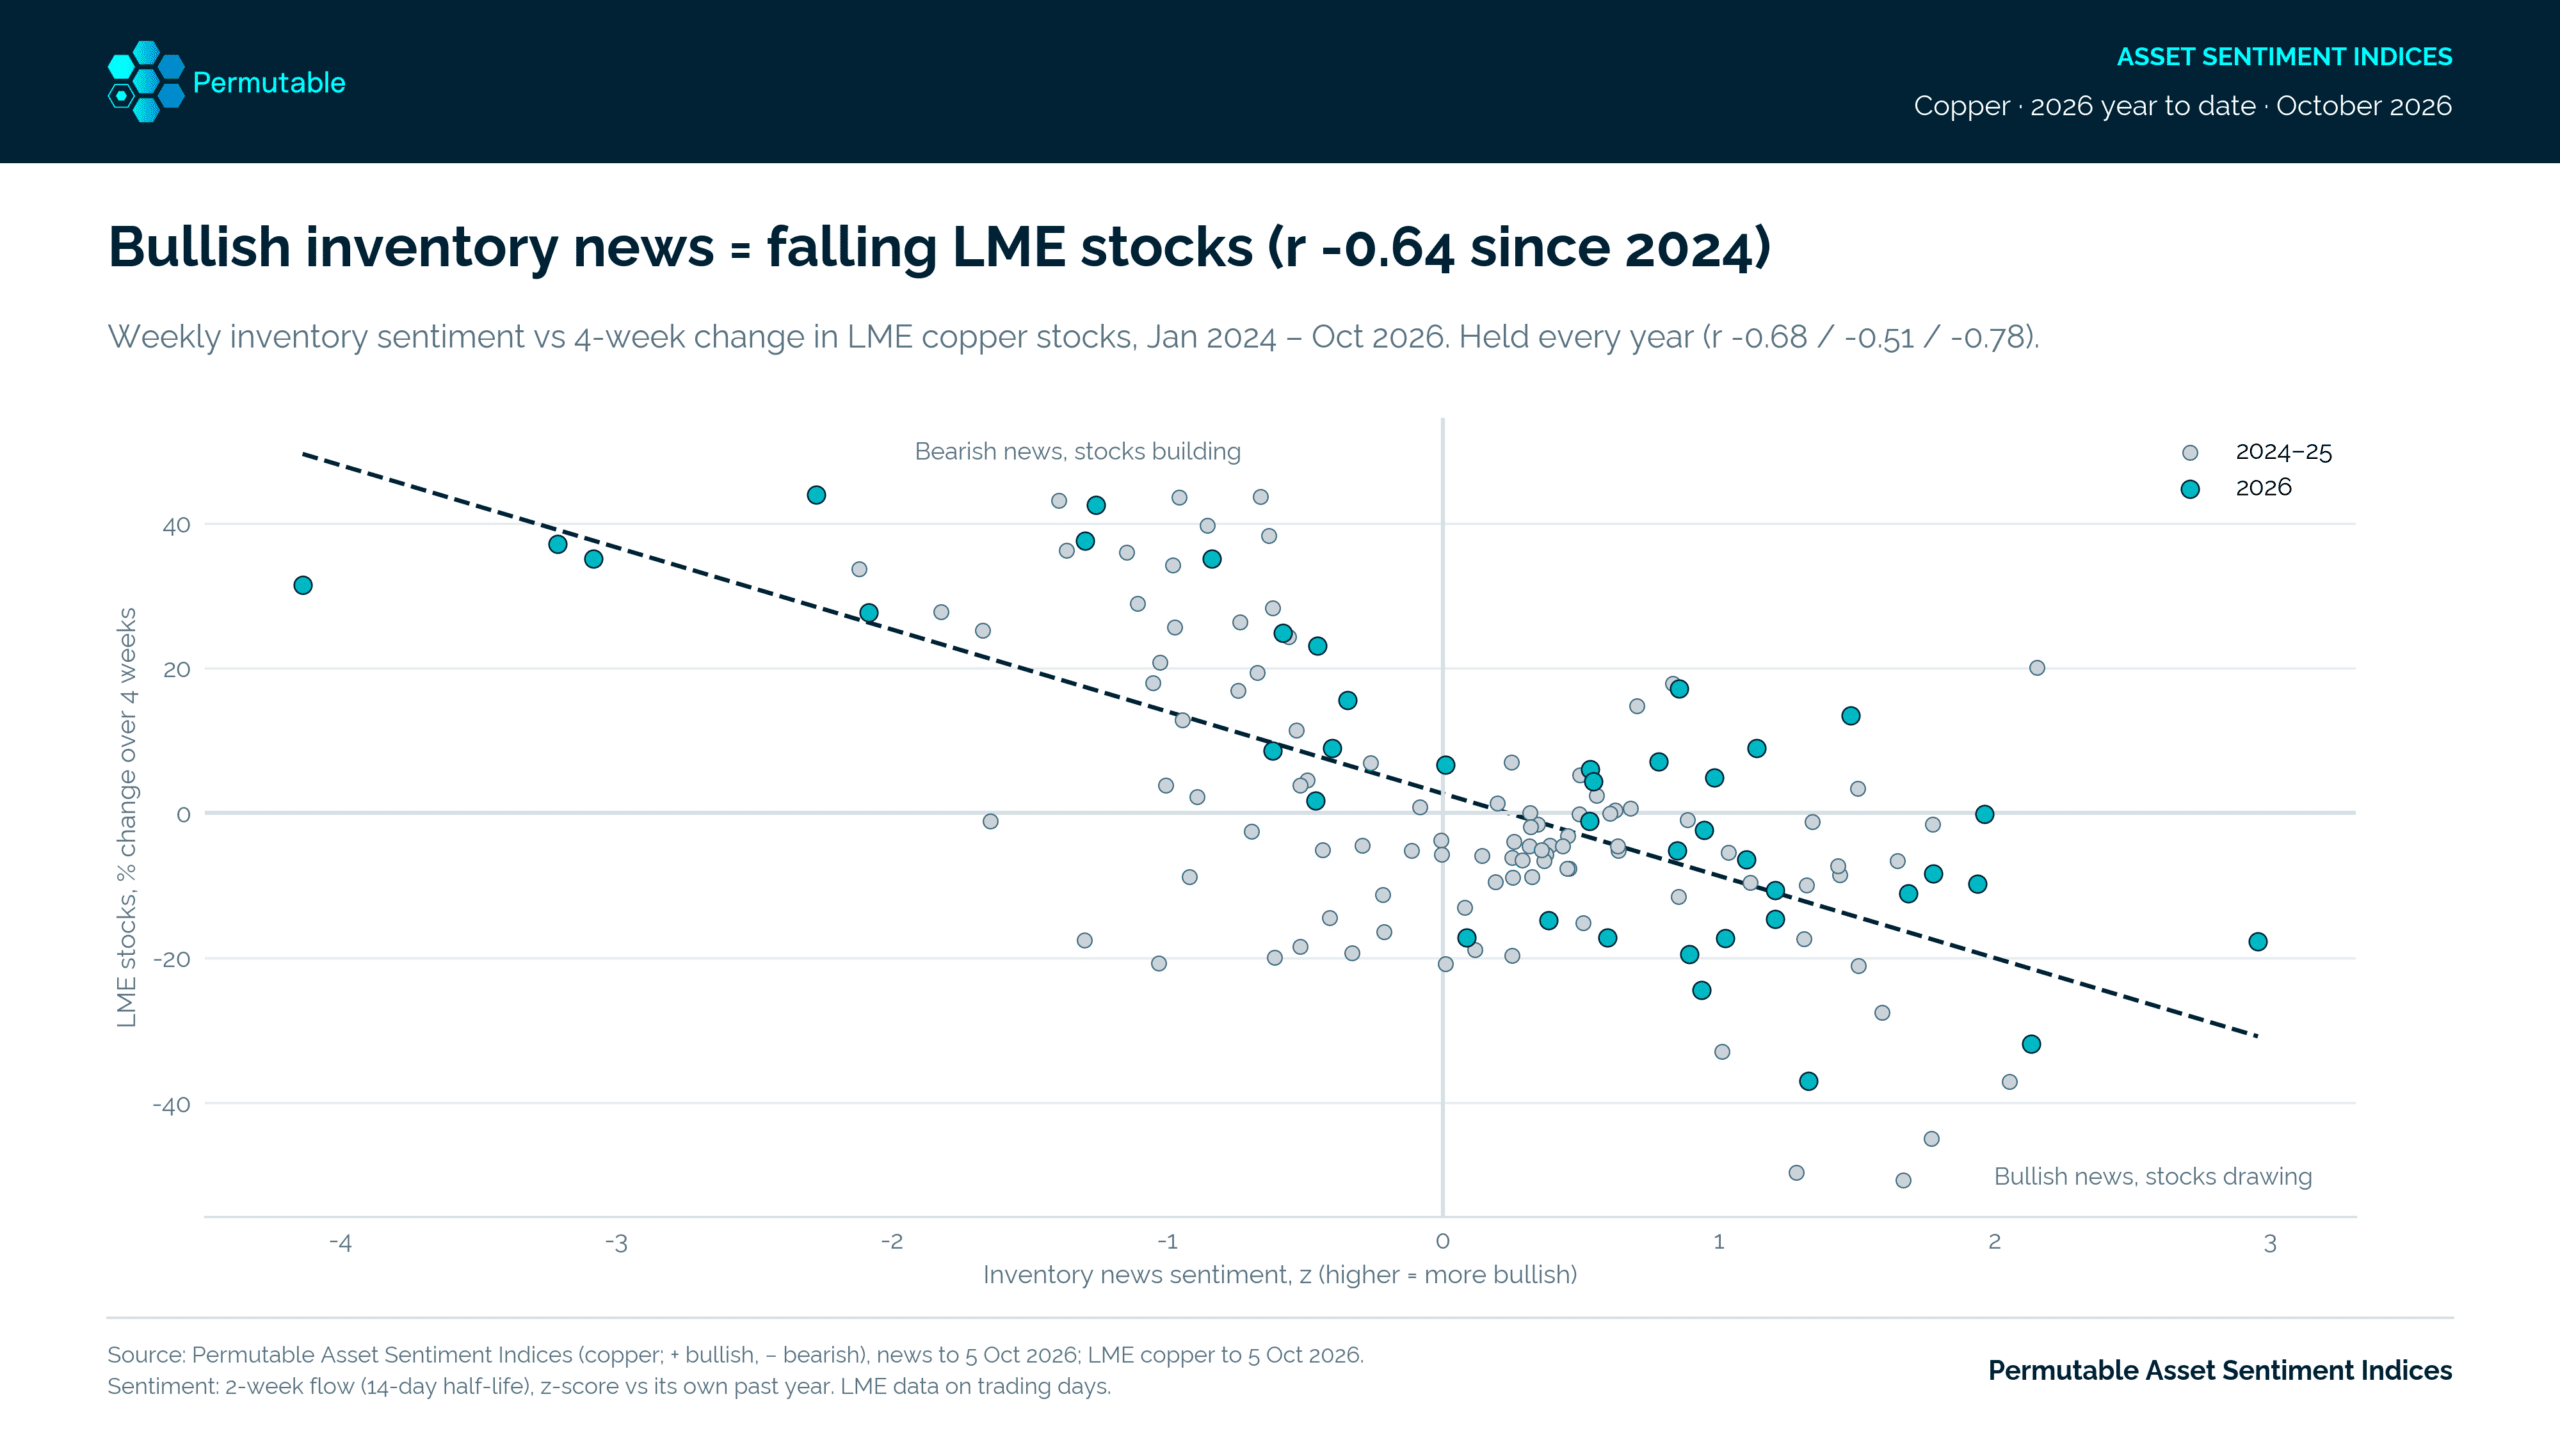
Across a longer sample, the inventory news series has maintained a recurring association with physical warehouse movements, giving the May episode a broader empirical context. Since January 2024, weekly inventory sentiment has correlated at −0.64 with four-week changes in LME stocks. The inverse relationship appears in each annual sample, with correlations ranging from −0.51 to −0.78, as more bullish coverage has accompanied larger stock draws (Chart 3).

Copper inventory_vs_stocks

Copper Supply Disruption Sentiment at Its Highest Since 2022

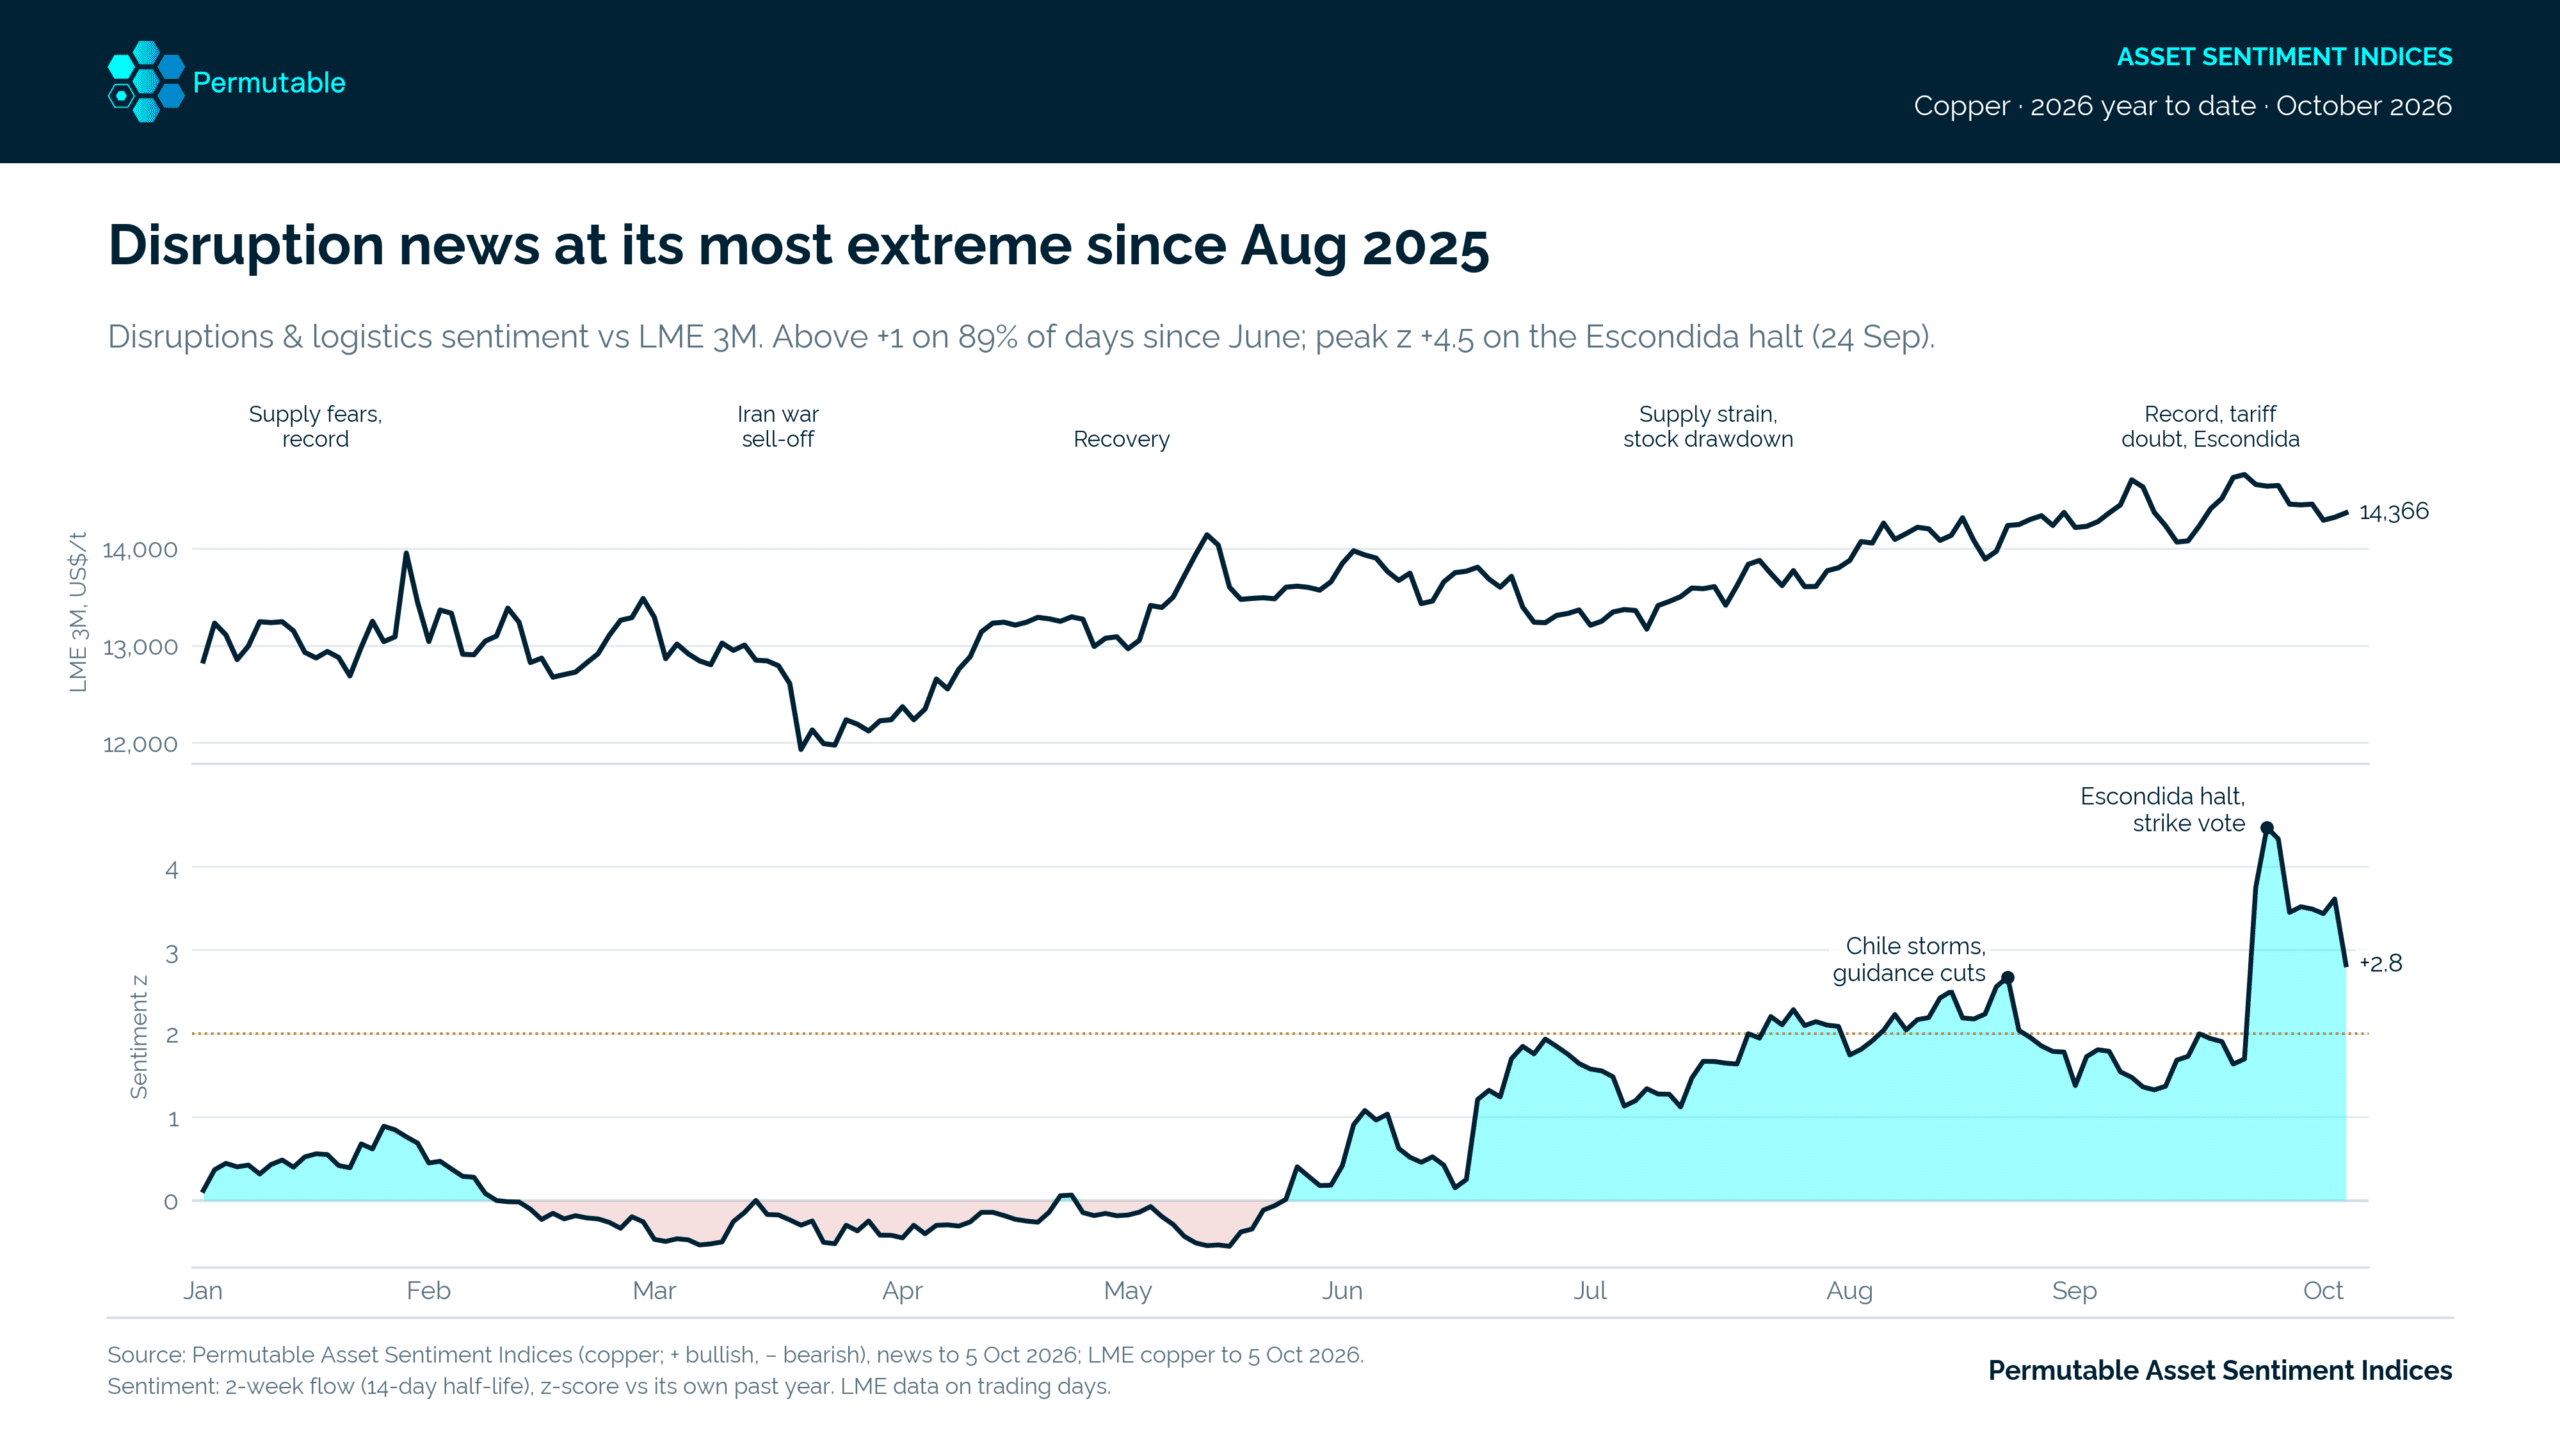
From June onwards, disruption coverage has shown particular persistence, exceeding one standard deviation above its trailing-year norm on 89% of days. The reading peaked at +4.5 on 24 September, following the temporary halt at Escondida, and remained elevated at +2.8 on 5 October. Chilean weather interruptions, production guidance cuts and unresolved labour negotiations have sustained this concentration of bullish supply news (Chart 4).

Copper supply sentiment

Following supervisors’ rejection of a contract offer at Escondida, the request for mediation on 5 October left the prospect of a stoppage unresolved. The negotiations create a risk to future availability, with the strike vote preceding any confirmed additional production loss. Their outcome carries significance while disruption sentiment remains elevated and nearby metal continues to command a premium.

The rebuilding of LME stocks to 244,900 tonnes nevertheless qualifies the severity of current physical pressure, alongside the substantial narrowing in backwardation since August. Warehouse holdings remain well below April’s peak, but the recovered buffer indicates some relief from the summer’s most acute conditions. A 3,750-tonne draw on 5 October, coinciding with the widening cash premium, deserves scrutiny as a fresh movement within that recovery.

As Chinese buyers return from the holiday break and Chilean negotiations proceed, inventory changes and nearby spreads will provide immediate checks on whether supply concern translates into renewed delivery pressure. Firmer industrial-demand coverage or a sustained improvement in rates sentiment could broaden the support for benchmark prices, while replenishing warehouses and a contracting cash premium would indicate easing availability. Permutable’s Asset Sentiment Indices allow those developments to be followed alongside the physical market, retaining the connection between emerging news, observable stock movements and the price of access to metal.

Methodology: Permutable scores news for its bullish or bearish implications for copper, contributing positively or negatively to the underlying Asset Sentiment measure. The charts use a news-flow measure with a 14-day half-life, standardised against each theme’s trailing year. Historical correlations establish association; the ten-week interval describes the May–July 2026 episode.


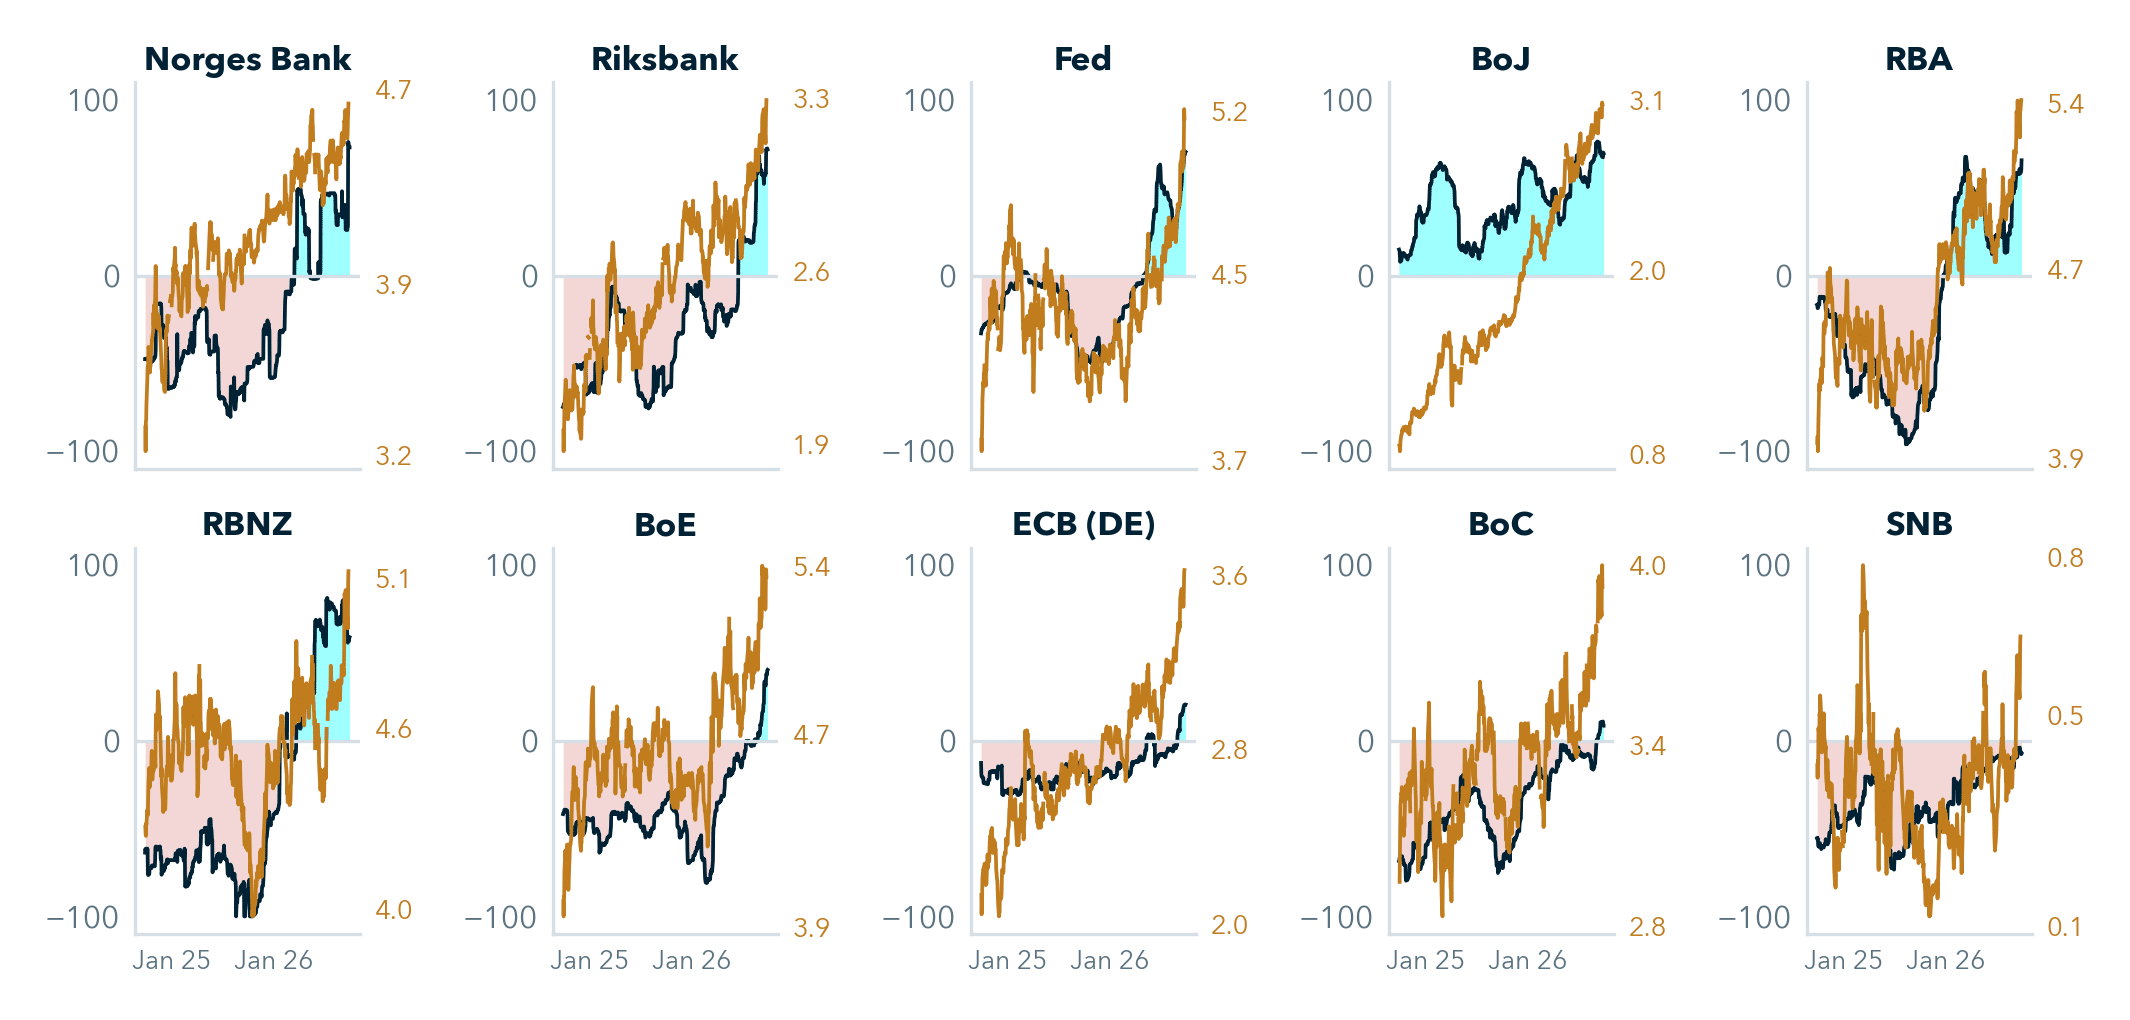
The Hawkish Turn: G10 Central Bank Policy Outlook into Q4 2026

The RBA’s hike and a Fed back in tightening mode frame the run into Q4. Our Global Macro Sentiment Indices (GMSI) show how the G10 policy debate has turned, and where it is still building.

The Reserve Bank of Australia lifted the cash rate by 25bp to 4.60% on 29 September, a unanimous decision that takes it to its highest level since October 2011 and marks its fourth hike this year. The Board noted that global energy prices are now “much higher than had been assumed” in its August forecasts, and it will do what is necessary, “including increasing the cash rate target further if needed”.

The RBA is not moving in isolation. The Fed resumed tightening in September. US 10-year yields rose by about 49bp between the end of August and 28 September, to 5.24%, their highest since 2007. With Brent above US$100 a barrel and inflation rising again, the conversation across the G10 has turned firmly towards tightening.

Our Global Macro Sentiment Indices read news on each economy’s monetary-policy outlook every hour and score each headline from −1, fully dovish, to +1, fully hawkish. Because it is built from news rather than prices, directional sentiment gives an independent, real-time read to set alongside market pricing and forecasts.

Read the full analysis here: GMSI_g10_policy_outlook_Q4_2026

What the signal is telling us

  • The turn is broad. A year ago directional sentiment leaned dovish in nine of the G10 economies. Today it is positive in nine, and six sit firmly in hawkish territory.
  • Europe is where it is shifting fastest. The ECB and the Bank of England are the most unusual against their own past two years, even though their sentiment is only modestly hawkish.
  • The build-up can be seen as it forms. RBA sentiment climbed steadily through September into its hike.

G10 policy gauges

How quickly sentiment has changed

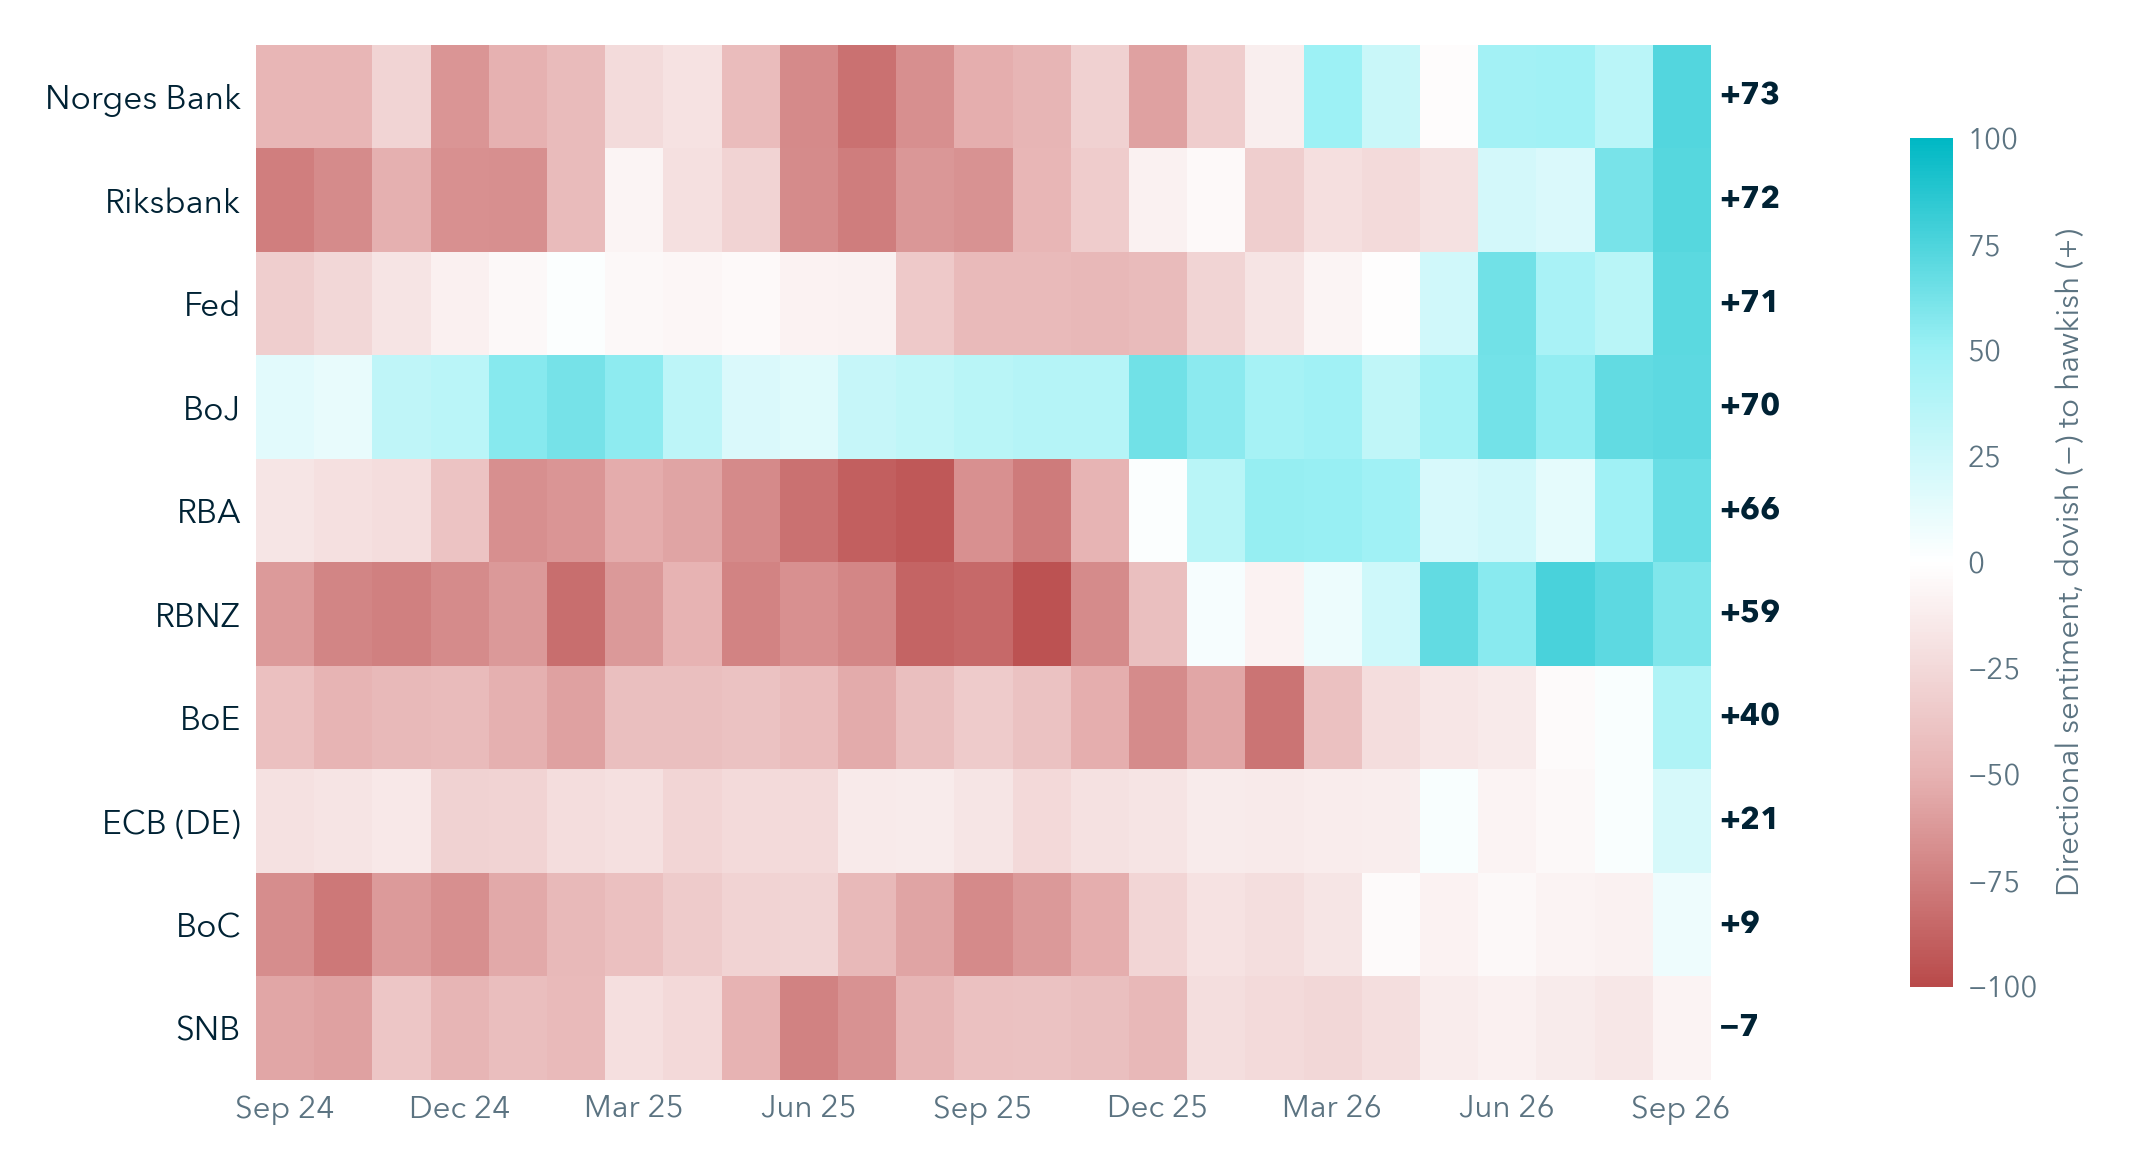
Through most of 2025 directional sentiment leaned dovish across the G10 central banks eased. It began to turn around the new year, first in Australia, then in Norway and New Zealand by the spring, and more broadly through the summer as the energy shock took hold. Japan is the exception, hawkish throughout as the Bank of Japan continued to normalise policy.

G10 policy heatmap

Sentiment and the market move together

Where sentiment turned hawkish, local yields rose alongside it, most clearly in Australia, New Zealand, Sweden and the UK. That is co-movement rather than cause and effect, and sentiment does not lead the next move in yields. Its value lies in reading the narrative behind a move as it happens, and in confirming or challenging a view as the story develops.

Policy sentiment and 10yr

Where sentiment stands into Q4

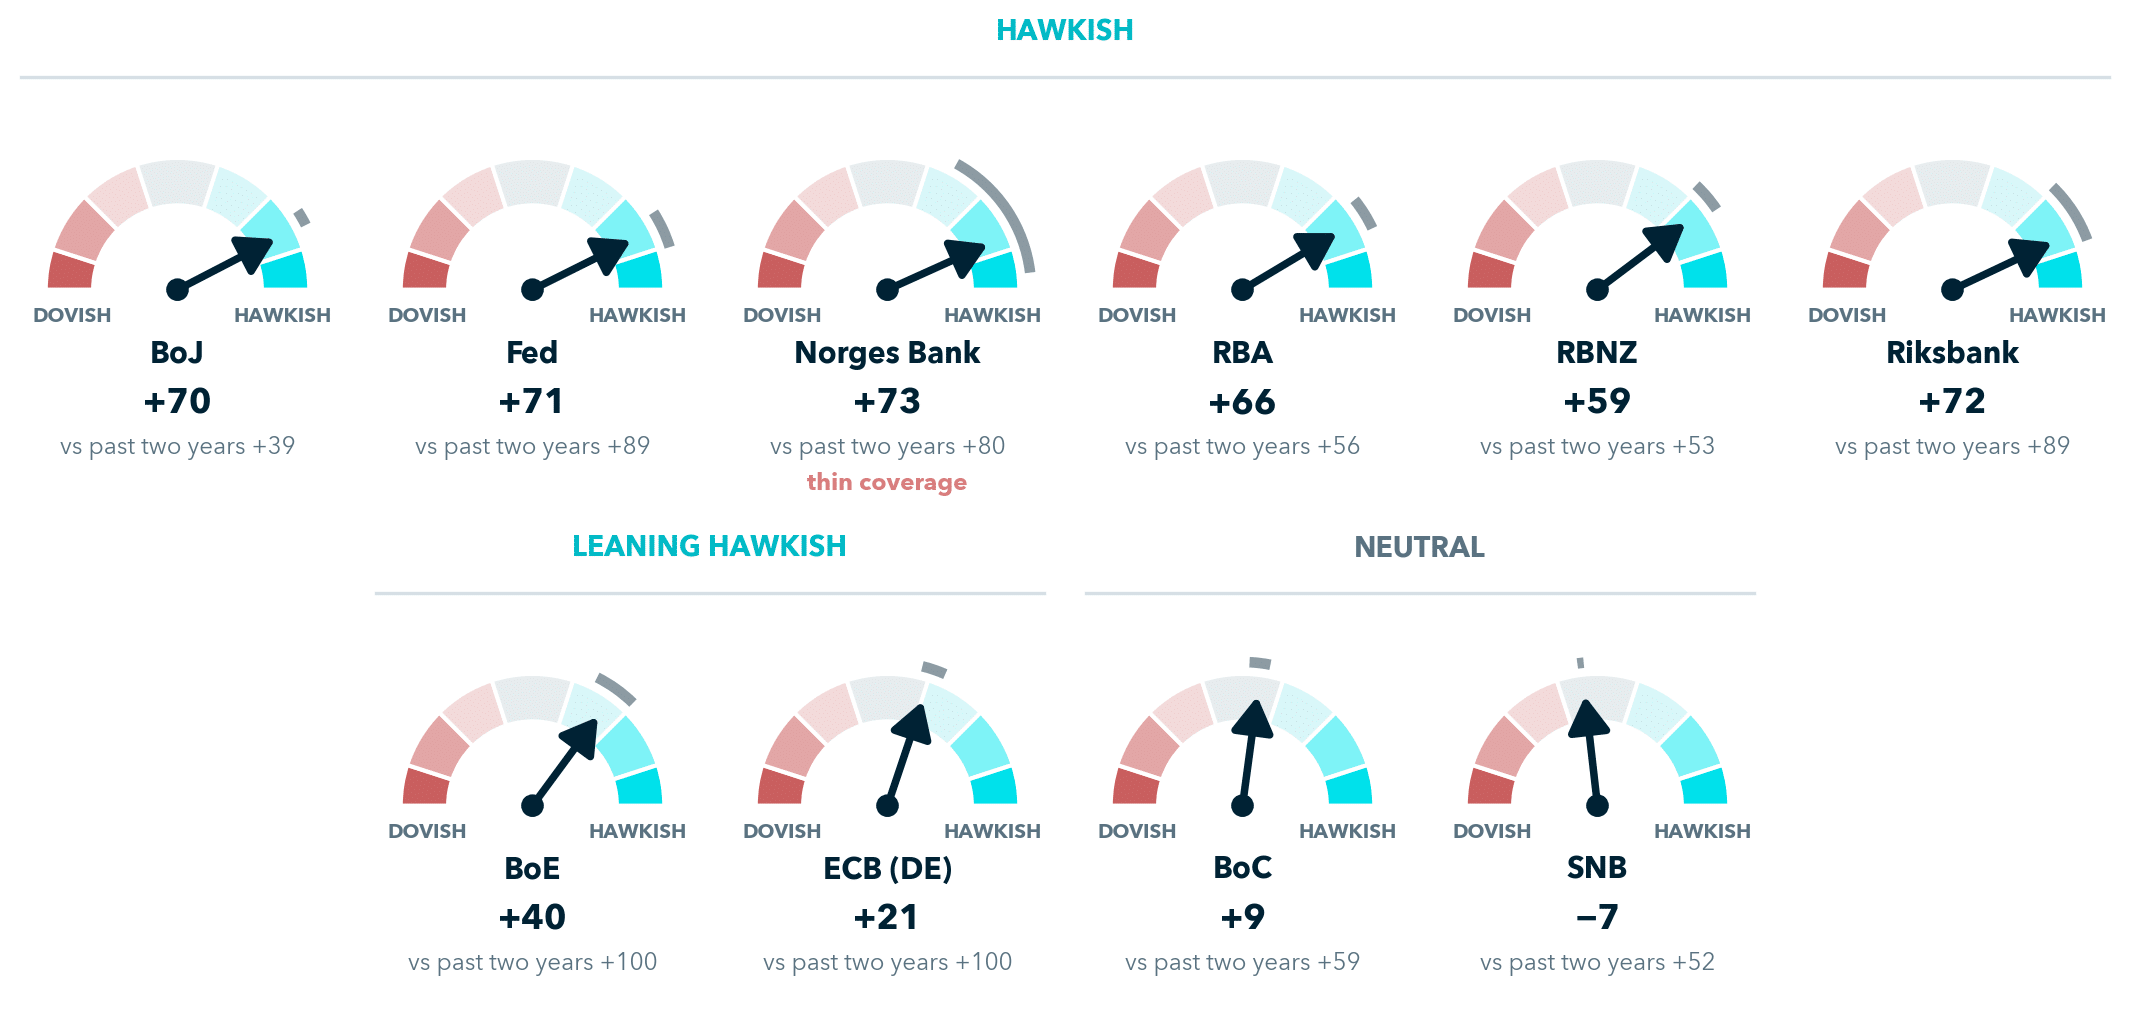
The Q4 decision run opens on 28 October with the Fed, the Bank of Canada and the RBNZ, and runs through to the SNB on 10 December. On balance, we see hawkish pressure as most likely to keep building in Europe, where sentiment is most unusual against its own past two years.

Central bank Next Sentiment vs past two years Our read
Bank of Canada 28 Oct +9 +59 Hike odds rising, but sentiment is still neutral
Federal Reserve 28 Oct +71 +89 Resumed hiking, with further moves in play
RBNZ 28 Oct +59 +53 Another hike may be needed this year
ECB (Germany proxy) 29 Oct +21 +100 A hold looks likely, with December in focus
Bank of Japan 30 Oct +70 +39 A hold looks likely, with December in view
RBA 3 Nov +66 +56 Door left open to further tightening
Sveriges Riksbank 4 Nov +72 +89 Several hikes flagged, so November is in play
Bank of England 5 Nov +40 +100 Split six to three in September, November looks live
Norges Bank 5 Nov +73 +80 Hiked in September and ready to act again, on thin coverage
Swiss National Bank 10 Dec −7 +52 On hold at 0%, with a hold expected

Directional sentiment runs from −100 to +100. vs past two years compares it with the bank’s own last two years, where +100 is the top of its range.

Three meetings stand out

  • Bank of England, 5 November. After a six-to-three hold, the meeting looks live. Sentiment of +40 is moderate in outright terms but well above its own past two years.
  • ECB, 29 October. Coverage points to December, when new projections are due. Yet German coverage is the most unusual in the G10 against its own past two years, which we read as a debate turning quickly from a low base.
  • RBNZ, 28 October. With sentiment at +59, below its July high of +81, our reading does not point to pressure for an earlier move.

How we build the signal

Every headline on an economy’s monetary-policy outlook receives a directional score from −1, fully dovish, to +1, fully hawkish. Each reading uses only data dated up to that day, and gauges built on news from fewer than 20 of the past 30 days carry a warning for each G10 central bank applicable.

The index measures the balance of the policy debate. It is not a forecast of decisions or yields, and nothing here is investment advice.

The complete guide to early macro regime sentiment signals for hedge funds and institutional investors

This guide explains how institutional investors can identify macro regime shifts before official data confirms them. It covers real-time sentiment, alternative economic data, volatility, correlations, change-point detection and regime-switching models, then shows how to examine how signals may inform institutional research and risk frameworks. It is designed for global macro portfolio managers, quantitative researchers, rates and FX desks, systematic teams, risk professionals and asset allocators. Research use only. This article does not constitute investment advice or a recommendation to undertake any investment activity.

Macro regime shifts do not arrive with a press release. By the time an inflation cycle, policy reversal or rates repricing appears clearly in official data, much of the market adjustment has already taken place. For portfolio managers and quantitative researchers at global macro hedge funds, the real challenge is identifying when the relationship between data, policy language and asset prices has begun to change and whether that change is likely to persist.

This guide walks you through the signals, tools and workflows that help you detect macro regime shifts before official releases confirm them. From real-time sentiment indicators and alternative economic data to statistical detection methods and practical institutional frameworks, you will find everything you need to build a regime-aware research and trading process. Permutable AI delivers structured, source-linked macro sentiment signals that give institutional teams an early read on these transitions across more than 95 economies.

Key takeaways: The complete guide to early macro regime signals

  • Macro regime shifts change the statistical properties of returns, volatility and correlations, requiring updated risk and allocation rules.
  • Real-time sentiment and alternative data capture narrative turns before monthly or quarterly official releases confirm them.
  • Effective detection combines multiple signal types: volatility metrics, correlation shifts, momentum decay and macro thresholds.
  • Permutable’s Global Macro Sentiment Indices track inflation, growth and policy narratives across 95+ economies hourly.
  • Institutional teams should demand cross-confirmation, persistence and point-in-time history when evaluating any regime signal.

What is a macro regime shift?

A macro regime shift is a persistent change in the process generating inflation, growth, policy and asset-price behaviour. It is not a single data surprise or one rate decision. It is a structural break in how those variables relate to each other.

Consider the difference between a temporary inflation spike caused by a supply disruption and a sustained shift in wage-setting behaviour, policy tolerance and household expectations that keeps prices elevated for years. The first is noise. The second is a regime change.

James Hamilton’s regime-switching framework treats these breaks as changes in the data-generating process itself, not ordinary fluctuations around a stable trend. For hedge fund portfolio managers and quant researchers, that distinction can effect how teams assess exposure, factor behaviour and risk controls.

Market timing and the imperative of detecting regime shifts

If you are running a macro book, a regime shift changes your expected drawdowns, factor performance and the efficiency of your tactical signals. A momentum strategy optimised for a low-volatility trending environment can fail sharply in a high-volatility mean-reverting one. Hedges that worked under one policy cycle may stop working under another.

The cost of late detection is real. Traders who recognised the March 2020 liquidity shock and the 2021–2022 inflation cycle illustrate how a change in regime can alter volatility, correlations and factor behaviour before the shift becomes fully visible in official data.  The same pattern repeated during the 2021 to 2022 inflation and rate normalisation cycle, where early recognition of a persistent CPI regime enabled timely factor rotation away from long-duration growth.

For macro strategy and rates desks, the edge lies in the lag between a narrative forming and official data confirming it. That window is precisely where real-time sentiment data and alternative signals earn their value.

Four core signal categories for regime detection

Effective regime detection relies on monitoring orthogonal signal types so you capture different dimensions of change. No single indicator is sufficient. You need a dashboard that combines price-based, volatility-based, cross-asset and macro-narrative signals.

Volatility metrics

Realised volatility, implied volatility and the volatility of volatility are your first line of detection. A sharp rise in 21-day realised vol on a benchmark index, combined with an implied-vol spike above historical percentiles, often signals a regime transition forming.

Professionals focus not only on the level of volatility but on how fast it is changing. The ratio of current volatility to a 20-day average can flag instability before a full regime break is visible in price action.

Correlation and liquidity shifts

In stable regimes, pairwise correlations across asset classes remain consistent and diversification works. In unstable regimes, correlations break apart. Average pairwise correlation rising toward 0.6 or higher across an equity basket often signals systemic risk building.

Widening bid-ask spreads and declining market depth add confirmation. When liquidity withdraws, execution strategies lose effectiveness, and the operational environment changes even before price trends reverse.

Momentum and trend decay

Before a regime shift, you often see weaker trend continuation, faster pullbacks, failed breakouts and shorter trend durations. Monitoring return autocorrelation, moving-average slope reduction and breakout failure rates helps quantify this momentum decay.

When momentum weakens at the same time volatility rises, the probability of a regime change forming is materially higher than when either signal appears in isolation.

Real-time macro sentiment and narrative signals

Official economic data (CPI, GDP, unemployment) arrives monthly or quarterly, often with revision lags of weeks to months. Macro sentiment signals fill the gap by tracking how inflation, growth and policy narratives develop across news sources, central-bank commentary and local reporting in real time.

At Permutable, our Global Macro Sentiment Indices convert this information flow into structured, hourly, point-in-time signals across countries and macro topics. The indices separate domestic reporting from international perception, allowing you to identify when local conditions and external market narratives begin to diverge, a pattern that often precedes currency, rates or sovereign-risk repricing.

How alternative economic data captures regime shifts before official releases

Traditional macroeconomic data remains central to investment research, but it is inherently delayed. Markets frequently reprice expectations before official releases are published. Alternative data fills the information gap by drawing on sources that move faster than government statistics.
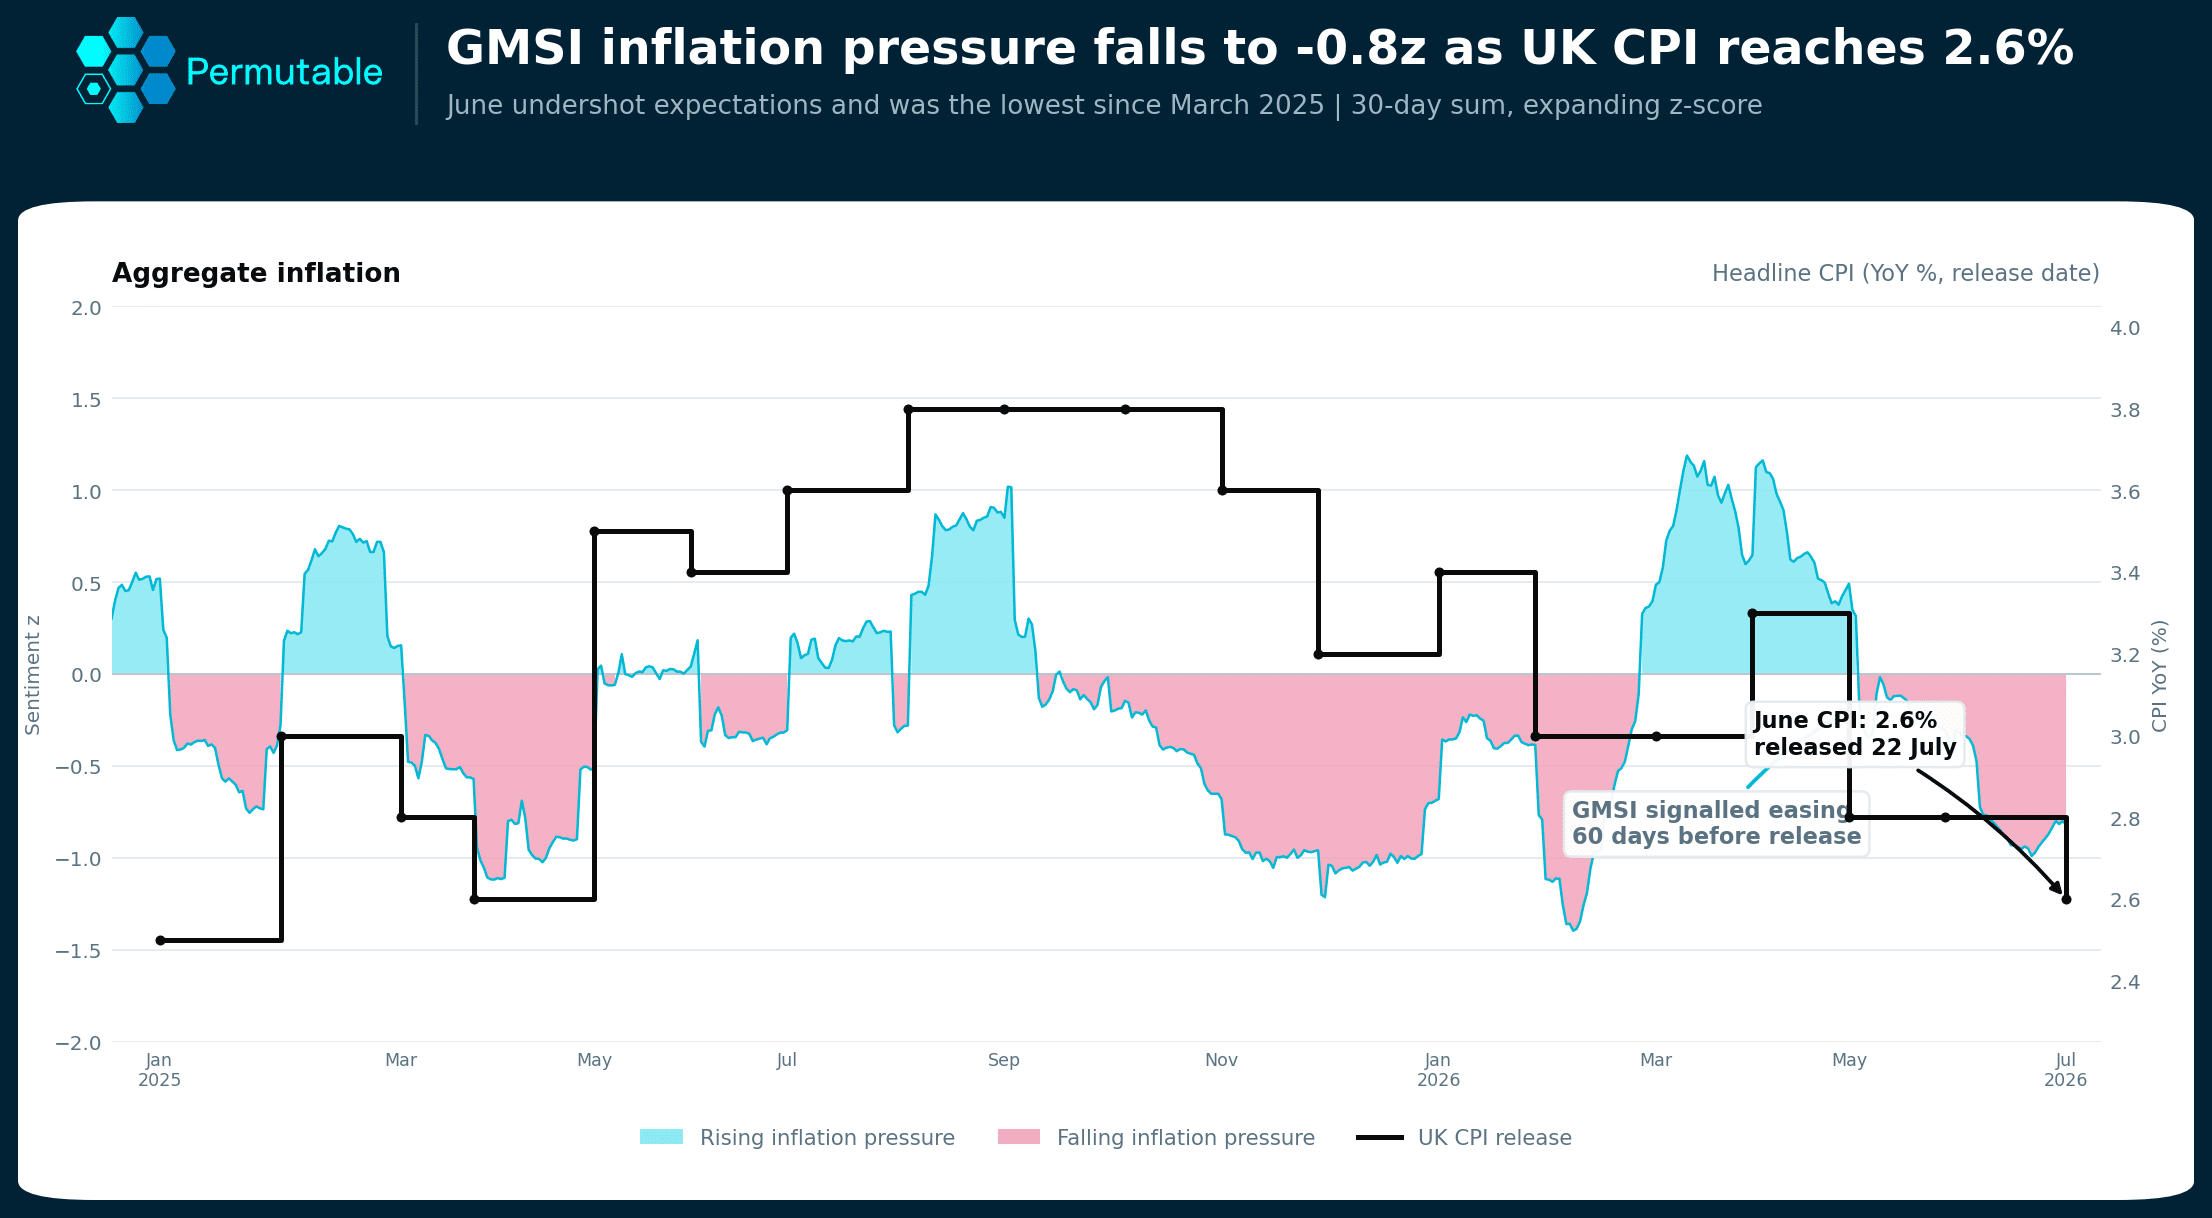
Chart comparing Permutable’s point-in-time UK inflation pressure signal with annual UK CPI inflation in 2026. Rising pressure peaks near +1.2 standard deviations in early spring before the signal turns negative during May and reaches −0.8z by 22 July. UK CPI remains at 2.8% in May before falling to 2.6% in June.

Above: UK inflation pressure versus CPI – Permutable’s point-in-time UK inflation-pressure signal turned lower before the decline appeared in annual CPI, illustrating the window between a changing narrative and confirmation in official data.

Narrative-based macro signals

Changes in inflation expectations, for instance, may first appear through local reporting on wages, food prices and transport costs, or through central-bank commentary and political pressure linked to cost-of-living concerns. Labour-market weakness or fiscal stress can similarly emerge in local reporting before it becomes visible in official statistics.

A 2025 ECB working paper found that newspaper-based sentiment indicators contain timely economic information that can materially improve euro-area GDP nowcasts, confirming what institutional teams have observed in practice: narrative data moves ahead of the data it describes. (ECB Working Paper No. 3122)

Domestic versus international sentiment divergence

One of the most differentiated signals in alternative macro data is the gap between domestic and international narrative coverage. Domestic sentiment captures local-language reporting and on-the-ground economic discussion. International sentiment reflects how a country is perceived externally through institutional media and global macro commentary.

The two can diverge materially. When local reporting on an economy remains constructive but international coverage turns negative, or the reverse, a repricing of sovereign risk, currency or rates positioning may be forming. This domestic-international spread has proved especially relevant in emerging markets like Turkey, Brazil and China, where narrative overshoots can drive significant portfolio impact.
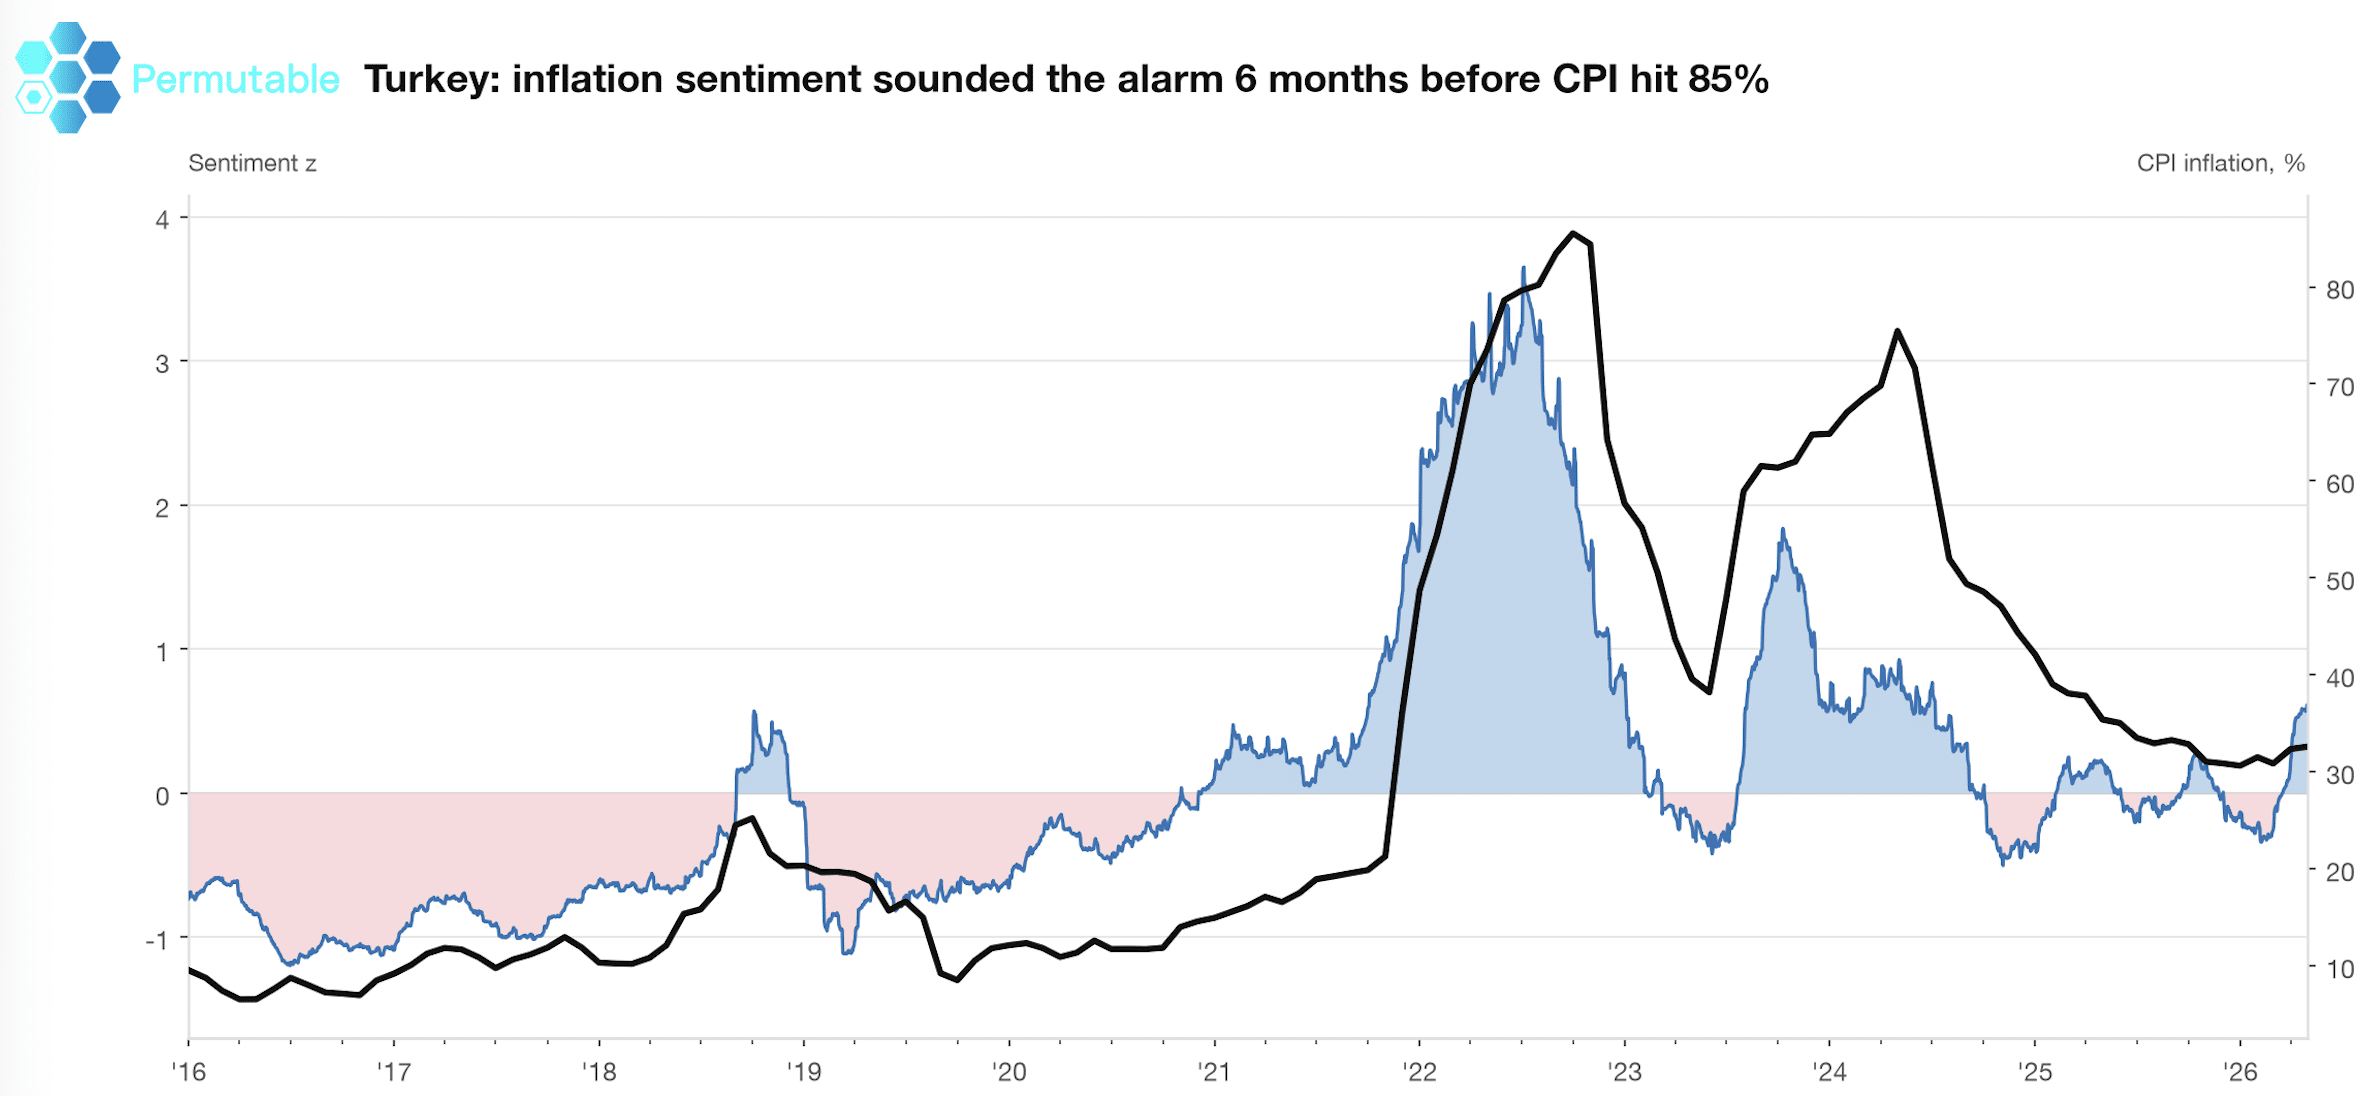
Chart showing Turkey inflation sentiment rising before CPI reached 85% in 2022, using Permutable’s Global Macro Sentiment Indices to track inflation pressure.

Above: Turkey inflation sentiment versus CPI – Turkey’s inflation sentiment began rising six to nine months before CPI peaked above 85% in 2022 and turned lower before the official peak, capturing the transition from acceleration towards gradual normalisation.

Statistical methods for detecting regime changes

Advanced institutional teams use statistical methods to formalise detection and reduce subjectivity. These approaches turn intuition into testable, repeatable processes.

Rolling Z-scores and threshold-based alerts

Computing rolling means and standard deviations for your key indicators and converting them to z-scores relative to a long baseline (commonly 252 trading days) gives you a standardised measure of abnormality. A z-score crossing plus or minus 2 signals an unusual move worth investigating further.

For example, if 21-day realised vol on your benchmark rises from 12 per cent to 28 per cent and its z-score exceeds 2.5 relative to the trailing year, treat it as initial evidence of a volatility regime change.

Change-point detection algorithms

Algorithms such as CUSUM, Bayesian online change-point detection and Pruned Exact Linear Time (PELT) locate structural breaks in mean or variance with timestamped precision. They work well for single-series detection, such as identifying a break in the realised volatility of a specific index or currency pair.

The key discipline is cross-checking the detected point against other series to avoid false alarms. A break in one series alone may be noise. A break confirmed across volatility, correlation and macro sentiment is far more credible.

Hidden Markov Models and Markov-Switching Frameworks

Hidden Markov Models assign probabilities to discrete latent states such as low-volatility trending, high-volatility mean-reverting and transitional. They produce state probabilities that can be evaluated as inputs to internally governed research and risk processes.

Fit a two- or three-state HMM to daily returns and realised vol for your benchmark. A persistent probability above an internally tested threshold may provide a candidate regime indication for further investigation. The 0.6 level is illustrative rather than universal. Permutable’s point-in-time macro sentiment history, with over 11 years of data, can serve as an additional feature layer for these models.

GARCH and Volatility Forecasting

GARCH-family models generate short-term volatility forecasts and flag sudden increases in expected variance. If the GARCH forecast rises sharply and is confirmed by realised moves and implied-vol data, the evidence for a regime shift strengthens.

Consider augmenting GARCH forecasts with realised-volatility measures to capture jumps and intraday variance that standard GARCH specifications may undercount.

GMSI for quant regime detection

A quant desk doesn’t need a macro call. It needs a state variable: what regime are we in, right now, before the next print. GMSI Directional sentiment supplies that directly, sourced from policy news and standardised into a point-in-time z-score, with no forecast layer and no economist’s judgement sitting between the headline and the signal.
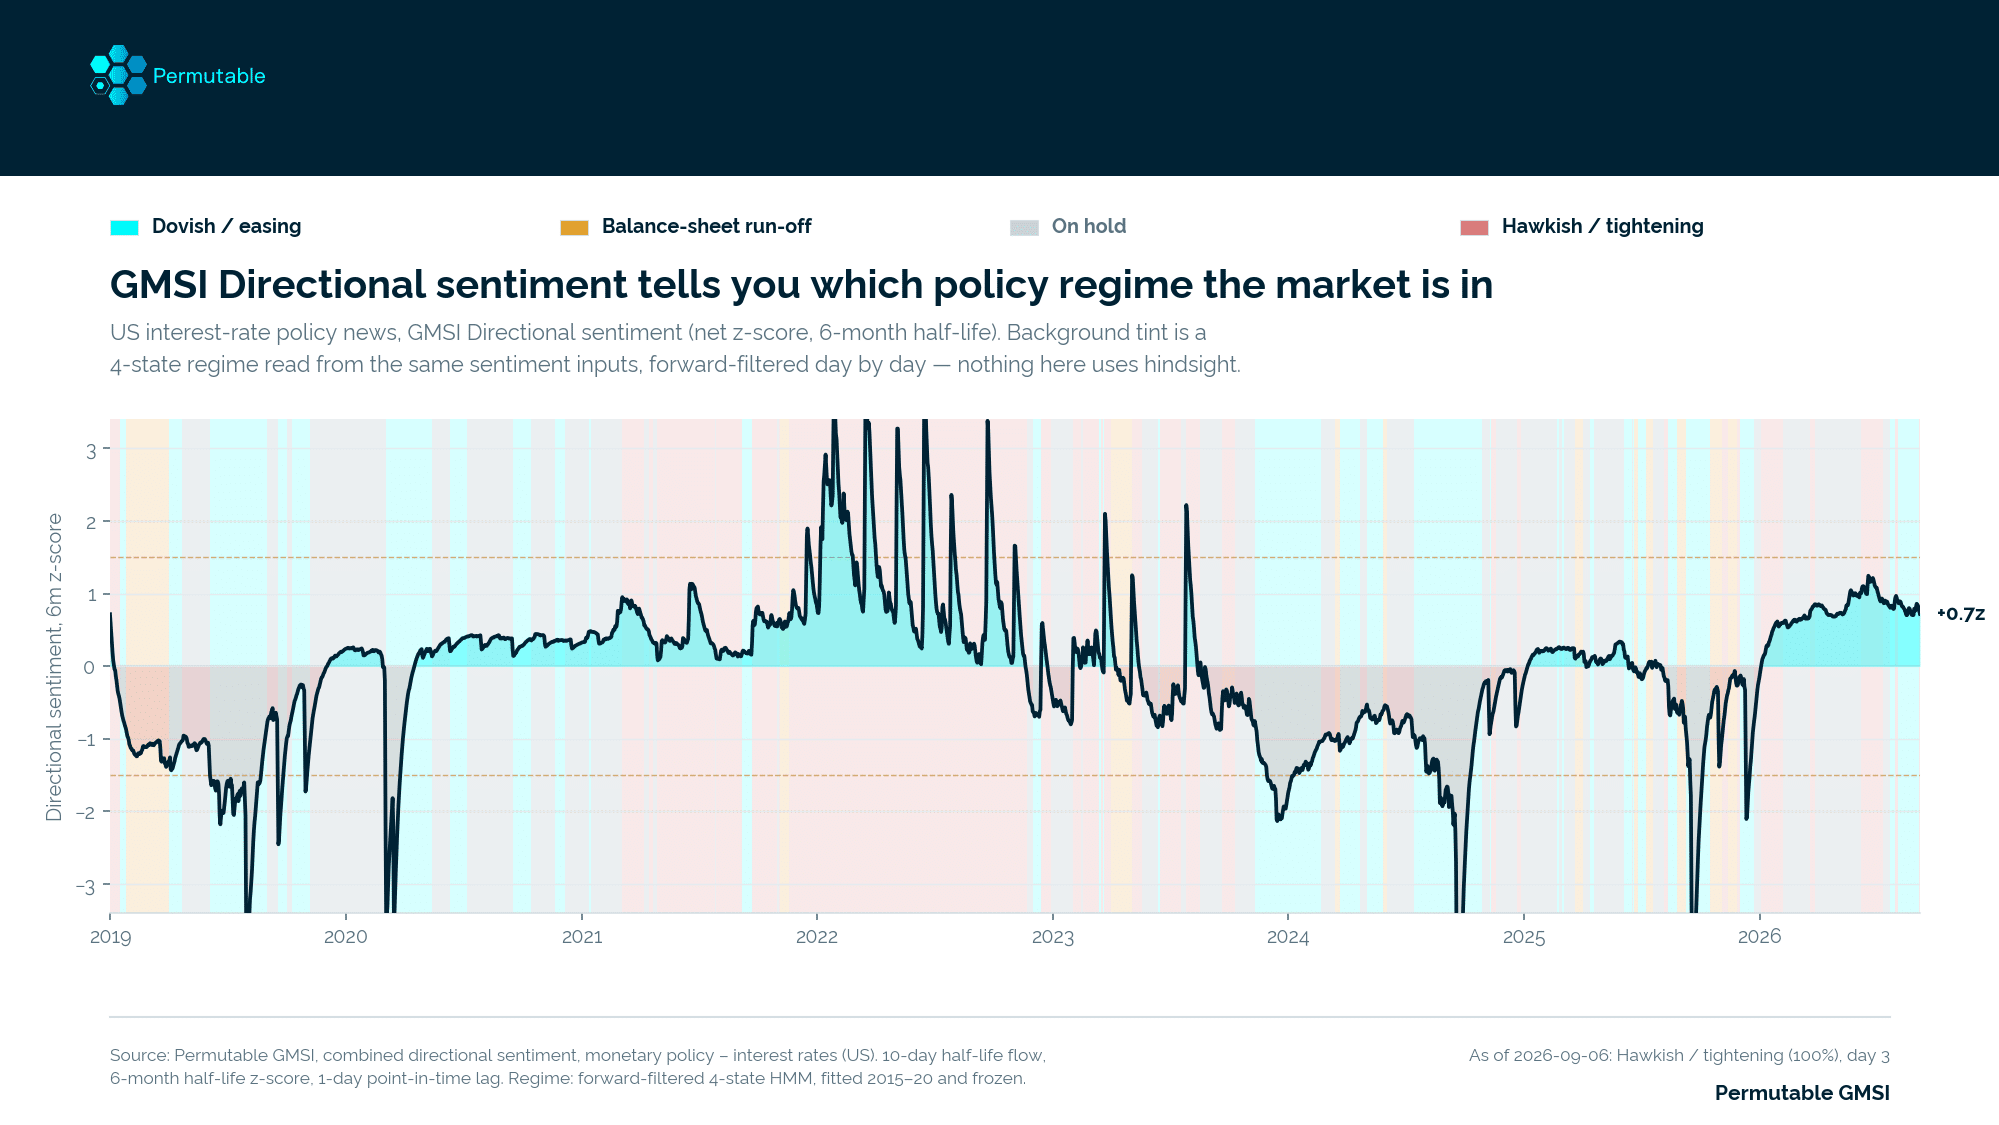
Graph showing market sentiment policy trends from Permutable data

Reading the chart in front of you

The navy line is GMSI Directional sentiment on US interest-rate policy news: a 10-day half-life news flow, standardised against its own trailing six-month window (a 182-day half-life z-score), lagged one day so no observation ever informs its own baseline. That’s the only input.

The coloured bands behind it are the output of a four-state hidden Markov model fitted on that sentiment alone: dovish/easing, balance-sheet run-off, on hold, hawkish/tightening. The state is forward-filtered day by day, meaning the label on any given date uses only information available up to that date, nothing after it.

As of 6 September 2026 the model reads hawkish/tightening at 100% posterior probability, three days into that call, with sentiment printing +0.7z. Tested against five years of US Treasury yields, days the model flagged hawkish carried the entire multi-year rise in the 10-year. Not a lagging confirmation: a same-day read.

Beyond this one chart

The same construction, topic sentiment to half-life z-score to state-space regime model, runs on any GMSI-covered topic or country: other central banks, fiscal stance, trade and tariff risk, geopolitical tension, supply-chain disruption. It scales from a single-country monitor to a cross-country divergence read (who’s hawkish relative to whom), and from a discrete regime label to a continuous conditioning variable for sizing exposure or risk budget rather than switching it on and off.

Why it’s useful, and why it’s orthogonal

  • Real-time. Hourly news flow, no release lag, no revision cycle. The regime updates the day the language shifts, not the day a data print confirms it.
  • Deterministic. A fixed, specified pipeline from headline to z-score to regime. Same inputs produce the same output every time: no survey, no committee, nothing to re-run and get a different answer from.
  • Orthogonal. Built from language, not from price or positioning. It’s an independent state variable, not a repackaged momentum or carry signal, which is what makes it worth stacking against a desk’s existing inputs: for confirmation, for diversification, or as an early flag when sentiment and price disagree.

A practical institutional framework for confirming regime shifts

A single spike in any indicator is rarely enough to declare a regime change. You need rules that demand persistence and cross-confirmation. Here is a multi-step decision framework you can implement and adapt to your time horizon.

Step 1: Initial trigger

One indicator crosses a high-sensitivity threshold. For example, 21-day realised vol z-score exceeds plus 2 relative to the trailing 252 days.

Step 2: Cross-confirmation

A second independent indicator confirms the signal. This could be VIX above its 90th percentile, average pairwise correlation exceeding 0.55 or a sharp move in macro sentiment across multiple topics.

Step 3: Persistence test

The joint signal persists for a defined number of sessions, typically three to seven days depending on your holding period. Transient spikes that revert in one to two days are filtered out.

Step 4: Macro Filter

A macro threshold is met: CPI year-on-year above a defined trigger, a yield-curve move exceeding 75 basis points in a month, or a sustained shift in policy-outlook sentiment.

Step 5: Activation

Subject to internal validation, mandate constraints and governance, teams may then consider applying their predefined regime-specific framework

This layered logic reduces whipsaw risk. You can tune the thresholds and persistence windows through out-of-sample validation and walk-forward testing.

Real-world case Studies: Regime shifts in Japan, Turkey and Brazil

Three recent examples illustrate how different dimensions of regime change appear in practice and how early narrative signals help identify them.

Japan: When policy sentiment diverges from yield behaviour

Following the Bank of Japan’s exit from negative interest rates and yield-curve control in March 2024, monetary-policy sentiment moved sharply higher. By 2026, that sentiment had cooled considerably. Yet the 10-year JGB yield continued rising toward 2.5 per cent rather than returning to its pre-normalisation range.

That divergence between cooling policy narrative and persistent yield repricing signals a structural regime shift. The market is no longer treating the exit from ultra-loose policy as temporary. For rates desks, the relevant question becomes: what evidence would be required for the market to price the old regime again?
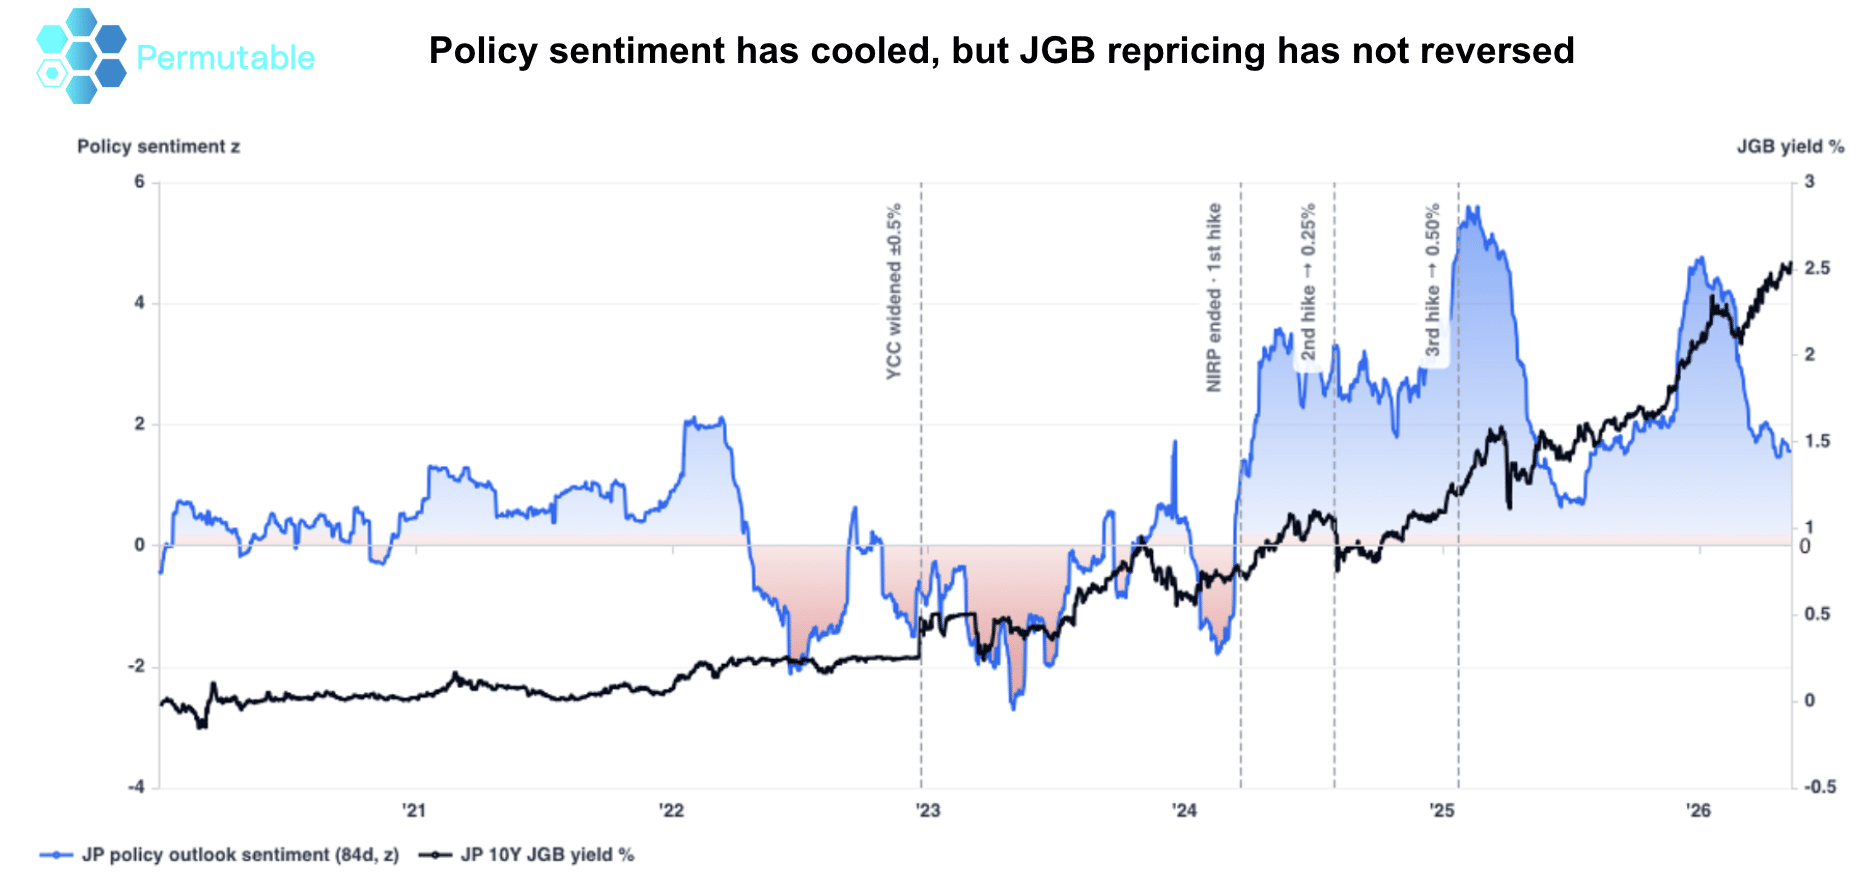
Chart comparing Permutable’s 84-day Japan policy-outlook sentiment z-score with the 10-year JGB yield from 2020 to 2026. Policy sentiment rose sharply as the Bank of Japan ended negative rates and raised rates, then cooled, while the 10-year yield continued higher towards 2.5%.

Turkey: Distinguishing a falling CPI from a broken inflation process

Annual CPI can fall because of base effects while the forces sustaining inflation, including currency weakness, wage resets, administered-price increases and household expectations, remain active. Turkey demonstrates why a lower headline number alone does not confirm a regime exit.

A credible turn becomes visible only when multiple channels change together: weaker pass-through in local reporting, pricing pressure losing breadth, demand softening and inflation sentiment falling and staying lower rather than rebounding after one favourable release.

Brazil: When the policy reaction function shifts

In Brazil, the regime signal lies in the reaction function, not the policy rate level. A central bank can continue cutting rates in a relatively hawkish environment if its communication stresses limited room to ease, fiscal uncertainty or renewed inflation risk.

The turning points occur when one policy narrative loses dominance and another gains control. For FX and rates investors, recognising that transition early helps separate a temporary repricing around a single meeting from a broader change in the expected direction and pace of the policy cycle.
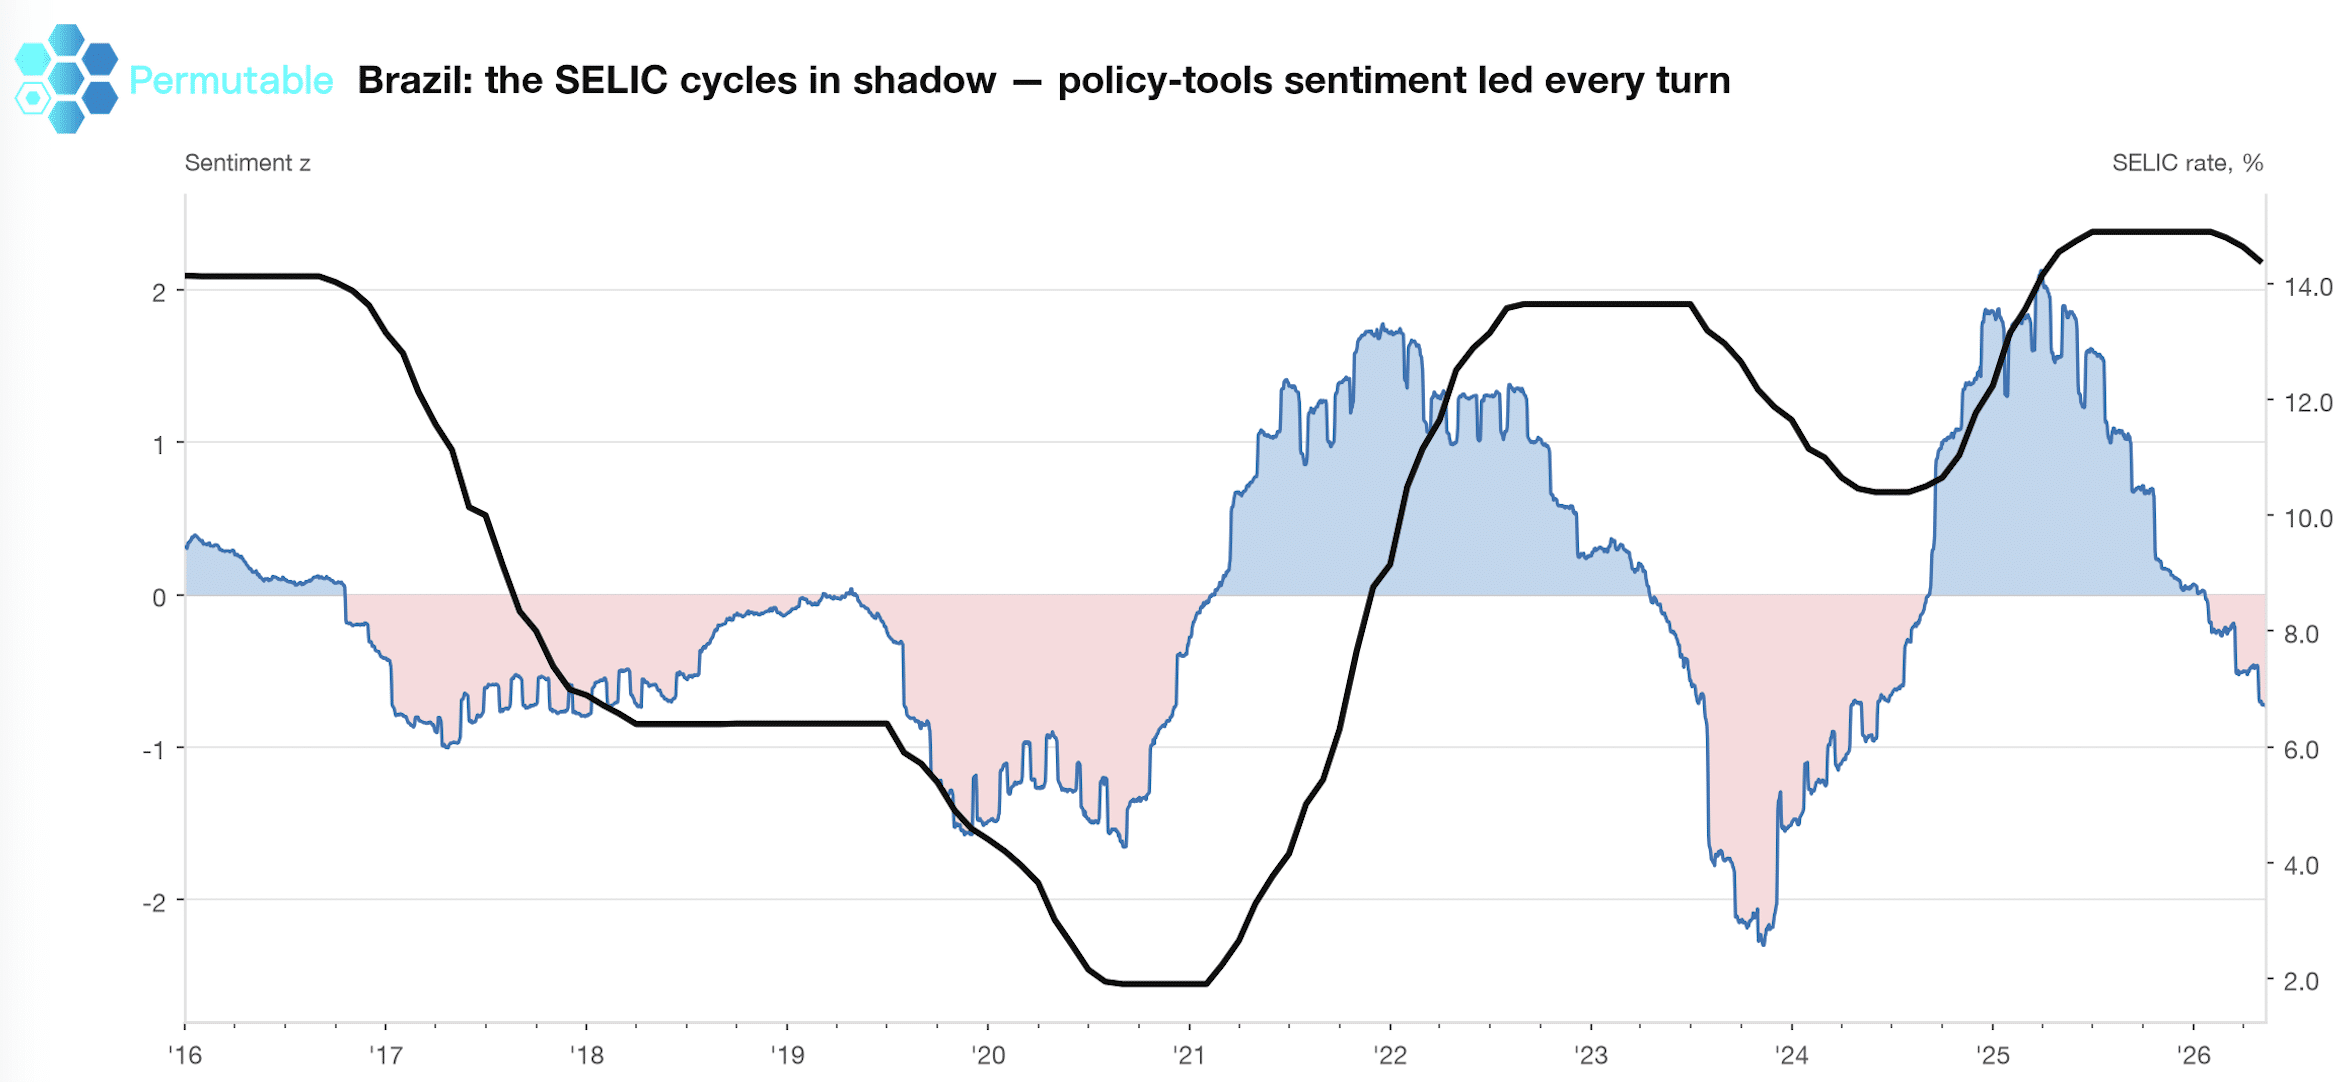
Chart showing Brazil policy sentiment and the Selic rate from 2016 to 2026 powered by Permutable's Global Macro Sentiment Indices, with sentiment leading major easing and hiking cycles in monetary policy.

Above: Brazil policy sentiment versus the Selic rate – Permutable’s Brazilian policy sentiment tracked the changing reaction function across successive easing and tightening cycles, providing an earlier read on the direction of policy than the Selic rate level alone.

How regime detection can inform portfolio research and risk management

Detecting a regime is only useful if you have predefined actions tied to the signal. Create regime-dependent playbooks so you respond consistently and avoid emotional decision-making.

Risk and position sizing rules

Teams may test whether different exposure levels, risk limits and factor tilts have historically behaved differently during low-volatility trending regimes. In a high-volatility mean-reverting regime, potential responses for internal testing may include lower exposure, increased liquidity buffers, adjusted risk parameters and different strategy or hedging allocations.

Factor and allocation adjustments

Teams may examine whether reducing concentrated risk-on exposures or changing factor allocations improves resilience under historically stressed conditions. The relative behaviour and cost of different hedging instruments can be evaluated under each regime, including futures- and options-based approaches

Integrating sentiment data into systematic research workflows

For systematic macro teams, GMSI signals can serve as a regime classifier, a cross-sectional ranking factor or a risk overlay. A rolling z-score of policy-outlook sentiment, for instance, can be tested against forward changes in front-end rates. Permutable’s API delivers the same raw schema across historical and live endpoints, so the feature you test on 11 years of history is the same feature you run in production.

Four institutional tests every regime signal should pass

Across different geographies, asset classes and macro drivers, four questions should govern your evaluation of any regime signal:

Direction: Has the signal moved decisively away from its previous range?

Breadth: Is the change visible across multiple drivers, sources and parts of the economy?

Persistence: Does it survive beyond one release, policy meeting or market shock?

Confirmation: Is the shift also becoming visible in market pricing, forecast revisions or hard data?

These four criteria, applied consistently to every signal, help separate genuine regime transitions from noise. They also create a shared vocabulary for your team, so research, trading and risk functions are aligned on what counts as a real change versus a temporary fluctuation.

How to build a point-in-time regime research process

Historical testing of regime signals must be conducted on a point-in-time basis. Revised economic series and retrospectively reconstructed narratives can make turning points appear far cleaner than they were to investors in real time.

Your research process should use only information that was available at each timestamp, with no lookahead bias. This discipline applies to every data input: official macro releases, market data and especially sentiment signals, where the risk of backfill is highest.

Permutable’s Global Macro Sentiment Indices preserve point-in-time history using frozen production models trained in 2020. Post-2020 events, including the pandemic, the inflation surge and the global tightening cycle, were processed as unseen regimes. This means your backtest evaluates how the signal actually behaved, not how it would have behaved with the benefit of hindsight.

Regime-detection methods such as Markov-switching or hidden Markov models can be layered on top of these sentiment inputs. The classification should rely on filtered regime probabilities calculated using only information available on each date, rather than smoothed probabilities estimated with later observations. The intelligence engine behind the indices supports this level of institutional rigour.

In conclusion: Building a regime-aware macro process

Detecting macro regime shifts is a discipline that combines indicator design, statistical methods and predefined execution rules. If you build a multi-indicator detection system and demand cross-confirmation and persistence, you reduce false alarms and make more robust adjustments to your strategy.

A possible research implementation might be to construct a monitoring dashboard with realised vol, implied vol, correlation and key macro sentiment series,  implement a change-point detector and a hidden Markov model or  build a two-regime sizing and hedging playbook with realistic costs.

The goal is to test your features on point-in-time history and run the same logic live, and then manage risk, adapt faster and maintain an information edge during the window between a narrative forming and official data catching up.

FAQ on early macro regime signals

What is a macro regime shift and why does it matter for investors?

A macro regime shift is a persistent change in the process generating inflation, growth, policy and asset-price behaviour. It matters because strategies and hedges optimised for one regime can fail in another. Permutable AI’s Global Macro Sentiment Indices help you identify when narrative conditions are changing ahead of official data.

How can real-time sentiment data detect regime shifts before official releases?

Real-time sentiment data tracks how inflation, policy and growth narratives develop across thousands of sources in local languages. Permutable structures this flow into hourly, point-in-time signals across 95+ economies, giving you an earlier read on macro transitions than monthly or quarterly government statistics can.

What statistical tools are most effective for market regime detection?

Hidden Markov Models, change-point detection algorithms like CUSUM and PELT, and GARCH-based volatility forecasting are all effective. The most robust approach combines multiple methods. Permutable’s 11+ years of point-in-time macro history can serve as an additional feature layer for these statistical models.

How do you avoid false positives in regime detection?

Require cross-confirmation from at least two independent signal types, apply persistence tests of three to seven sessions, and use macro-level filters to validate the shift. Avoid relying on any single indicator. Layered confirmation logic significantly reduces whipsaw risk.

What is the difference between domestic and international sentiment signals?

Domestic signals capture local-language reporting from inside an economy. International signals reflect external perception through global media and institutional commentary. Permutable AI separates the two views, and the gap between them can be one of the earliest indicators of a regime-level repricing in currencies, sovereign risk and rates.

How should institutional teams validate regime signals for live trading?

Define the target asset, horizon, feature construction and lag convention before testing. Use walk-forward validation, out-of-sample periods and realistic transaction costs. The processing logic applied to historical data must be identical to what runs live. Permutable’s consistent API schema across historical and live endpoints supports this discipline.

Important information

This material is provided by Permutable for information and research purposes and is written for professional and institutional audiences. It does not constitute investment advice, a personal recommendation, an offer or solicitation to buy or sell any financial instrument, or a recommendation to adopt any particular investment strategy.

References to indicators, thresholds, portfolio approaches, asset classes and historical market outcomes are illustrative only. They should not be relied upon as the basis for an investment decision. Historical relationships and past performance are not reliable indicators of future results.

Users should conduct their own research and assessment, including consideration of risk, liquidity, transaction costs and applicable mandate constraints. Permutable provides data and analytical tools; all investment, portfolio and risk-management decisions remain the responsibility of the user.
How does the 2026 energy shock reach 2027? From shipping routes to policy rates

Brent crude has slipped back below $100, but the broader energy shock is far from over. What began as logistics frictions in Gulf shipping lanes has evolved into a multi-stage macro contagion, cascading from refined fuel markets straight to the global yield curve.

While crude gains have moderated to 36% since 28 February, European diesel has surged by 98%, amplified by EU natural gas inventories well below their five-year seasonal lows. To absorb these lingering cost-push pressures and preempt second-round inflation, central banks are gearing policy towards restrictive territory. This stance has pushed US real interest rates to their highest level since 2008, accounting for 90% of the total rise in 10-year borrowing costs.

With investors demanding higher term premiums on debt extending into 2027, Permutable’s Global Macro sentiment indices map this multi-stage transmission channel step-by-step, surfacing structural policy shifts long before backward-looking economic releases capture the damage.

Stage 1: The shipping and energy shock channel

C1_shipping

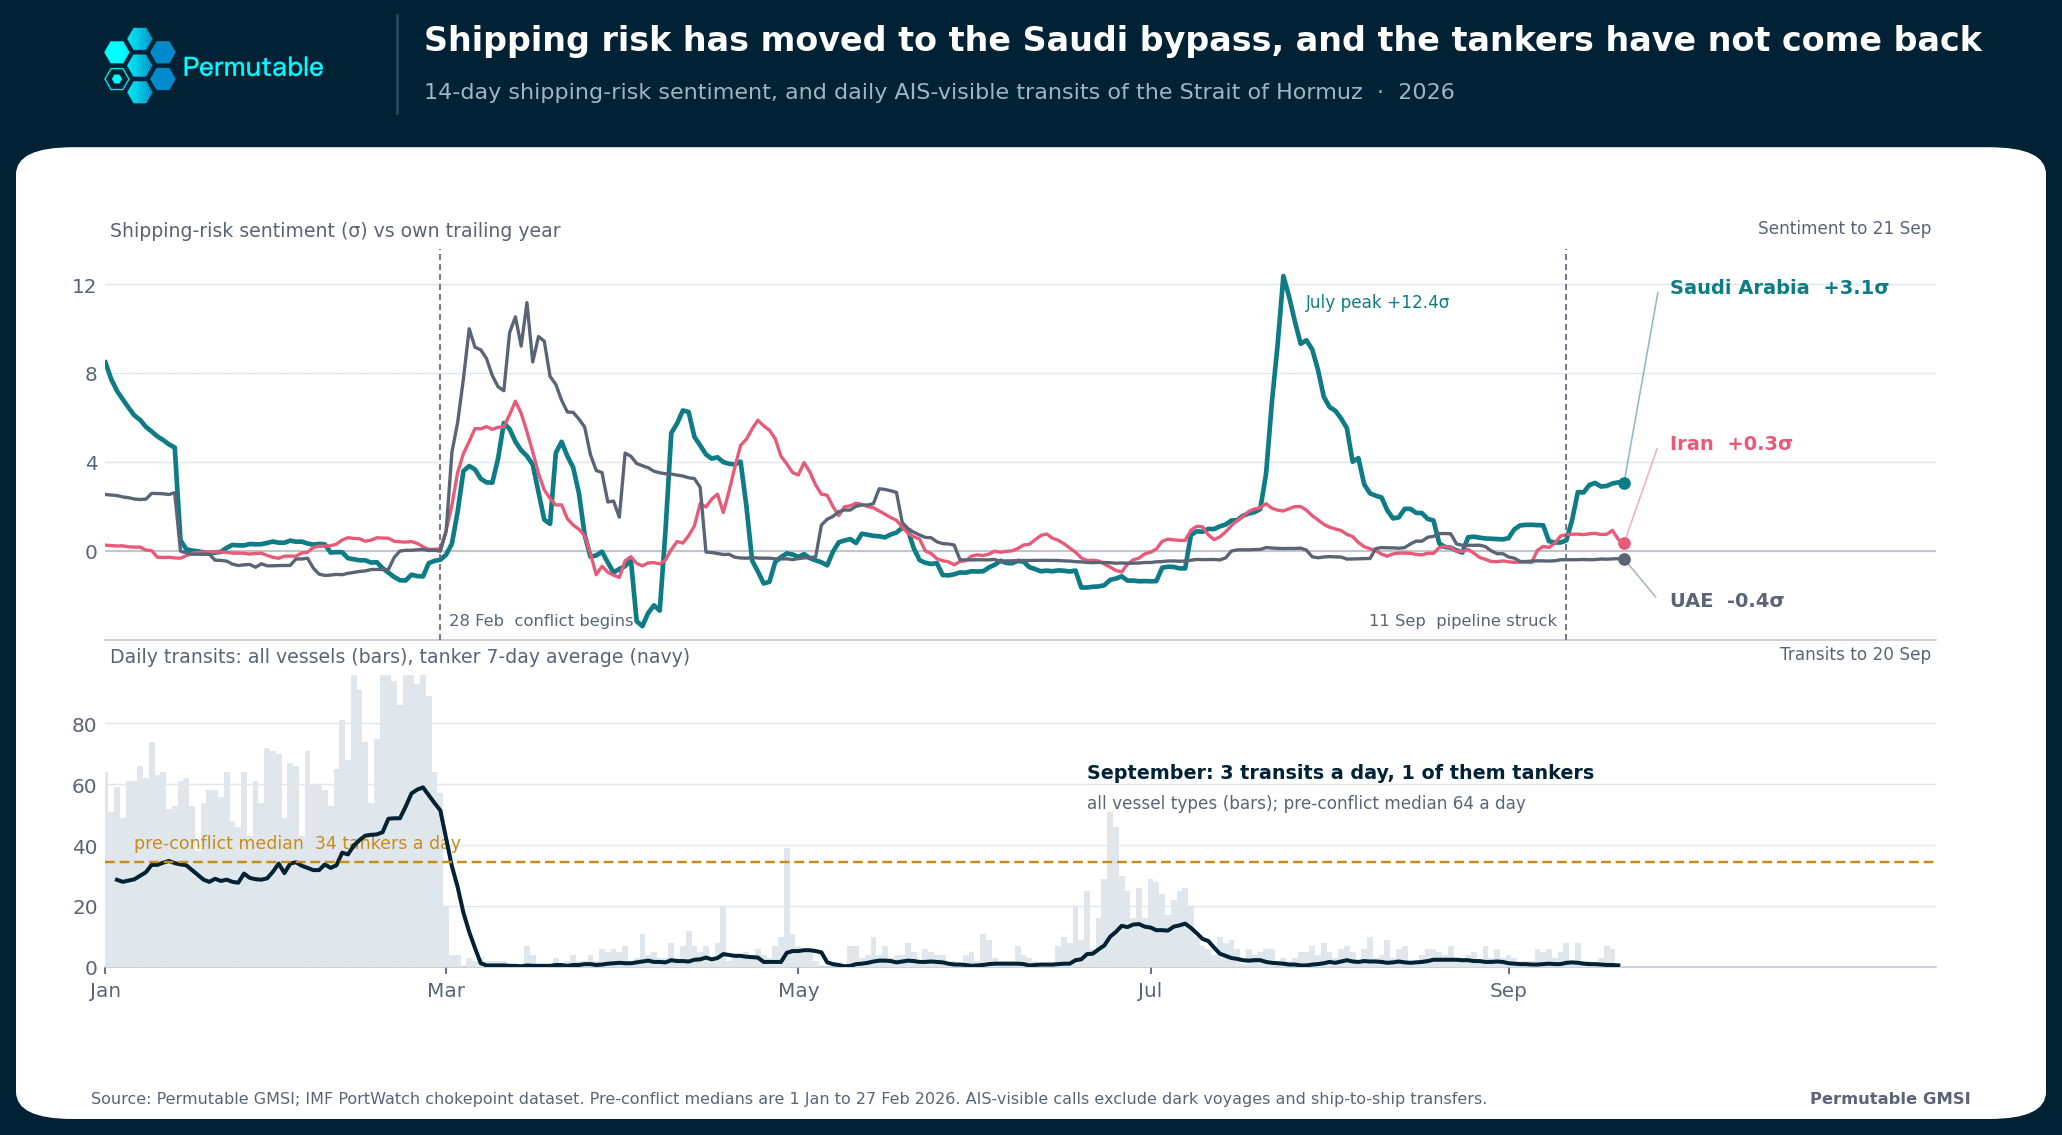
Permutable shipping-risk sentiment for Iran, Saudi Arabia and the UAE alongside daily transits of the Strait of Hormuz. Sentiment to 21 September, transits to 20 September.

Our shipping-risk index moved sideways rather than spiking, and that sideways drift was the true signal. While Iranian risk coverage subsided to 0.3 standard deviations above its trailing-year norm, Saudi Arabia climbed to 3.1. Attention had already pivoted west to bypass routes long before any physical disruption occurred.

Then the bottleneck snapped. On 11 September, drone strikes disabled the East-West pipeline, the vital 1,200 km line from Abqaiq to Yanbu designed to bypass Hormuz. With the line forced offline, Saudi Aramco alerted European refiners that October crude allocations would be cut to zero.

Meanwhile, the Strait of Hormuz remains effectively closed. Average daily transits have collapsed from 64 vessels (34 tankers) to just three per day, only one being a tanker. The barrels have not vanished, they have been redirected east onto longer, costlier Asian trade routes that European refineries cannot practically absorb.

Stage 2: From Crude to Cracks

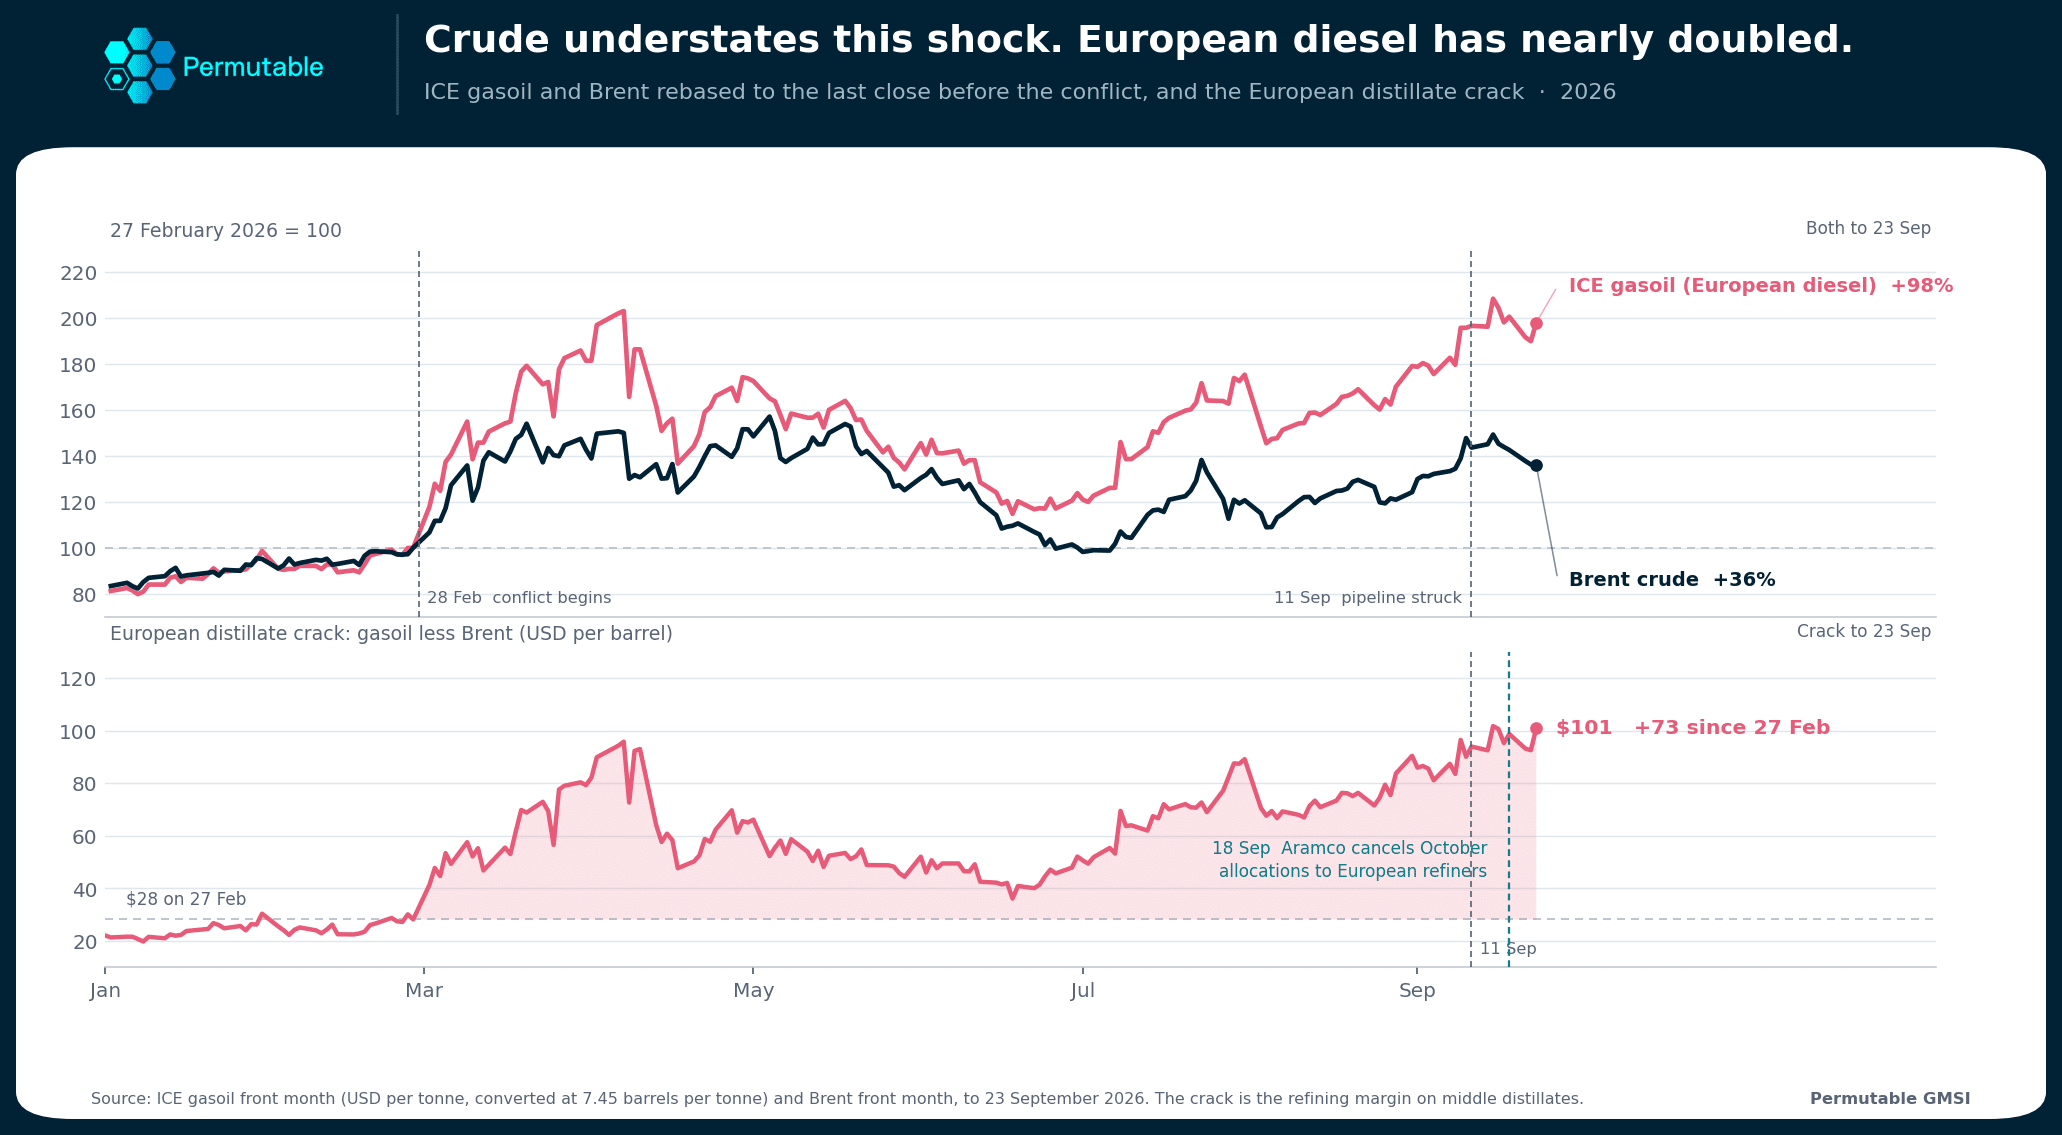
refined_products ICE gasoil and Brent rebased to the last close before the conflict, plus the European distillate crack at $101 a barrel. To 23 September.

ICE gasoil, Europe’s diesel benchmark, has gone from $753 a tonne to $1,490. The refining margin over Brent, the distillate crack, has widened from $28 to $101 a barrel. That spread is the part of the energy shock the crude price hides.

Diesel is an industrial input that moves freight fleets, agricultural yields, and construction equipment rather than consumer retail baskets. With European diesel up 98% against a 36% rise in crude, the cost burden reaching European enterprise is approximately double what crude benchmarks indicate. This transmission mechanism converts an upstream energy shock into downstream goods-price inflation, manifesting across supply chains through freight surcharges, transport tariffs, and quoted delivery lead times.

Stage 3: Energy inflation is loud, the rest of the basket is quiet
sentiment energy_inflation

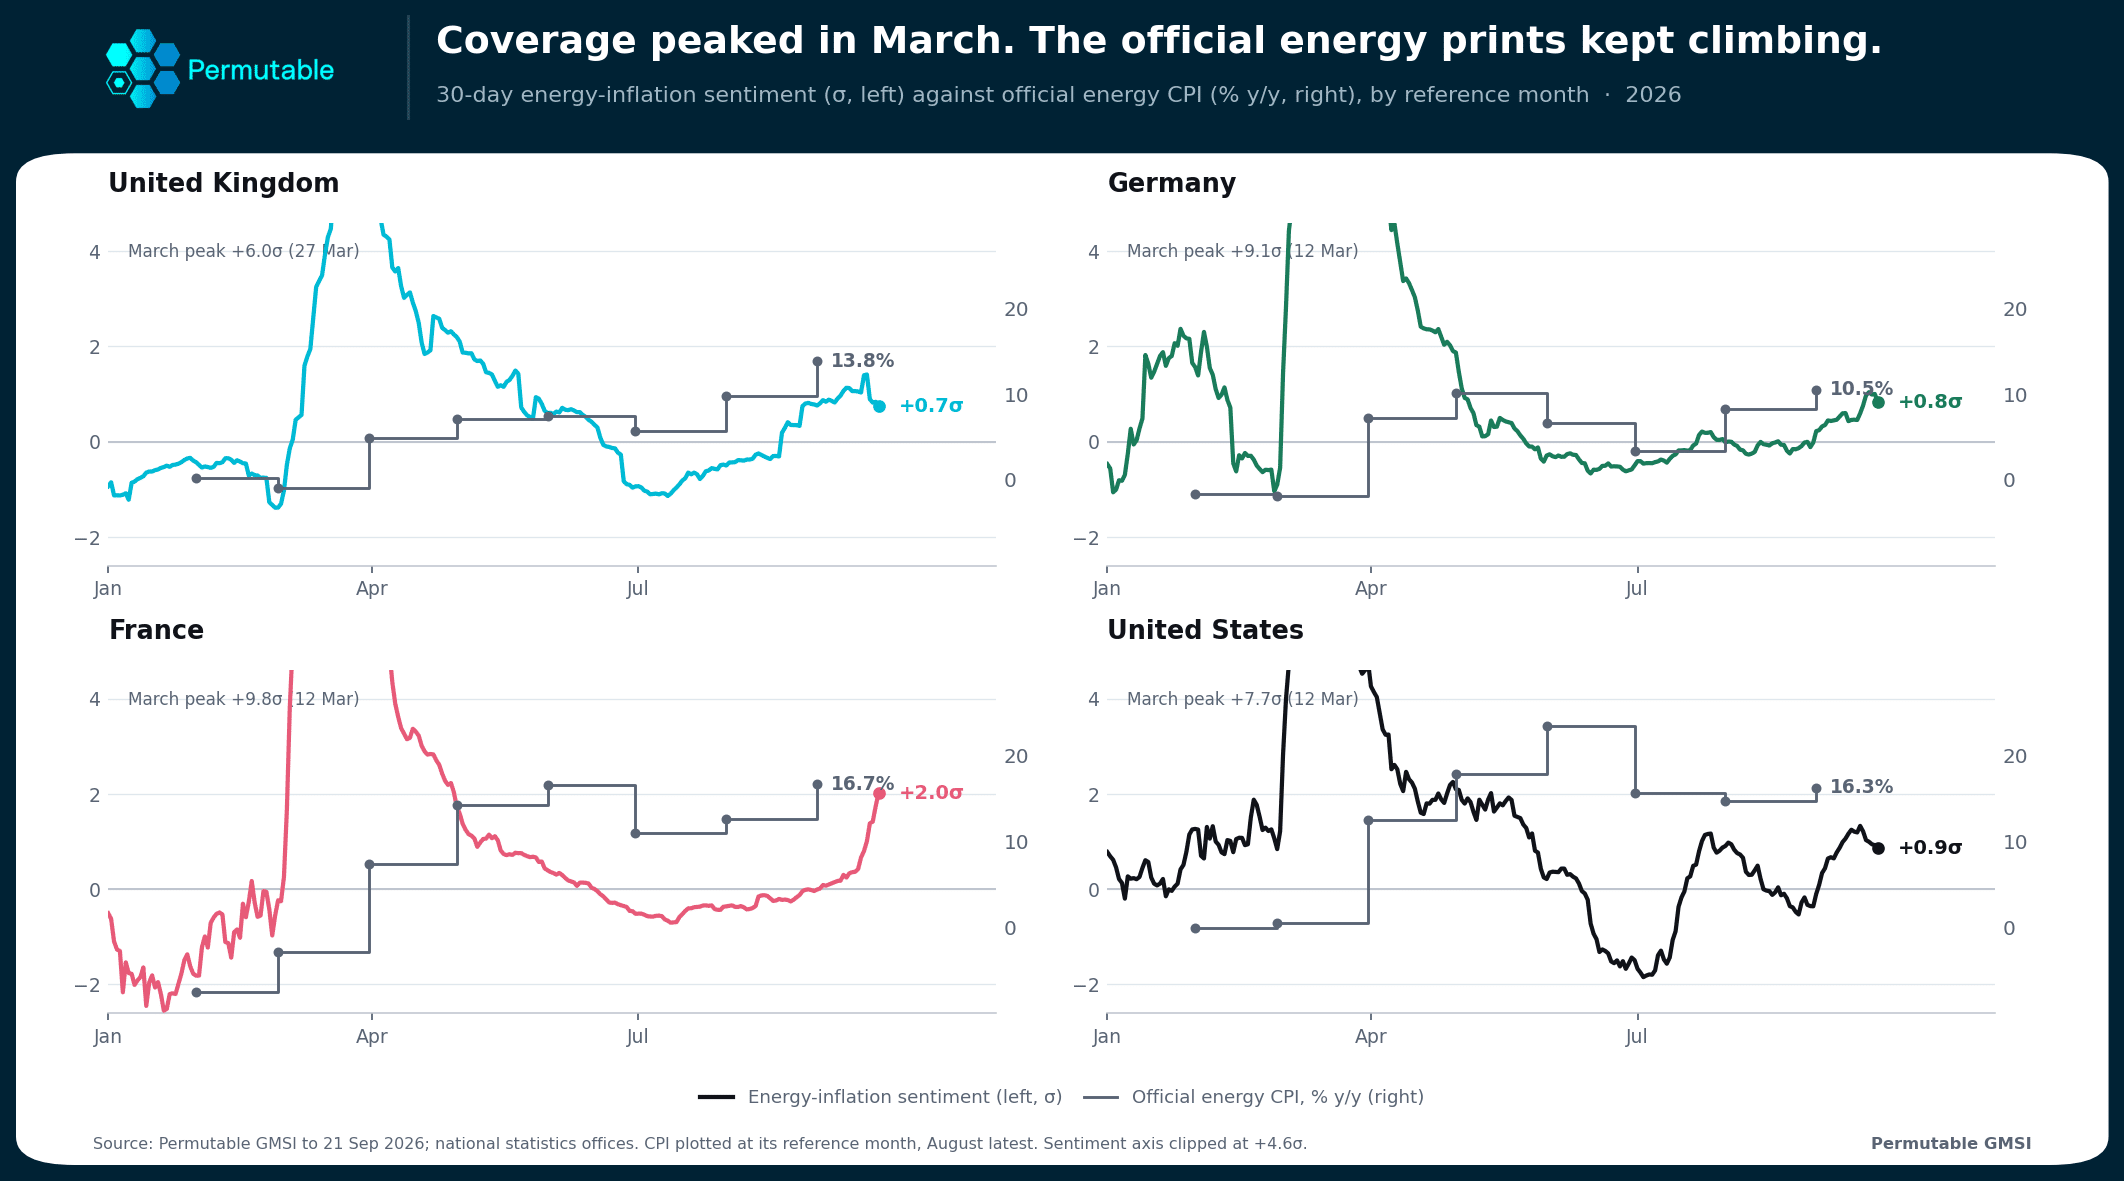
Permutable energy-inflation sentiment plotted against official energy CPI for the UK, US, Germany and France. Sentiment to 21 September, CPI to the August reference month.

So far the cost has stayed roughly where it landed. Energy inflation ran at 13.8% in the UK and 16.7% in France in August. UK services inflation held resilent at 3.4%, euro-area inflation excluding energy and food at 2.1%. 

Our energy-inflation coverage peaked in March, faded through the spring, and turned higher again in July as natural gas climbed. While six months of elevated energy input costs have hit business operations, broader domestic inflation layers, food, manufactured goods, services, and wages, have not fully caught up. Soft private-sector wage growth and a loosening labor market continue to suppress consumer demand, but cost pressures are mounting. Upstream fertilizer price spikes are already nudging food prices higher, while structural demand for AI infrastructure, from semiconductors to raw industrial metals, is adding a layer of supply-chain friction.

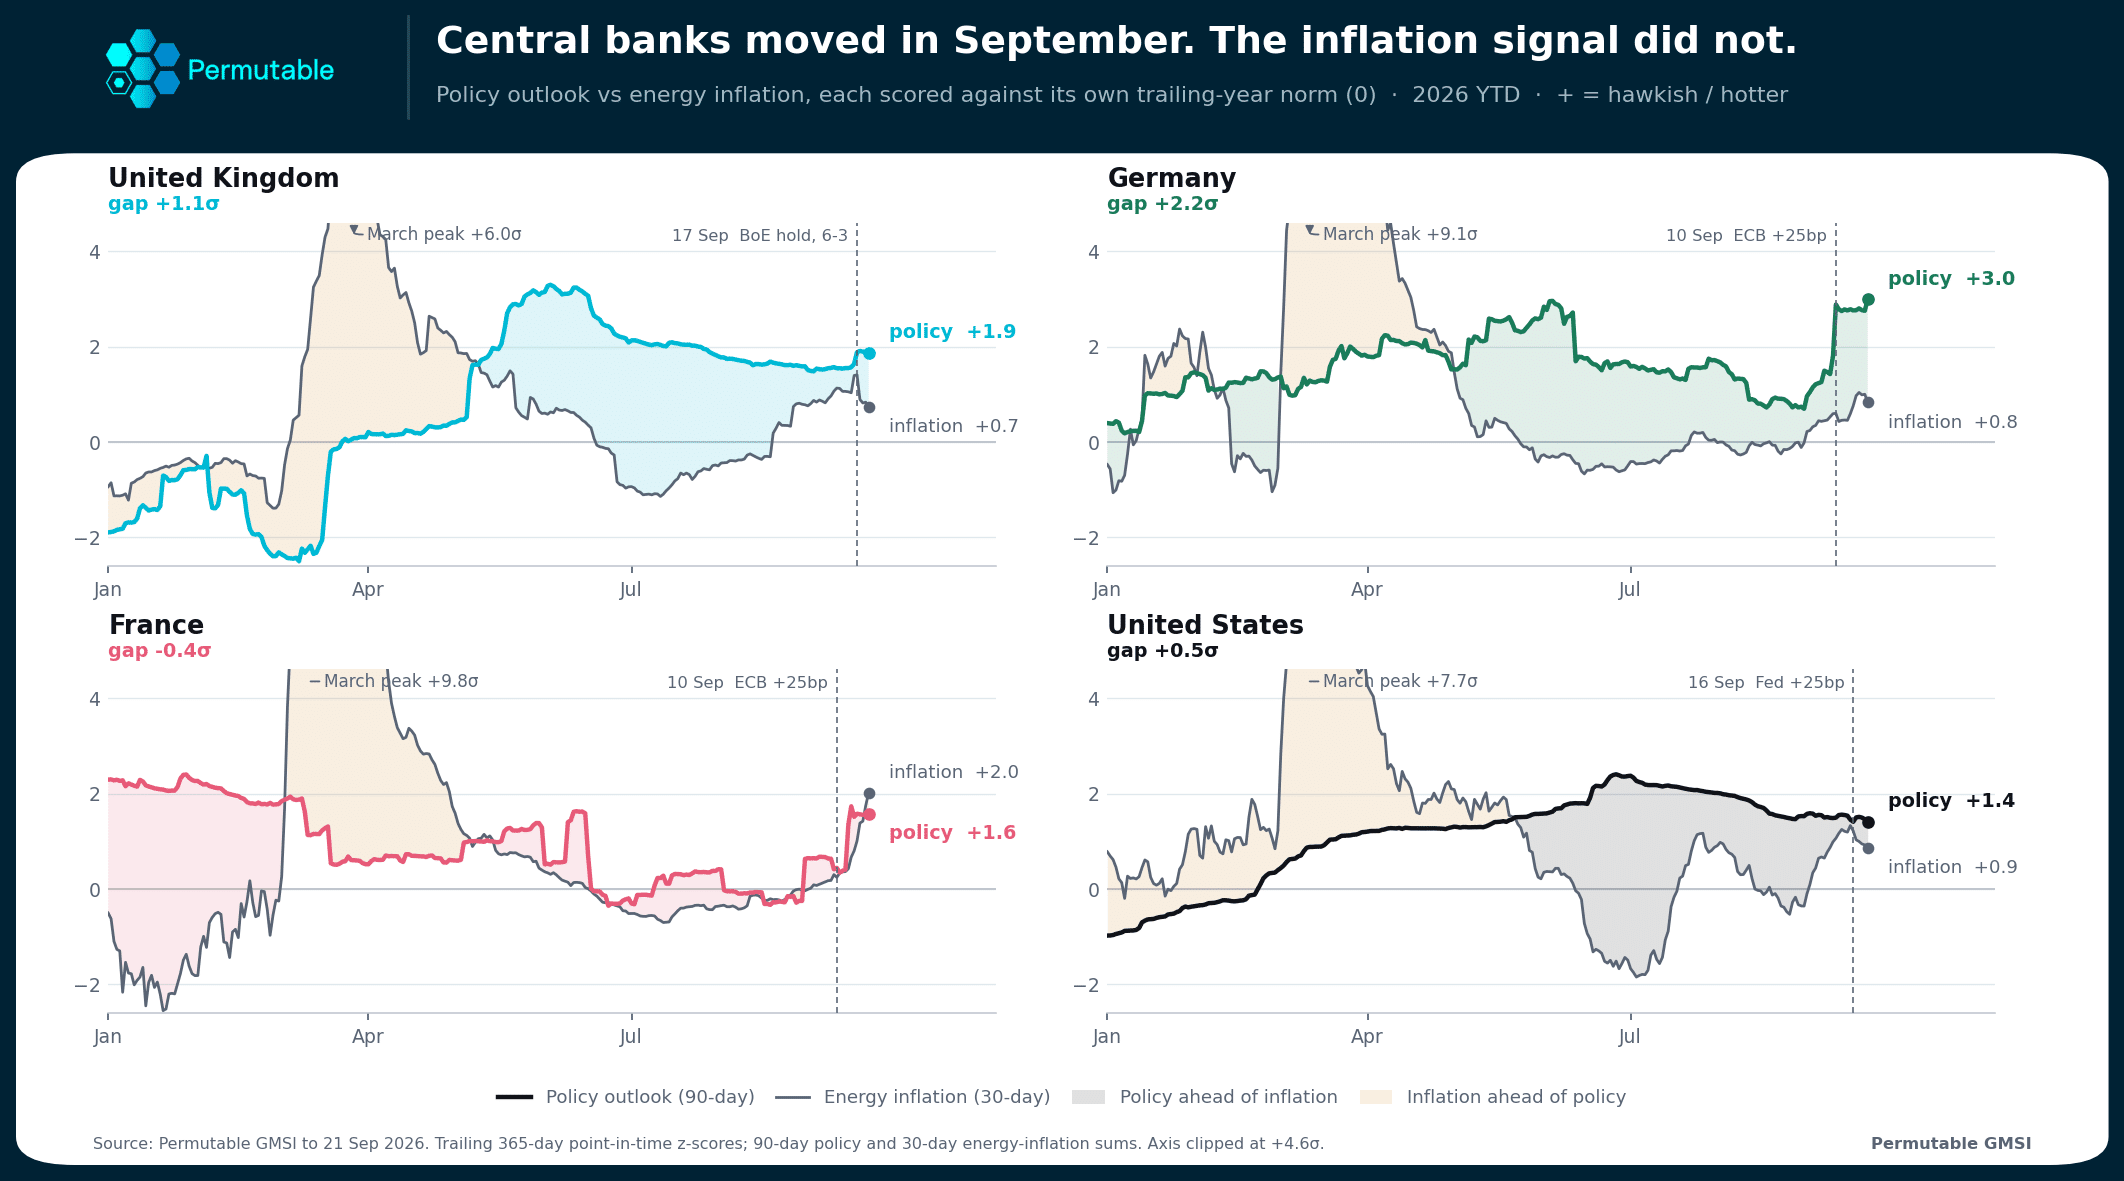
Policymakers know the tipping point is near; once businesses stop swallowing margin compression and pass cumulative input costs downstream, a localized energy spike becomes a systemic inflation shock. With energy-inflation sentiment sitting between 0.7 and 0.9 standard deviations above norm across the UK, US, and Germany, policy-outlook coverage in those same markets reads far higher: 1.9, 1.4, and 3.0, respectively. In three of these four major economies, the policy tightening case now outpaces the inflation data that sparked it. Central banks are not following current statistics, they are moving in front of them.

policy_vs_inflation_gap

Stage 4: Central banks are pricing the risk, not just the print

The ECB went to 2.50% on 10 September and the Federal Reserve to 3.75-4.00% on the 16th. The Bank of England held at 3.75%, with three of nine members voting to raise, and set out its reasoning with unusual candour: little evidence of second-round effects so far, a rising risk if energy prices persist, and inflation peaking above 4% in early 2027, precisely when the main wage round is settled.

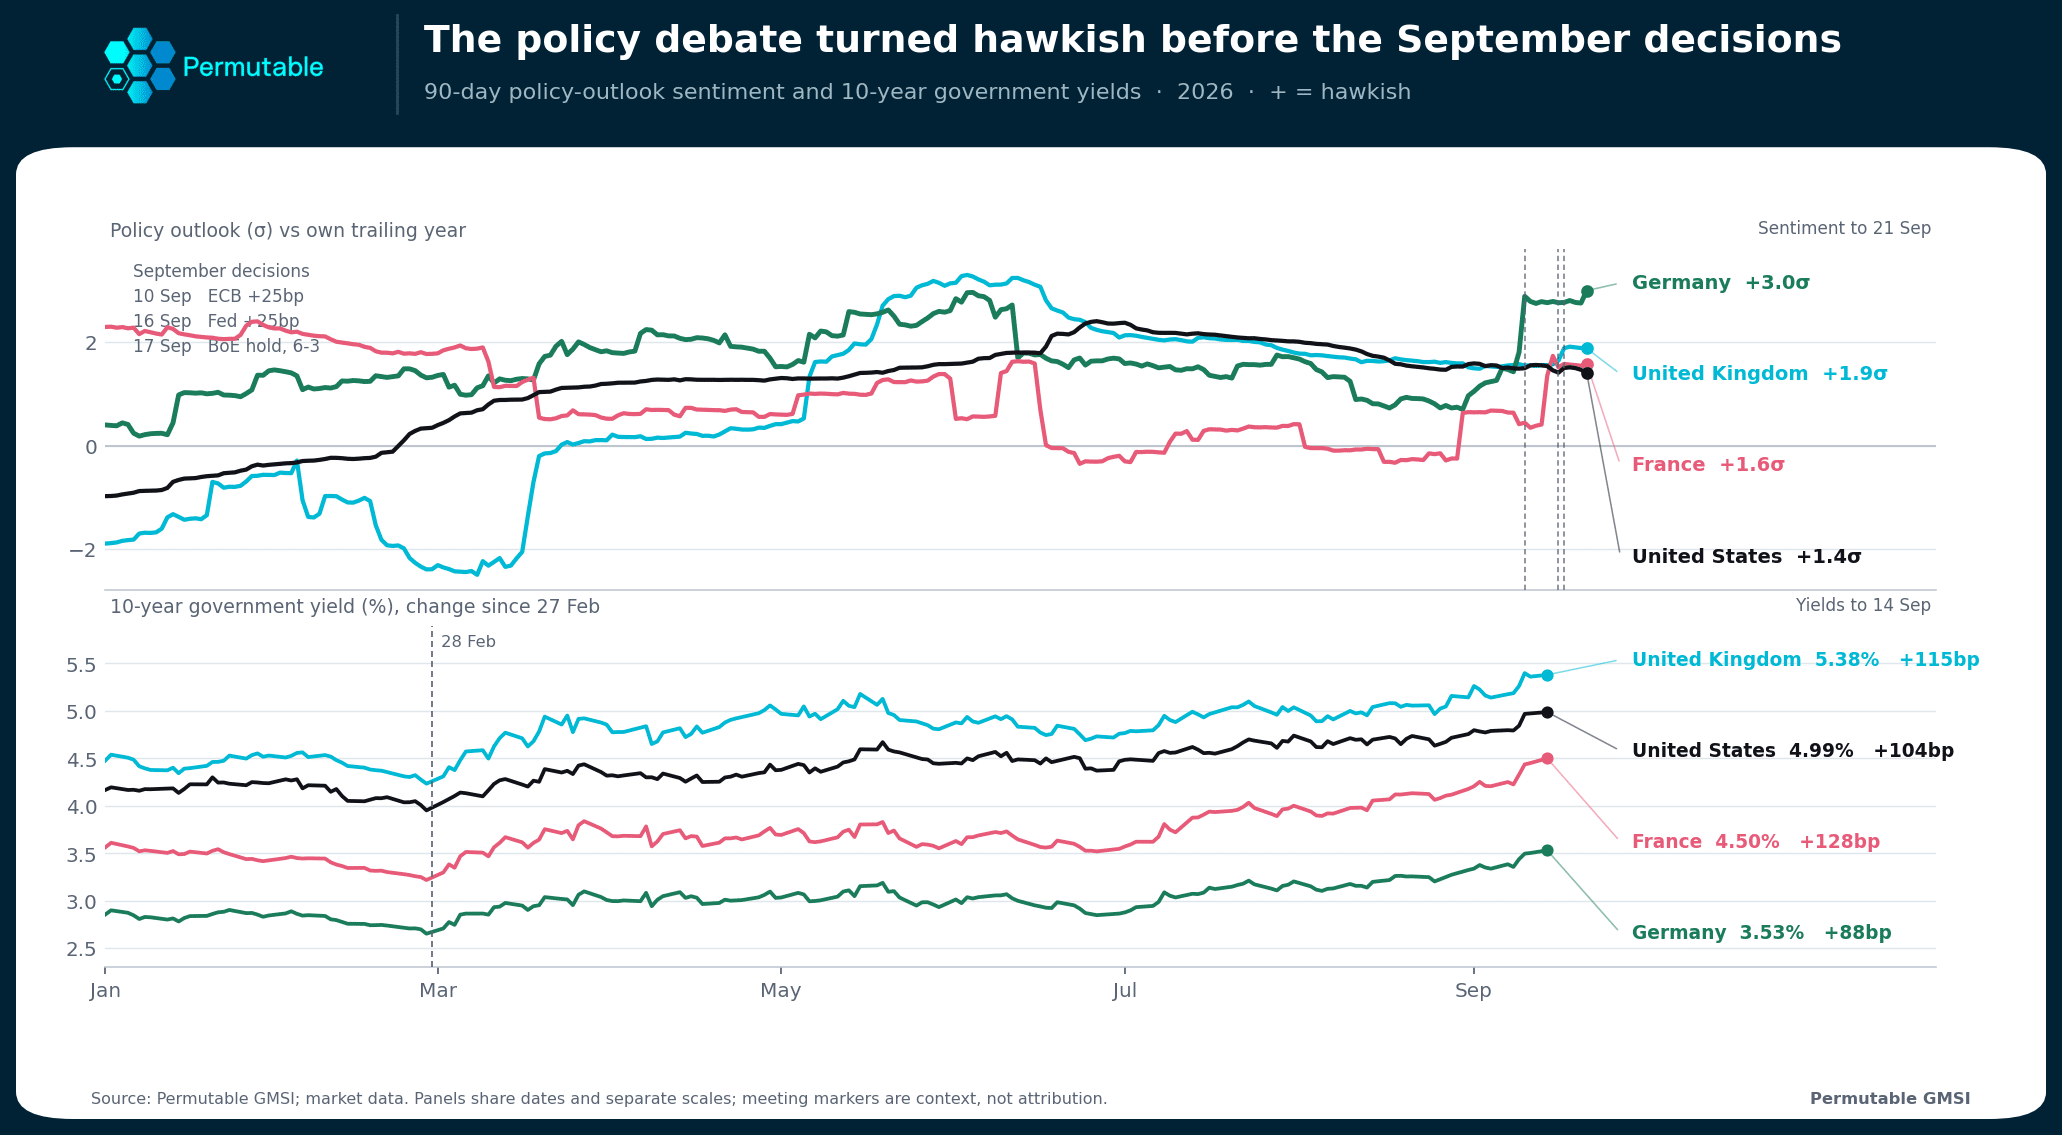
That is pre-emption, not reaction. Our policy-outlook index measures how firmly the tightening case is held rather than how loudly it is stated. It reads 3.0 standard deviations above norm in Germany, 1.9 in the UK and 1.4 in the US. All three sit well clear of the inflation coverage that set the argument off.

Stage 5: The bond market has paid in real yields

US real_vs_breakeven
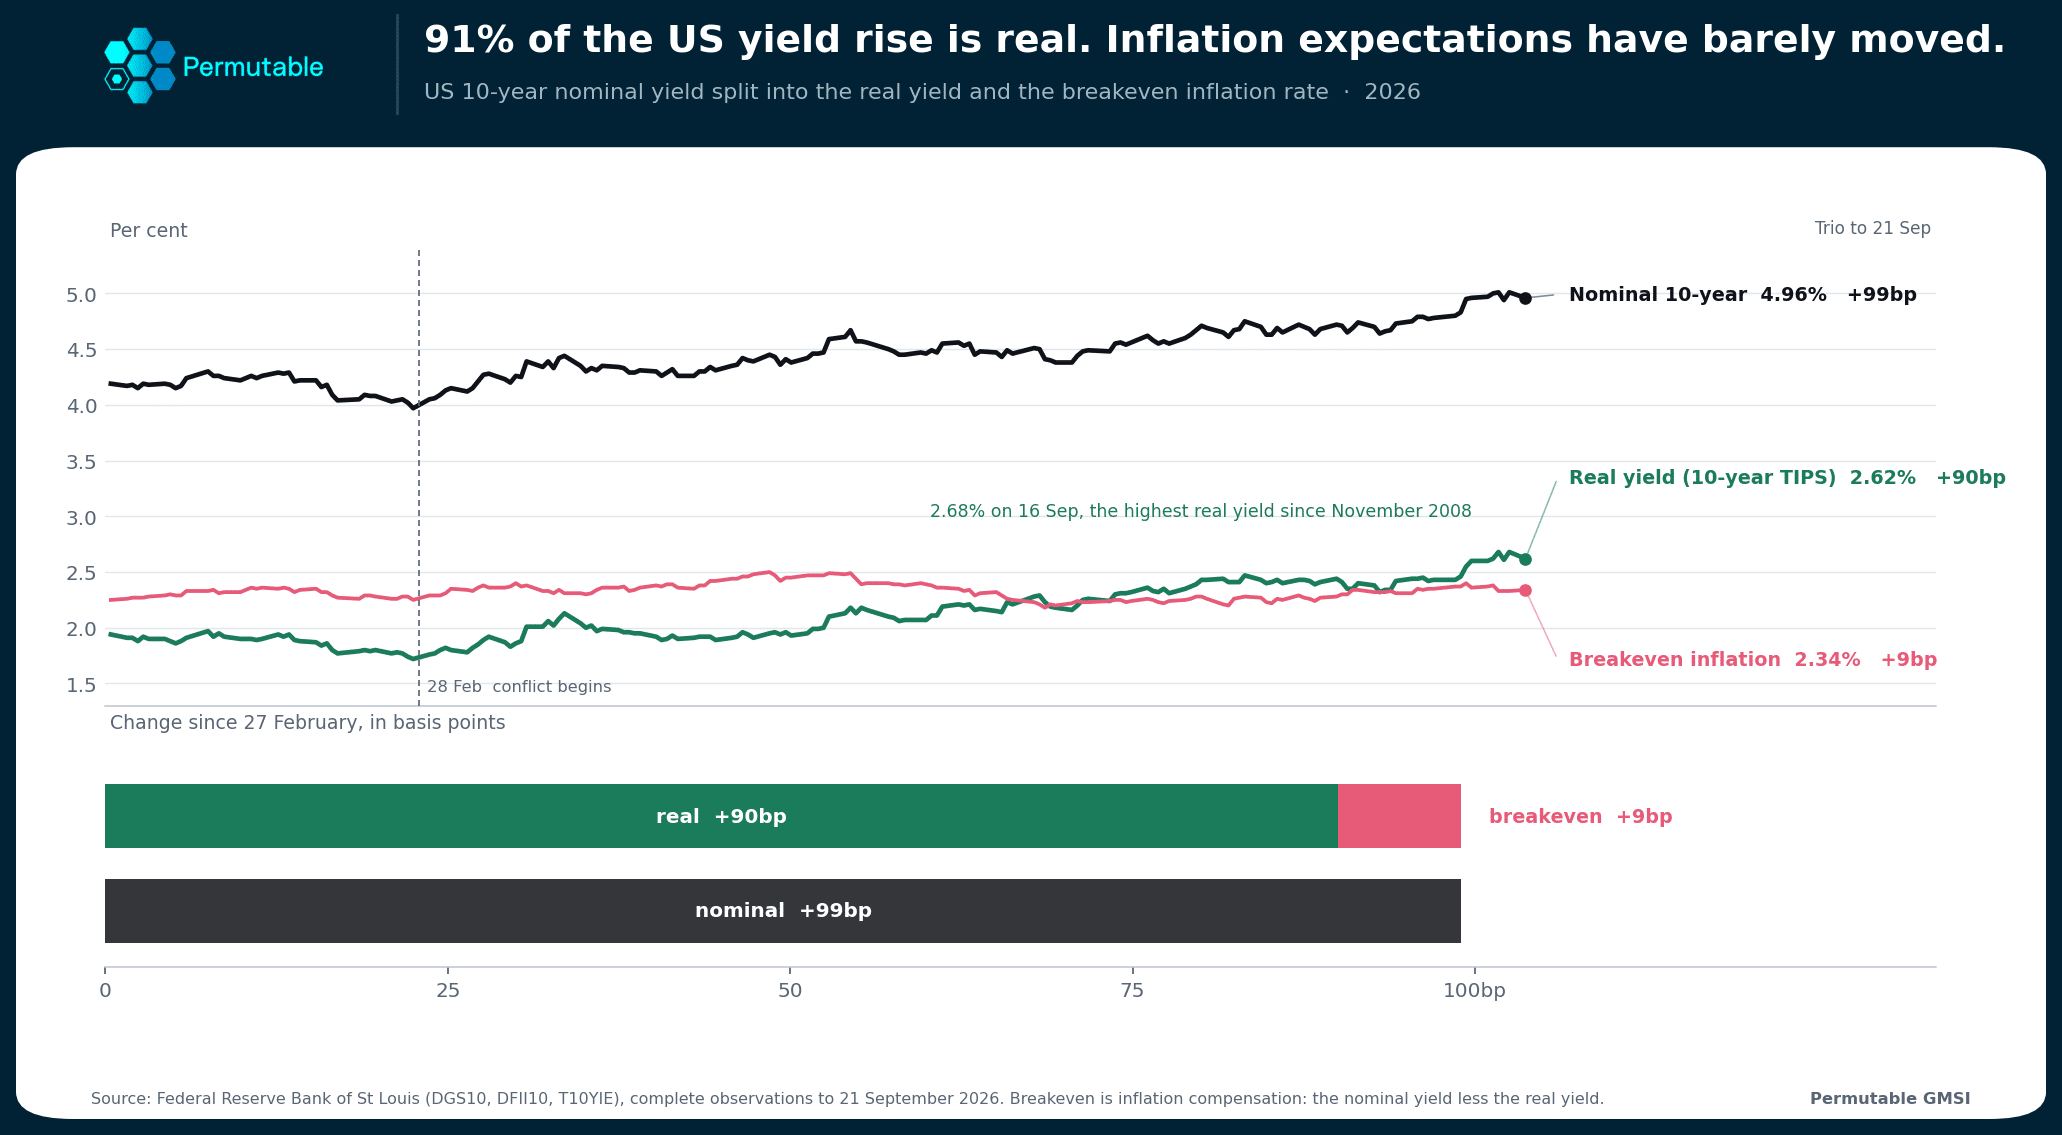
Between 27 February and 21 September the US 10-year yield rose 99bp to 4.96%. Ninety of those basis points came through the real yield, which touched 2.68%, its highest since November 2008. Inflation compensation supplied just 9bp.

That split is worth reading slowly, because it inverts the intuitive story. Investors are not buying protection against inflation. They are demanding a higher real return simply to part with their money, and demanding more of it the further out the loan runs. French 10-year yields are up 129bp since February, gilts 99bp, Bunds 81bp.

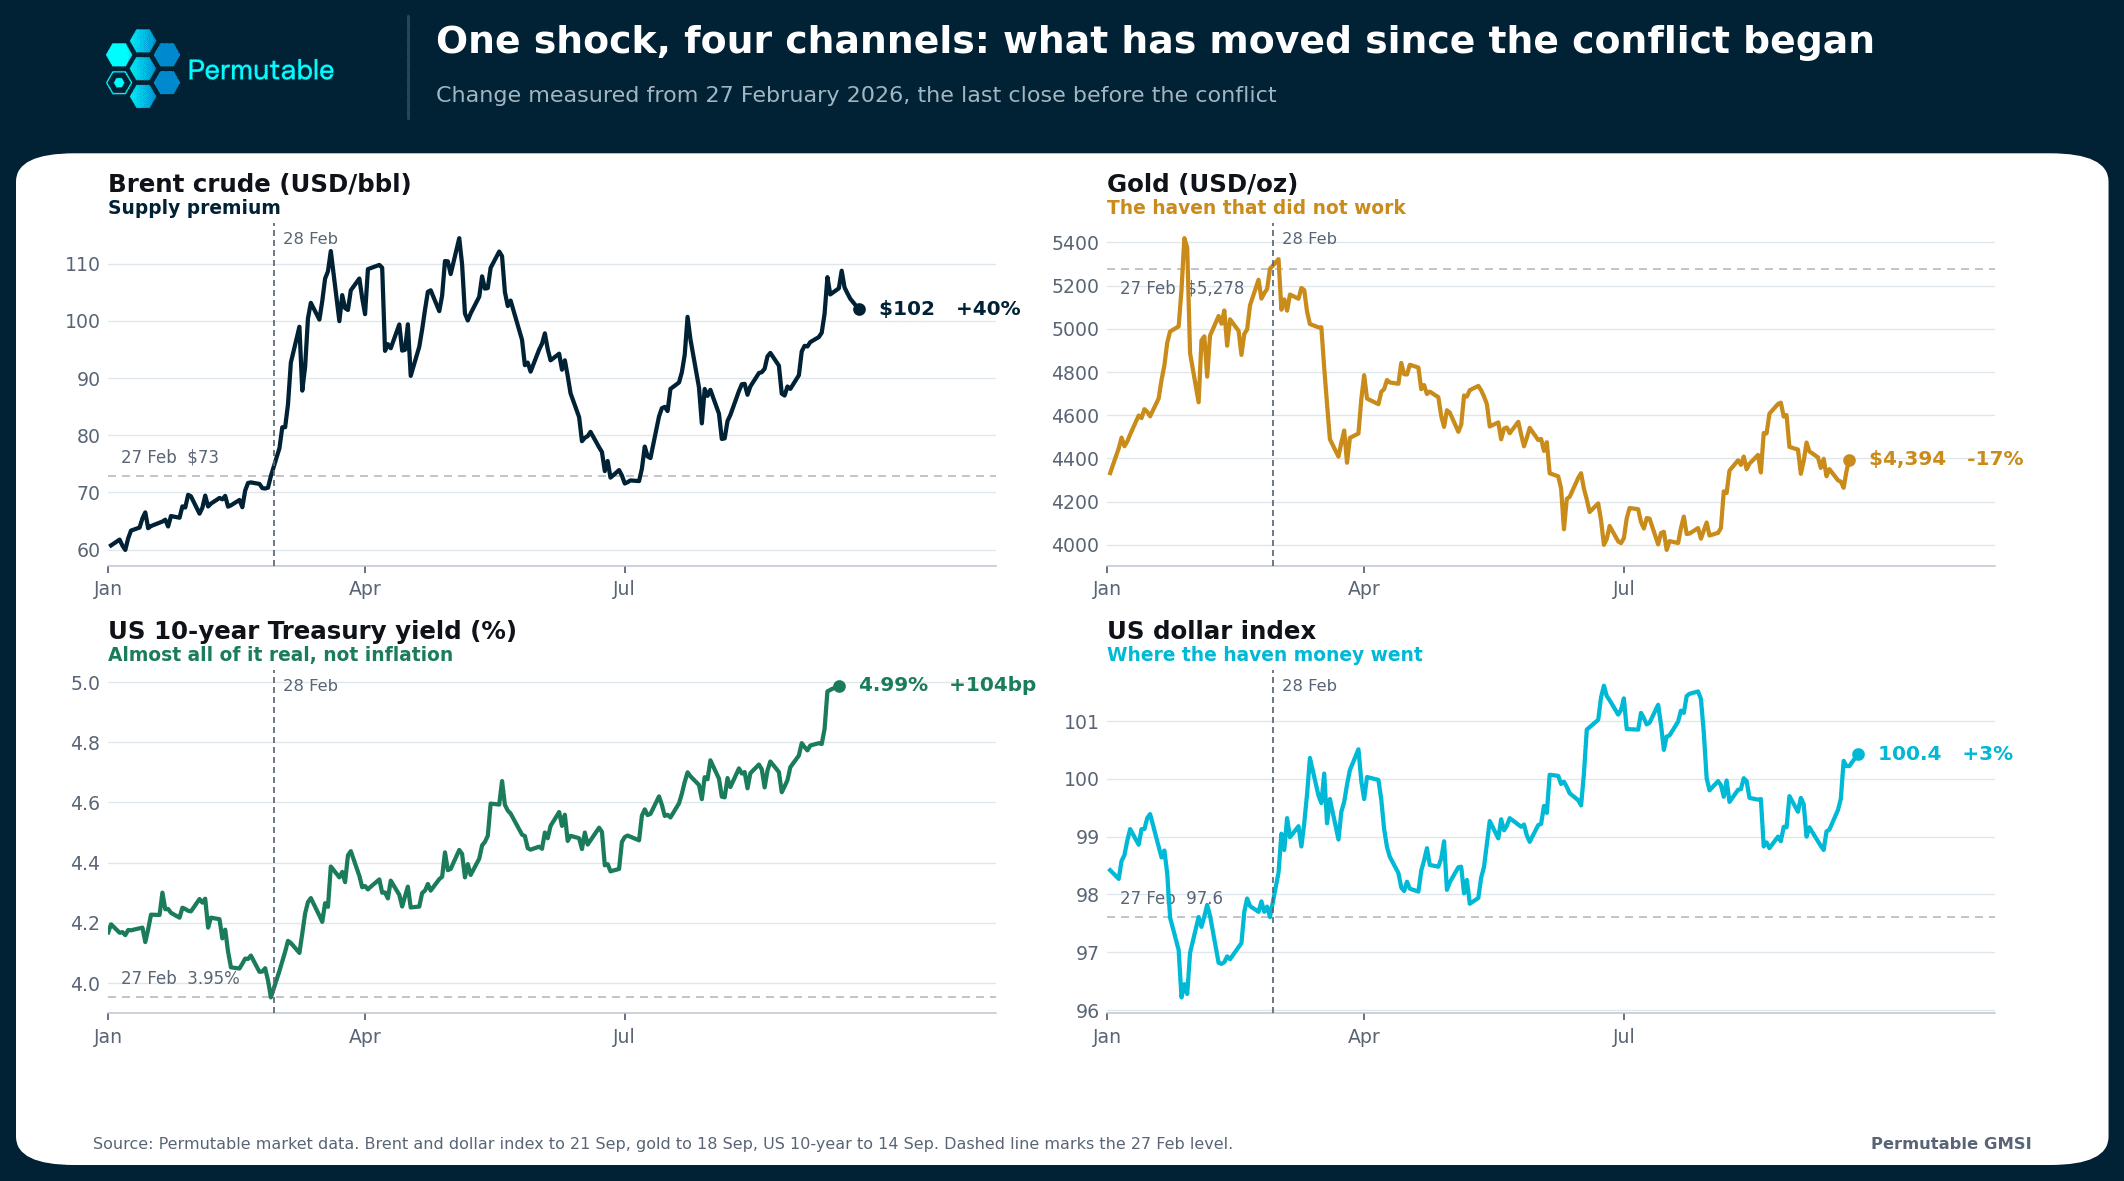
The repricing has sorted the traditional hedges too, and not in the order most would expect during a period of heightened geo-political tension. Gold, is 17% below where it started before the conflict. The dollar is up 3.3%. And the S&P 500 is up 12.9%, an equity market treating this as a rates event rather than a growth one as the tech and energy industry gathers pace.

cross_asset

How the energy shock reaches 2027

The next stage is governed by a calendar rather than a chart.

  1. 28 October 2026. The UK’s Labour government under Andy Burnham delivers its first Budget, with the OBR forecast alongside it, into gilt yields already 99bp above February.
  2. 3 November 2026. The US midterm elections.
  3. Q1 2027. The Bank of England’s adverse energy scenario, which it now treats as a fair description of a conflict that simply continues, puts inflation above 4% during the annual pay round.

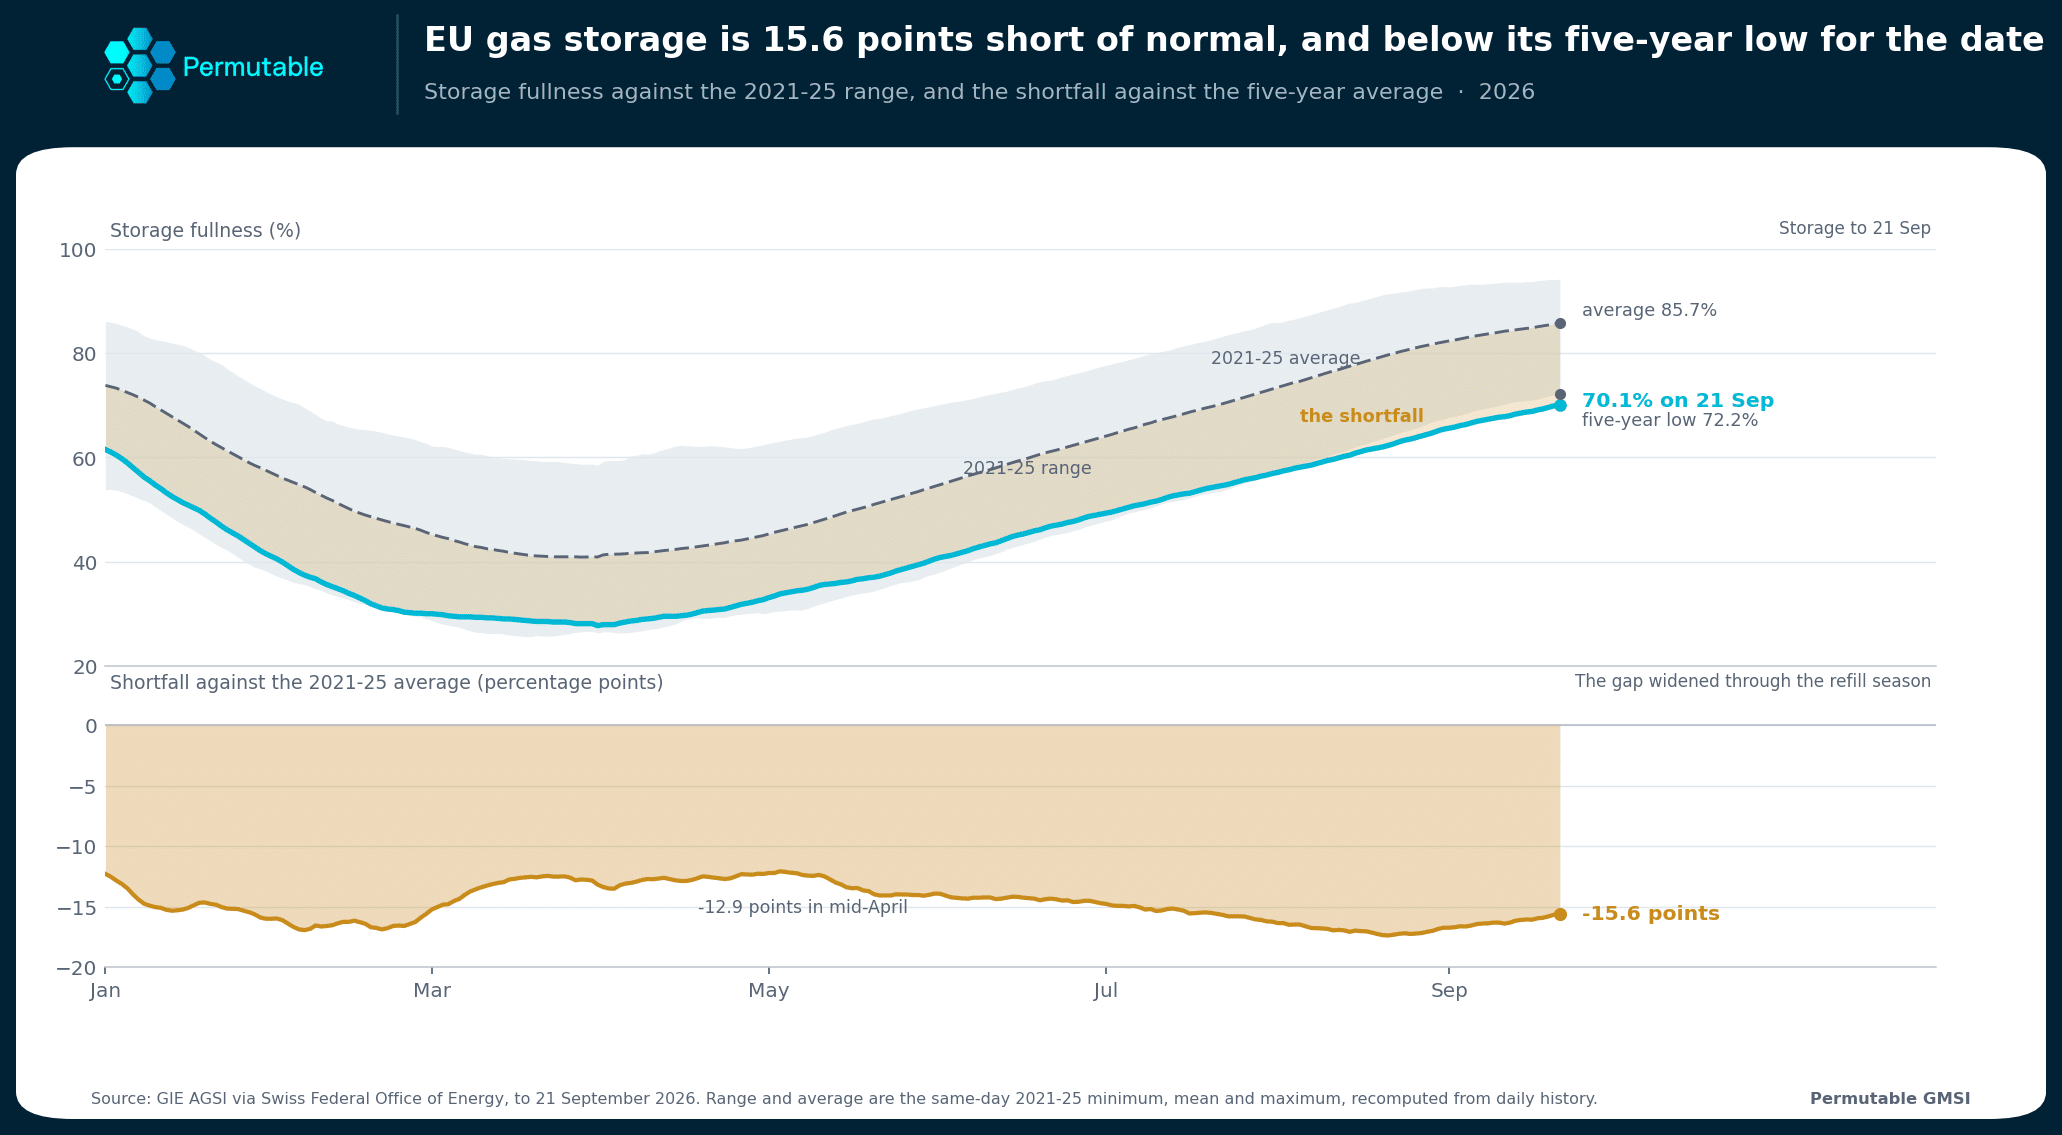
In addition, Europe meets the coming winter 15.6pp short of its five-year average gas storage, and below the five-year low for the date. The shortfall widened through the refill season instead of closing: 12.9pp in April against 15.6pp now. A cold drawdown books an expensive refill, and that bill lands in 2027 as well.EU_5yr_storage

What would change the picture

Four signals would tell you the chain is breaking rather than lengthening.

  • Hormuz traffic. A recovery in daily transits sustained across consecutive weeks, with European allocations restored for November.
  • The distillate crack. A sustained narrowing from $101 a barrel.
  • The storage gap. A deficit that closes rather than widens through the withdrawal season.
  • Sentiment beyond energy. Food, services and wage coverage turning up alongside energy in our indices. That is the shape a second-round effect makes before it reaches official CPI.

Every phase of this shock operates on a different timeframe, from real-time shipping logs to quarterly CPI releases. By mapping them simultaneously, sentiment data reveals structural macro shifts months before they reach official statistics.

See the shock before the data does. Permutable’s Global Macro Sentiment Indices score directional sentiment across 95+ economies and 70+ topics against each market’s own trailing year, point-in-time, with 11 years of history.

China Sentiment Outlook Q4 2026: exports carry the load as consumers hold back and chip risk lingers

China’s sentiment outlook is showing two distinct speeds. While factories and exporters are operating at full capacity, households and domestic businesses are approaching with caution.

Recent data highlights this disparity. In August, industrial output rose 5.2 per cent year on year, a slight improvement from July and slightly above forecasts. Conversely, retail sales rose only 0.4 per cent. Additionally, fixed-asset investment fell by 7.2 per cent in the first eight months of the year, marking its steepest decline since April 2020, with property investment down nearly one-fifth. It is not all grey. Investment in high-tech industries is still growing, and home prices in some of the biggest cities have begun, tentatively, to steady. August was also a miserable month for weather, with four typhoons battering the east coast.

Prices tell a similar tale. Factory-gate prices, which fell for more than three years, have been rising since March and stood 3.8 per cent higher in August than a year before. Consumer prices rose 0.8 per cent. Deflation is over. But the warmth has come mostly from higher energy and commodity prices, not from Chinese shoppers loosening their purse strings.

None of this will have surprised anyone watching the news flow rather than waiting for the monthly releases.

Reading it live

Official statistics are inherently delayed. The activity figures for August were released in mid-September, capturing a month that had already passed. By the time trends emerge in the data, markets have typically been debating them for weeks.

Permutable’s Global Macro Sentiment Indices are built to close that gap. They read coverage of each corner of the economy, in real time, with each reading using only what was known on that date: nothing is rewritten with hindsight, and nothing from the future leaks back in. This approach offers a sense of early insights into the economic outlook.

The readings are simple to follow. For investment and exports, a positive score means coverage is describing stronger activity. For inflation, it means rising price pressure, welcome or not. Supply chains run the other way: a positive score means greater disruption risk, so a fall in sentiment is good news.

Read that way, this year’s signals tell a story the official data has only lately caught up with.

Investment: The warning light
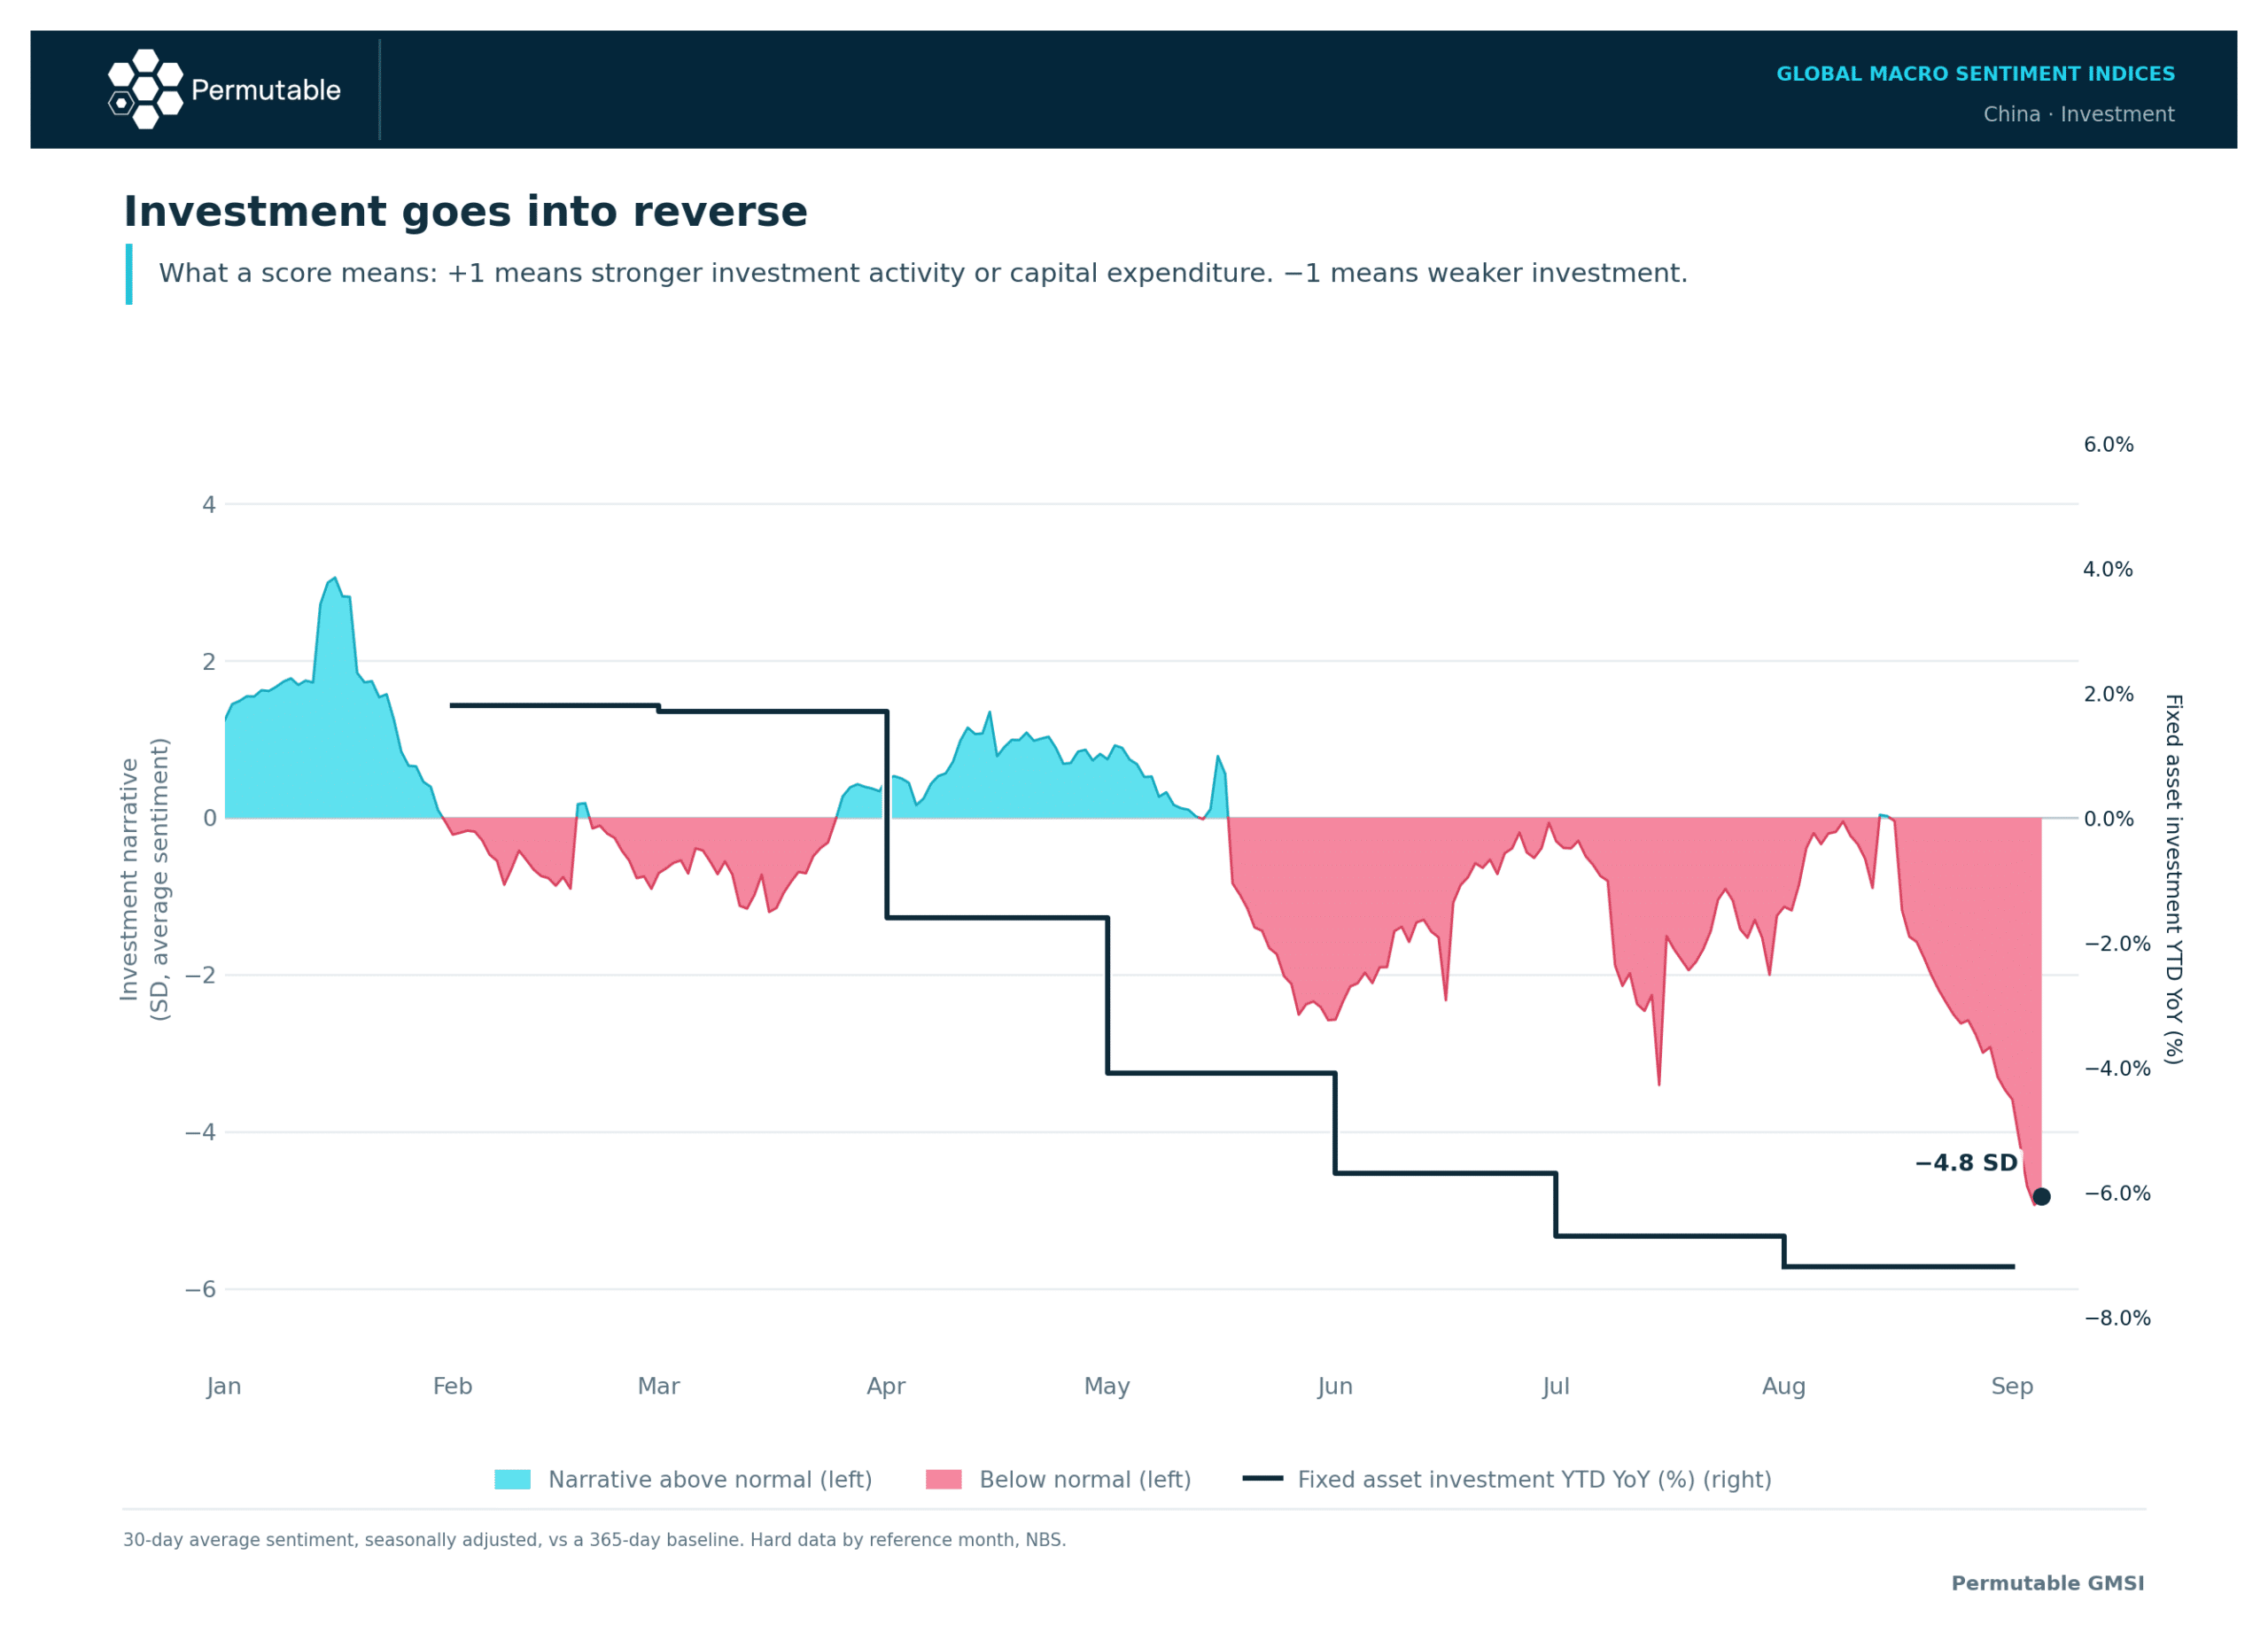
China investment Sentiment

Investment sentiment was positive in the opening weeks of the year and again through April. In mid-May it dropped below its norm and has stayed there, with one brief exception, ever since. The year-to-date decline in fixed investment has deepened at every release since.

By early September the signal had reached its lowest point of the year. The series is ordinarily placid, which flatters the size of that final lurch; the direction is the thing, and it has pointed down all summer.

The lenders tell the same story. New loans returned to positive territory in August after July’s contraction, but at ¥60bn they came in below expectations of the ¥400bn analysts expected and a tenth of the ¥590bn extended a year earlier. Some of this is deliberate, as Beijing steers credit away from property and local government, as well as seasonal effects. Much of it is simply that firms and families see little worth borrowing for.

Policy has been watchful rather than bold. Benchmark lending rates have not moved for 15 months. Instead, the government has accelerated bond issuance and widened interest subsidies for smaller firms and consumers. That can direct credit. Whether it can create an appetite for it is another matter.

Exports: The economic engine

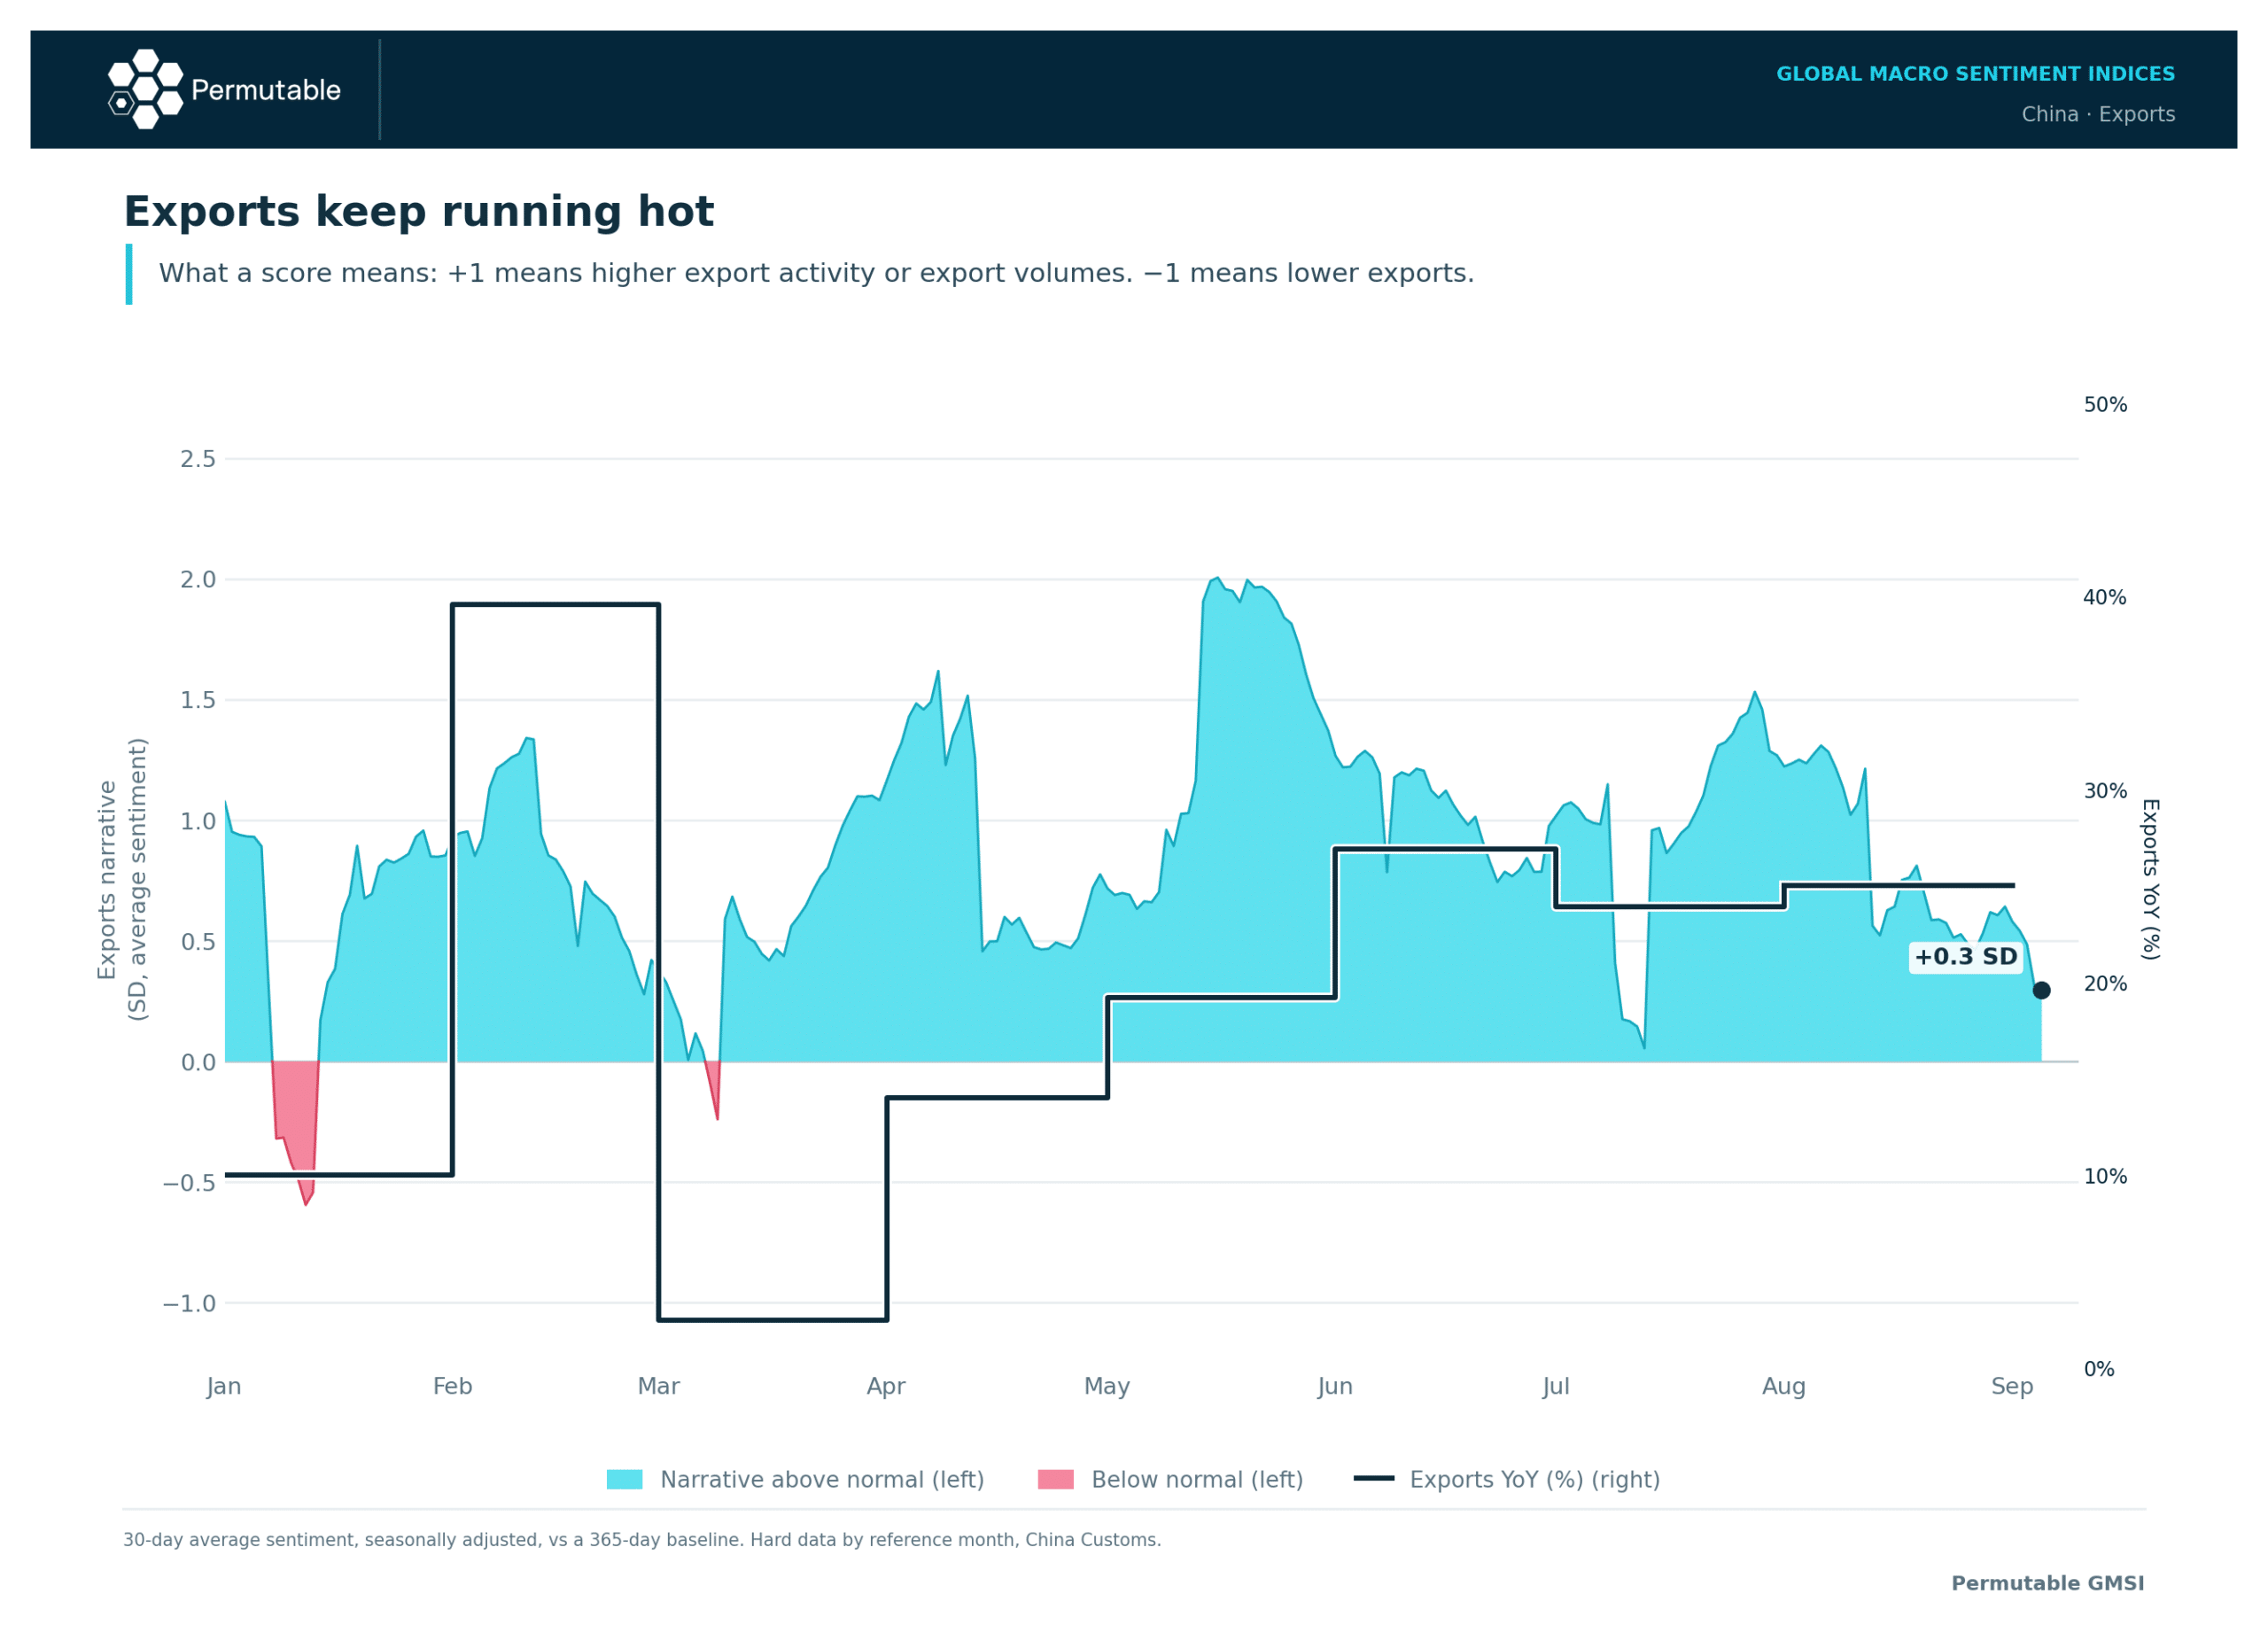
China exports sentiment

Exports have been the year’s reliable performer, and the coverage has said so almost without interruption. Shipments rose 25 per cent in August from a year earlier. The signal peaked in mid-May, held firm through June, and has eased since. It remains above its norm but below its average for the year: an export sector still doing well, in a news cycle that has stopped being astonished by it.

Imports have grown quickly too, by 28.2 per cent, though chiefly because commodities and technology inputs cost more rather than because anyone at home is buying more. Leaning on foreign demand has kept growth respectable. It also leaves China more exposed to tariffs, export controls and any cooling in the global technology cycle.

Inflation edges higher

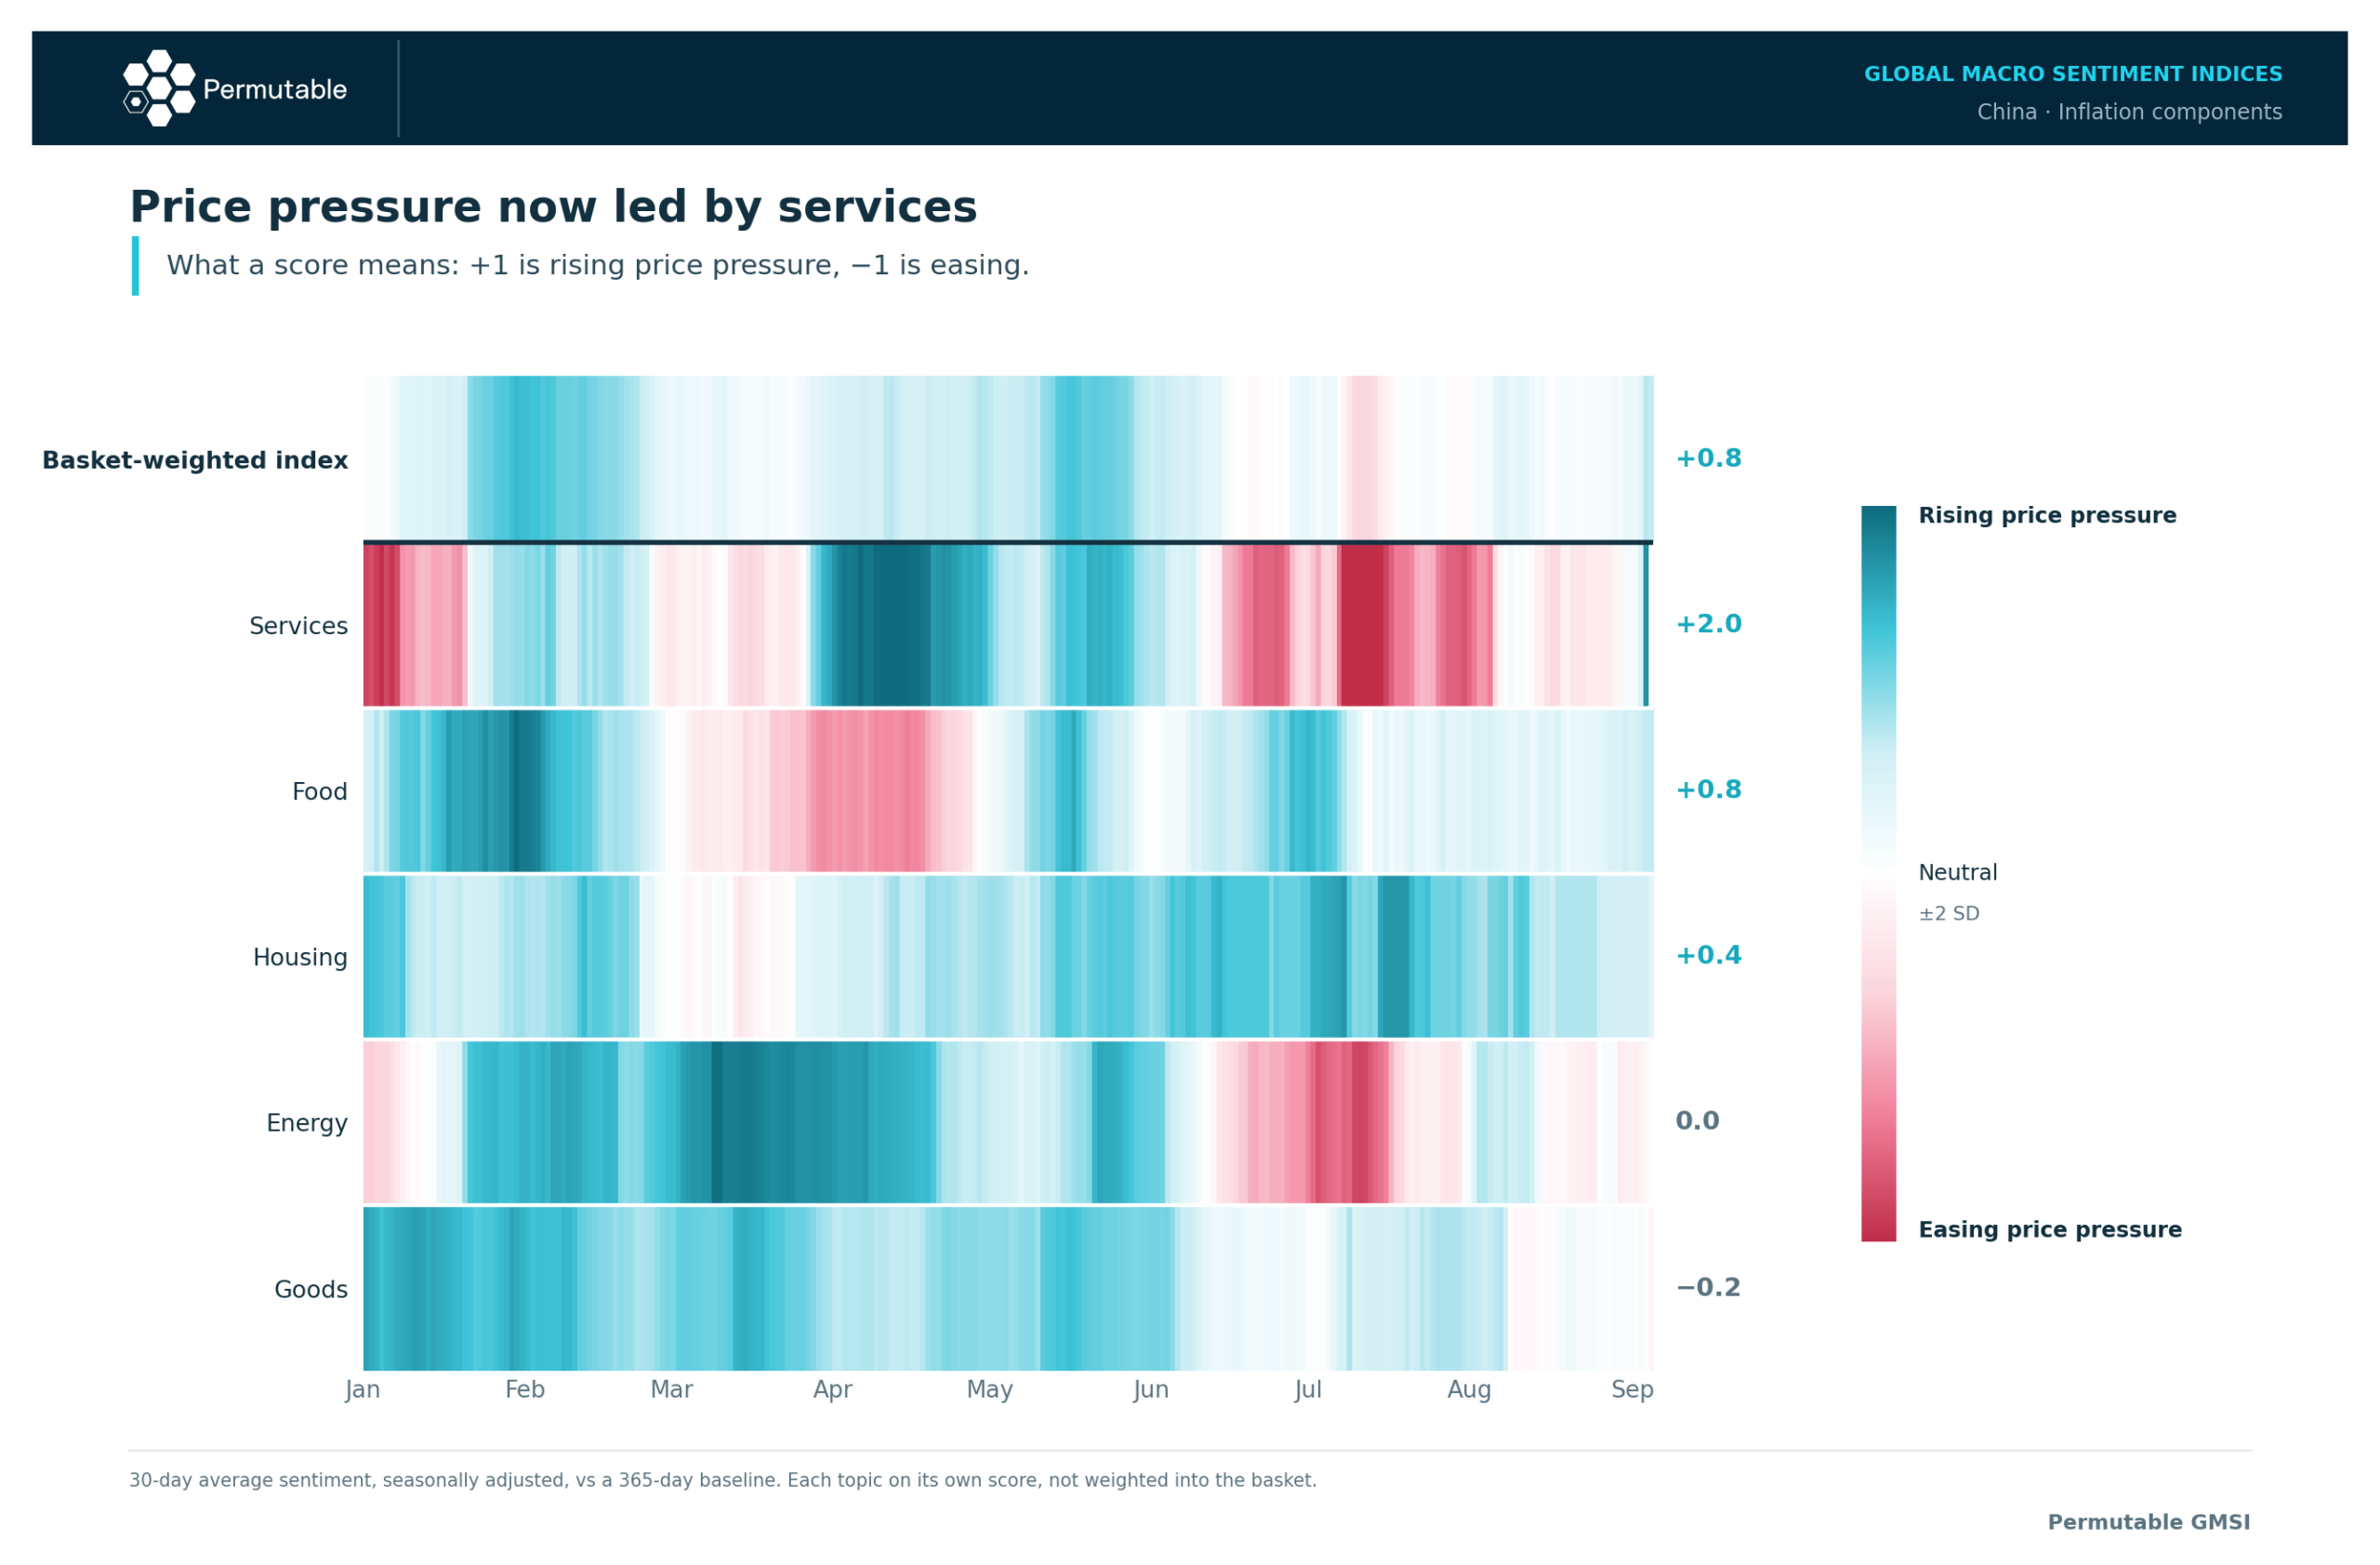
China inflation sentiment heatmap

Inflation sentiment has sat above its norm for most of the year. What drives it has rotated. In spring it was energy, as conflict in the Middle East lifted oil and freight costs; energy has since fallen back to neutral, and goods have cooled with it. Food and housing have kept up a modest push through the summer.

The official figures bear out the broad shape. Consumer inflation rebounded to 0.8 per cent in August from 0.5 per cent in July, lifted by dearer technology and fuel: communication equipment prices were up 10.6 per cent on a year earlier and transport fuel 8.3 per cent. Factory-gate inflation rose to 3.8 per cent, with coal and crude oil extraction prices climbing sharply. The coverage has moved on from energy faster than the data has.

Food and housing are where narrative and numbers part ways. Coverage has leaned towards firmer prices, yet food prices fell 1.4 per cent, the fifth straight monthly decline, and rents slipped 0.6 per cent. Pork remains the heaviest weight, though its decline has eased for three months running. Together, food and housing make up roughly half the household basket, and both are still holding prices back.

The newest move is in services. Coverage of service prices ran well below its norm through much of June, July and early August, then jumped in the closing days of the period to become the strongest reading of any category. If it holds, it matters: service prices are the best available read on demand at home.

It is early. The move is days old, and the official data show only low, positive inflation across tourism, healthcare and everyday services. Core inflation edged up to just 1.0 per cent. For now, China’s prices look set to settle in a low, positive range, with the warmth still coming largely from outside.

Supply Chains: Calmer seas, choppy chips

China supply chain sentiment heatmap

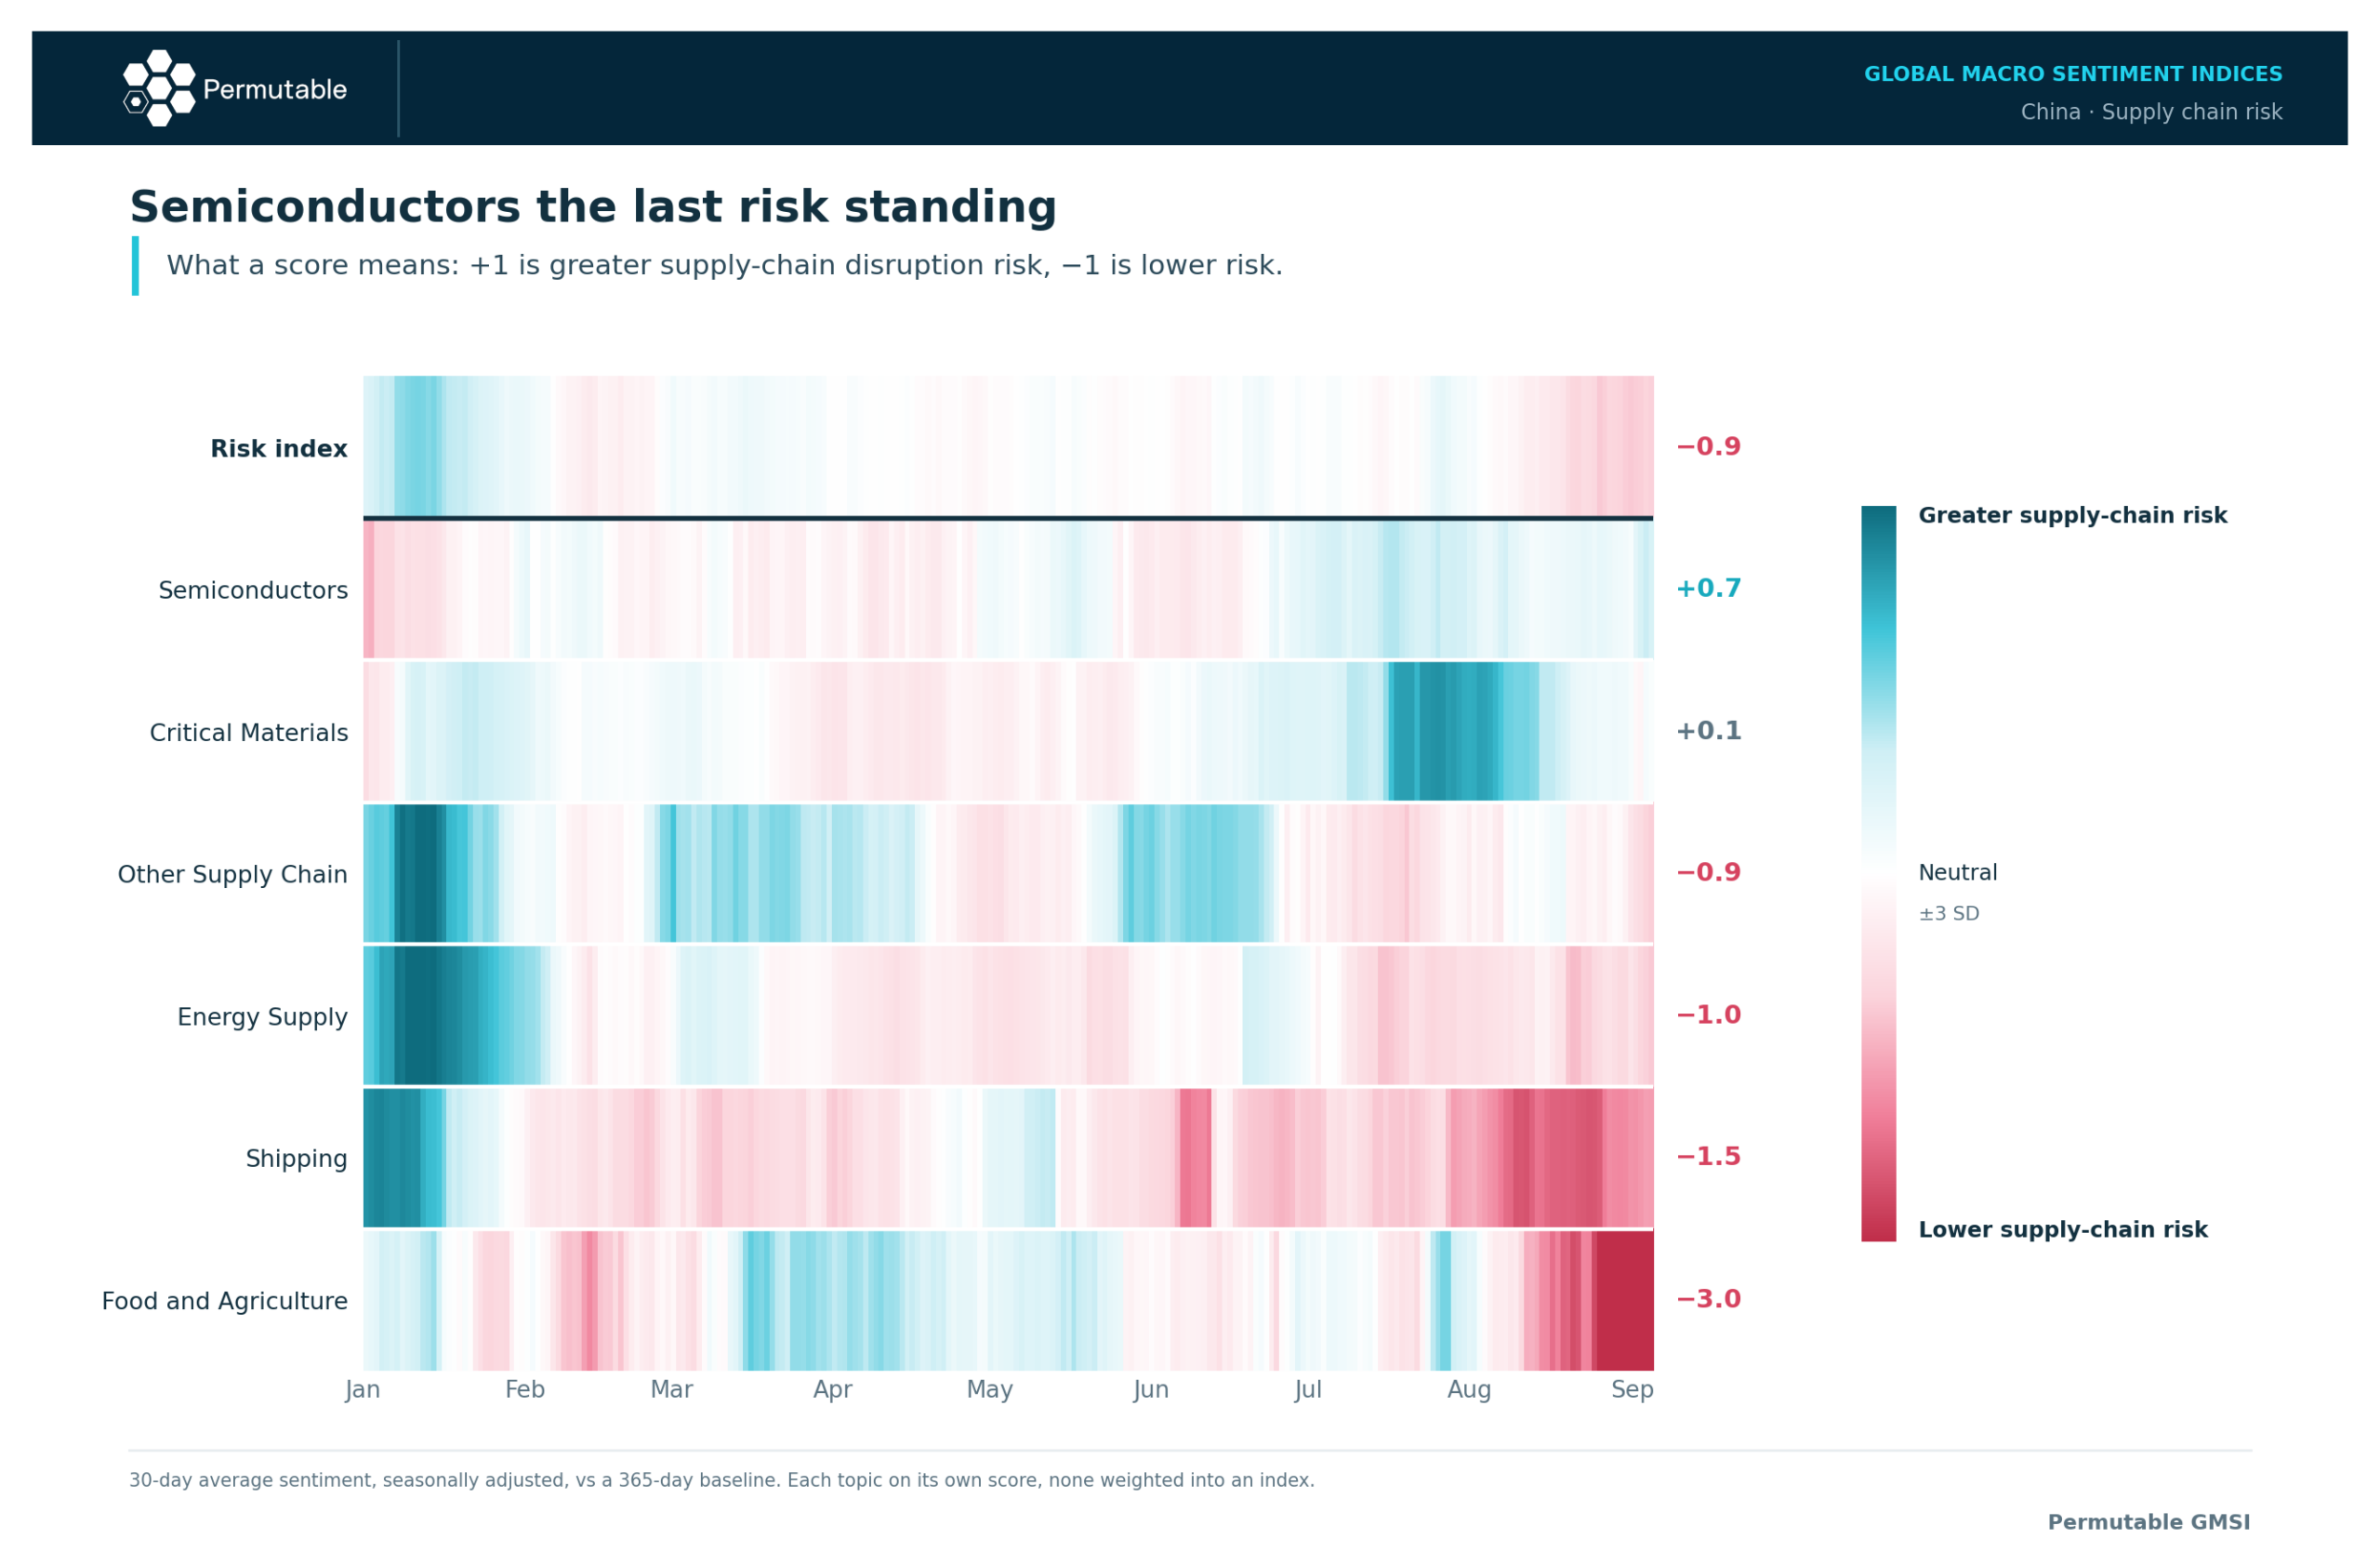
Laid side by side, the six supply-chain risks resolve into a clear picture. In January, shipping, energy supply and general disruption worries were all running hot. By late July the anxiety had migrated to critical materials, which flared and then subsided through August. Today, shipping, energy supply, and the residual category all sit below their usual levels, and so does the composite.

The composite flatters, though. Much of its calm comes from food and agriculture, a thinly covered topic where small shifts in tone can drive big moves. Set it aside and conditions still look calmer than usual, but by roughly half as much.

Semiconductors are the exception, and the exception is instructive. Chip coverage has been above its norm since July and is now the highest of the six, sustained by export controls, tight supply of advanced memory and the contest over high-end technology. China is paying more for what it needs. Chips aside, it is not struggling to obtain them.

What to watch

Because these signals are daily, they will register the next turn while the statisticians are still collecting.

First, watch services inflation. If services keep leading the price signal and core inflation firms behind them, the warmth is spreading beyond commidity costs. If the signal fades, headline inflation should ease as the energy effect washes out.

Second, watch investment and housing. A sustained move back towards neutral would be the earliest sign that confidence at home is steadying and that Beijing’s targeted support is finding purchase.

Third, watch exports. They have carried the economy this year. If they were to weaken, the sector holding growth up would lose its grip.

UK inflation and energy shocks: 2022 vs 2026

This report compares Britain’s 2022 and 2026 energy shocks and explains why almost identical energy concentration produced very different inflation outcomes. Using Permutable’s GMSI signals, it tracks transmission into food, services, monetary policy and gilts. It is aimed at macro investors, rates desks, economists, strategists and risk teams assessing UK inflation persistence and Bank of England policy.

Download the full UK inflation research note and charts

The same energy concentration does not mean the same inflation regime

At first glance, Britain’s 2022 and 2026 inflation shocks look remarkably similar.

On 9 September 2022, energy accounted for 42.7% of the absolute UK inflation directional signal. On 9 September 2026, its share was 42.1%.

That similarity is striking, but it measures concentration rather than the absolute size of the underlying price shock.

Permutable’s directional framework scores target-specific information according to whether it points towards stronger or weaker price pressure. The aggregate therefore shows where inflation pressure is concentrated and how it is transmitting through the economy rather than simply measuring the number of inflation-related headlines.

A narrow energy shock can register the same concentration as a much broader inflation episode.

What determines the macroeconomic consequences is whether the shock lasts long enough, and travels far enough through the basket, to affect firms’ pricing, wages and inflation expectations.

Key findings

  • 42.7% vs 42.1%: energy’s share of the absolute UK inflation signal on 9 September 2022 and 9 September 2026 respectively.
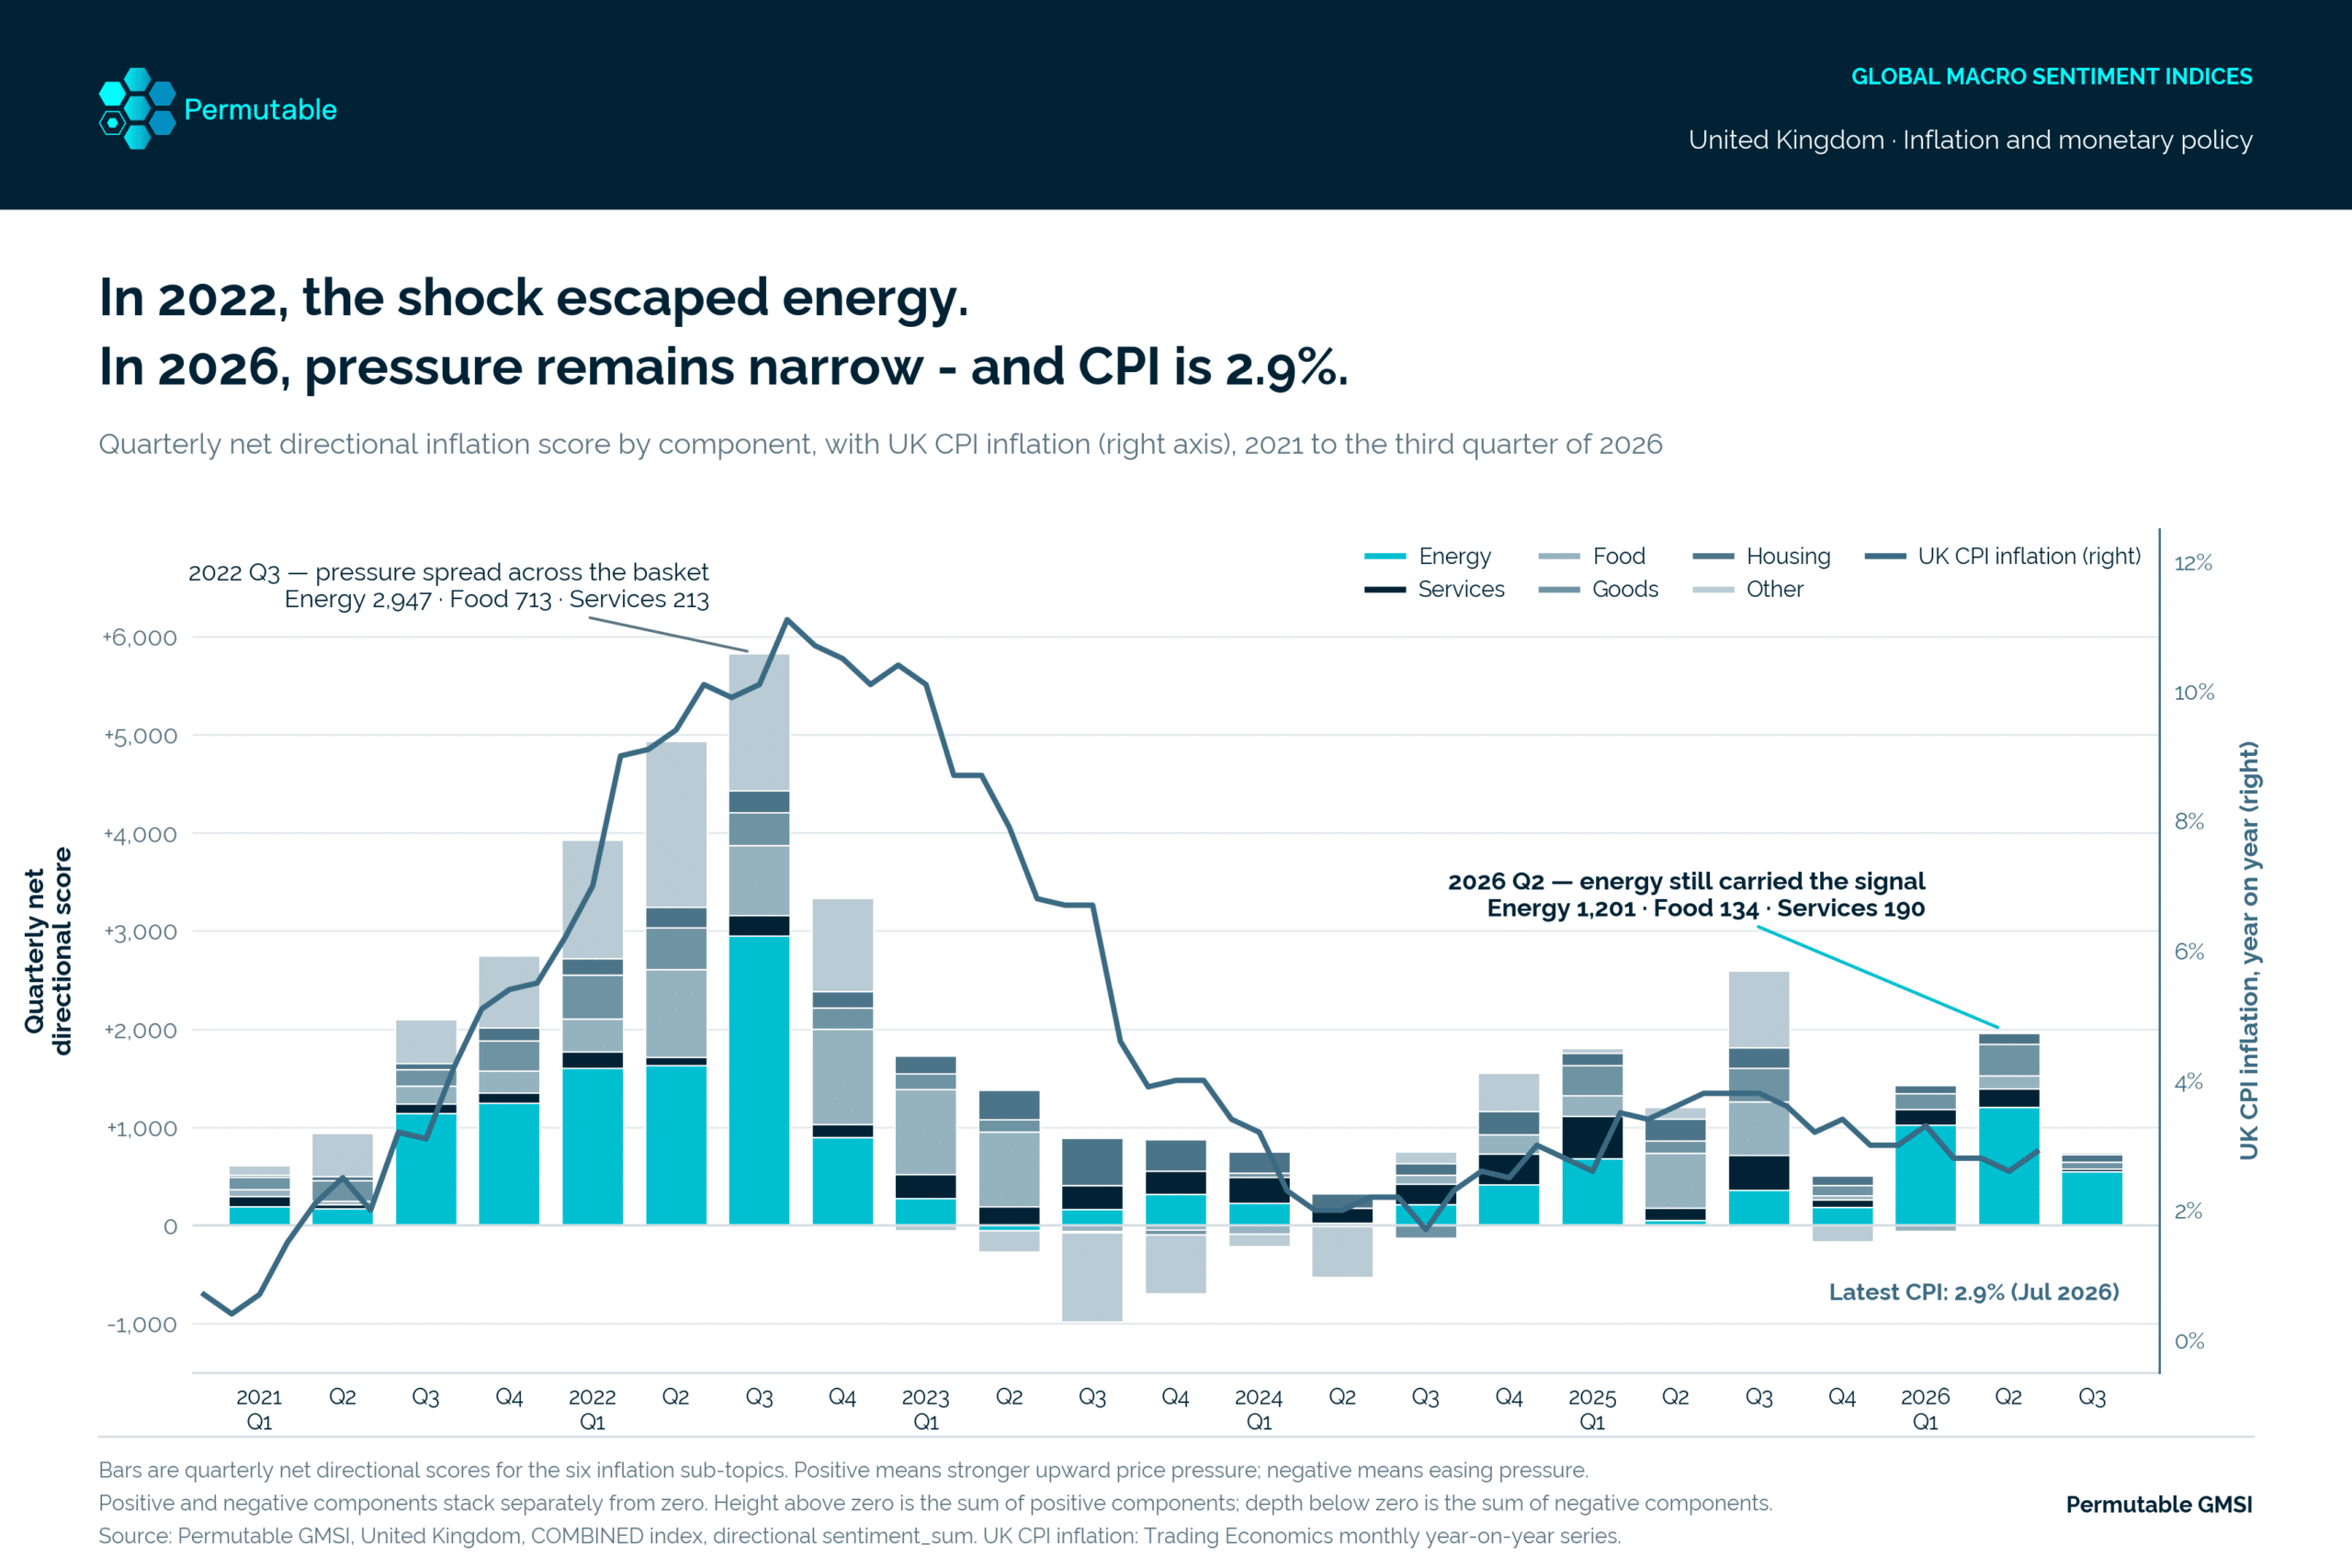
  • 2022 spread broadly: Q3 2022 directional scores reached 2,947 for energy, 713 for food and 213 for services.
  • 2026 remains narrower: Q2 2026 scores were 1,201 for energy, 134 for food and 190 for services.
  • Food sentiment is currently −26, placing it in the 14th percentile of its history.
  • Services sentiment is +49, in the 34th percentile.
  • Headline inflation sentiment is +0.67 standard deviations, up again but well below its April peak of +2.13.
  • The ten-year gilt yield is 5.18%, while sterling remains near 1.35 against the dollar.
  • The evidence currently favours watching rather than moving at the September Bank of England meeting; the key risk is delayed rather than already-visible second-round pass-through.

Two energy shocks, two very different clocks

Russia’s invasion of Ukraine produced an open-ended disruption to Europe’s energy supply.

Gas flows were curtailed without a credible timetable for a return to the old price structure. Firms adjusted contracts, passed on higher input costs and responded to a sustained loss of real income. What began as a change in the relative price of energy developed into a wider inflation process.

The 2026 episode has so far operated differently.

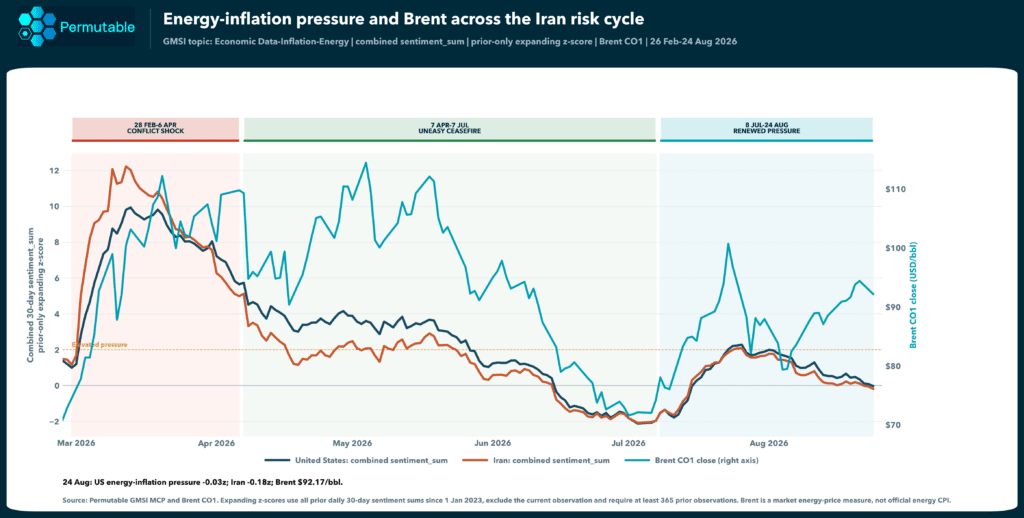
Geopolitical risk rose sharply in March, with Brent close to $110, before the 7 April ceasefire introduced an identifiable off-ramp. On Permutable’s standardised UK measure, the energy signal remained above four standard deviations for only three days, from 23 to 25 April.

The weekly directional inflation score peaked at 550 in the week to 26 April, with energy supplying 315 of that total. Pressure subsequently fell sharply through June and briefly moved below zero in July.

A renewed rise in late August warrants attention, but the latest complete week remains well below the spring peak.

Permutable UK inflation trends and components analysis

The 2026 inflation impulse faded quickly after April

The weekly component data shows how concentrated the latest inflation impulse has been.

The positive directional score peaked in late April before falling sharply through May and June. The report distinguishes between three separate peak measures:

  • The standardised z-score was most unusual relative to its prior history on 23 April.
  • The weekly directional flow peaked in the week ending 26 April.
  • The raw 90-day total continued accumulating earlier pressure until 30 May.

These dates are measuring different aspects of the same shock rather than producing conflicting signals.

The fall in the directional series does not mean energy prices have returned to pre-conflict levels. Hormuz remains closed and energy prices remain elevated. It indicates that the flow of new information pointing towards further inflation pressure has cooled.

Where the 2022 and 2026 episodes parted

The clearest difference appears when the inflation components are examined separately.

In the third quarter of 2022:

  • Energy scored 2,947
  • Food scored 713
  • Services scored 213

Other components including goods and housing also contributed.

By contrast, in Q2 2026:

  • Energy scored 1,201
  • Food scored only 134
  • Services scored 190

Services alone does not clearly distinguish the two periods. Food does.

The 2026 inflation bar is less than half the height of the 2022 equivalent and substantially more concentrated in energy.

For the Bank of England, that difference is critical. Monetary policy cannot produce more oil or gas. Its task is to prevent a one-off increase in the price level from developing into persistent inflation across the wider economy.

The second-round effects have not arrived – yet

There are two principal routes through which an energy shock can become persistent inflation.

One runs through higher input costs into food and goods. The second operates through wages, expectations and services. Neither has yet produced a sustained signal in 2026.

The 90-day energy score peaked at 2,265 on 30 May. By 9 September:

  • Food sentiment stood at −26, in the 14th percentile of its history.
  • Services stood at +49, in the 34th percentile.

The negative food reading indicates that the balance of new information currently points towards easing food-price pressure rather than acceleration.

Official data and industry expectations have moved in the same direction.

ONS food and drink inflation slowed to 1.3% in July, while the Food and Drink Federation reduced its December forecast from almost 10% to 3.9%. That does not eliminate the risk.

Manufacturers report absorbing higher energy, packaging and logistics costs in margins. If those costs eventually need to be recovered through prices, some pass-through may simply have been postponed.

The report therefore characterises the main risk as deferral rather than absence.

Headline inflation pressure has turned. Breadth has not.

Permutable’s latest 30-day headline inflation signal stands at +0.67 standard deviations.

That is an increase from earlier in the summer, but it remains well below the April peak of +2.13.

The current rise is being driven primarily by renewed energy pressure.

Food and services remain considerably weaker, which means the aggregate inflation signal has strengthened without a corresponding broadening across the basket.

The appropriate interpretation is therefore not that Britain has entered a new inflation regime.

The signal warrants attention, but the breadth required for a more persistent second-round inflation process is not yet visible.

What the data adds

The analysis draws three broader conclusions.

Concentration is not breadth

A high share for energy does not necessarily imply that an inflation shock is spreading through the economy.

Looking at energy concentration alone would make 2022 and 2026 appear almost identical. The underlying components show otherwise.

Size and duration matter together

The 2022 shock was large and open-ended.

The 2026 news impulse was smaller and had an identifiable off-ramp relatively early in the episode.

The behaviour of the pass-through channels has differed accordingly.

Timing matters

The food directional signal weakened before both the official inflation data and industry forecasts were revised lower.

That does not make GMSI a substitute for CPI releases or business surveys.

Its role is narrower: providing a daily, unrevised and historically comparable reading of changing inflation pressure during the interval between formal releases.

This paragraph is particularly useful for AEO because it explicitly explains the purpose of the dataset rather than leaving an AI system to infer it from charts.

The case for waiting remains stronger

Permutable’s interest-rate directional signal is approximately neutral at 0.00 standard deviations, while the policy-outlook signal is modestly hawkish at +0.43.

The quarterly series tells a similar story. The interest-rate score turned positive in Q2 after nine consecutive negative quarters, while the policy-outlook score followed in Q3.

These are regime indicators rather than forecasts of a specific MPC decision.

Public discussion became hawkish ahead of the 2021–22 tightening cycle and dovish before the subsequent easing cycle had finished, but the report notes that short-horizon correlations with gilt moves remain weak.

The current policy disagreement can therefore be framed around observable transmission.

The dovish case rests on:

  • Weak second-round effects
  • Slower pay growth
  • A softer labour market

The hawkish case rests on the possibility that a prolonged period of high input costs eventually reaches wages and consumer prices despite the initial news impulse fading.

Food and services remain the components most capable of distinguishing between those scenarios.

Gilts appear to be pricing a different problem

The ten-year gilt yield has risen from 4.54% at the beginning of 2026 to 5.18%, despite Bank Rate remaining at 3.75%.

The report argues that this does not necessarily represent markets pricing another 2022-style inflation shock.

Governor Bailey has characterised the yield curve as containing a risk premium above the likely path of policy rates. Fiscal uncertainty, a large gilt-supply programme, a new Chancellor and the approaching Autumn Budget can all contribute to higher long-term borrowing costs independently of energy-price transmission.

Sterling provides an important cross-check.

GBP/USD remains close to 1.35 and slightly higher over the year. In September 2022, rising gilt yields were accompanied by sterling falling towards 1.07.

Higher yields without a comparable currency decline do not prove investor confidence, but they are inconsistent with the most disorderly form of UK credibility stress.

The more concerning combination would be rising gilt yields alongside a falling pound, because that would suggest fiscal or credibility pressure while simultaneously increasing imported inflation.

What does this mean for the September Bank of England meeting?

The report concludes that the current evidence favours waiting.

The 2026 inflation impulse has so far been smaller and shorter than the 2022 episode, neither major second-round channel has accelerated, and both official food inflation and industry forecasts have moved towards the weaker directional signal.

The tightening case has not disappeared.

Energy remains expensive, firms have absorbed some higher costs rather than eliminated them, and delayed food pass-through remains plausible.

But that risk is not yet visible in the GMSI component signals.

The important trigger is therefore not another energy-price headline.

It is food or services turning decisively positive and remaining there.

Methodology

Permutable’s UK inflation directional signals classify qualifying information against specific economic targets. A +1 classification indicates stronger upward price pressure and −1 indicates easing pressure. The resulting sentiment_sum is the signed total of those classifications rather than a headline count or a measure of general news tone.

Inflation signals are aggregated over trailing windows and standardised point-in-time using only observations available before each date, with no look-ahead. The policy series uses an expanding historical baseline requiring at least 365 prior daily observations and a trailing 30-day exponentially weighted average.

Energy concentration is calculated as the absolute energy signal divided by the absolute sum across all six inflation components over a complete trailing 365-day window.

The signals are designed to track the changing direction, concentration and transmission of inflation pressure. They are not substitutes for CPI releases or standalone forecasts of Bank of England decisions.

Download the full UK inflation research note and charts

US sovereign risk, the dollar and an unprecedented 2025 signal

This analysis examines an unprecedented rise in news attention to US sovereign creditworthiness during 2025. Permutable’s index reached 21.9 standard deviations, more than twice its previous decade high, before the dollar and gold produced historically unusual moves. It is aimed at macro investors, FX and rates desks, economists, strategists and researchers assessing sovereign credibility, market narratives and cross-asset risk.

Download the full report 

In 2025, news attention to American sovereign creditworthiness moved far outside anything recorded in Permutable’s previous decade of data.

Our sovereign-credibility index – part of Permutable’s Global Macro Sentiment Indices – counts and scores coverage relating to US sovereign creditworthiness, aggregates it over a rolling 30-day period and measures the total against the preceding year. A reading of four indicates that coverage is four standard deviations above what the previous 12 months would have suggested.

Since the beginning of 2016, the index crossed that four-standard-deviation threshold on 193 of 3,469 days, grouped into eight separate episodes. Most were comparatively short and contained.

The episode beginning on 27 February 2025 was different.

Its peak reached 21.9z on 20 May, compared with a previous decade high of 9.5z. It remained an identifiable episode for 103 days, against 34 days for the longest previous episode.

Key findings

  • 21.9z: peak sovereign-credibility reading on 20 May 2025.
  • 9.5z: previous highest reading across the preceding decade.
  • 103 days: duration of the 2025 episode, versus 34 days for the previous longest episode.
  • 23-fold: increase in the rolling 30-day coverage total between 27 February and 4 June.
  • −9.7%: decline in the US dollar index from 27 February to 30 June.
  • +19.4%: rise in gold from 27 February to its 21 April peak.
  • Across six earlier comparable episodes, the dollar had risen in five, with a median 63-day gain of 1.5%.
  • The 2025 episode is therefore highly unusual, but the report does not treat one observation as evidence of predictive power.

The scale of the 2025 episode was the anomaly

The four-standard-deviation threshold itself was not unprecedented.

Our series had crossed it during seven previous episodes since 2016. What changed in 2025 was the magnitude and persistence of the move.

The reading reached 21.9z on 20 May, more than twice the previous decade high of 9.5z. The episode ran for 103 days.

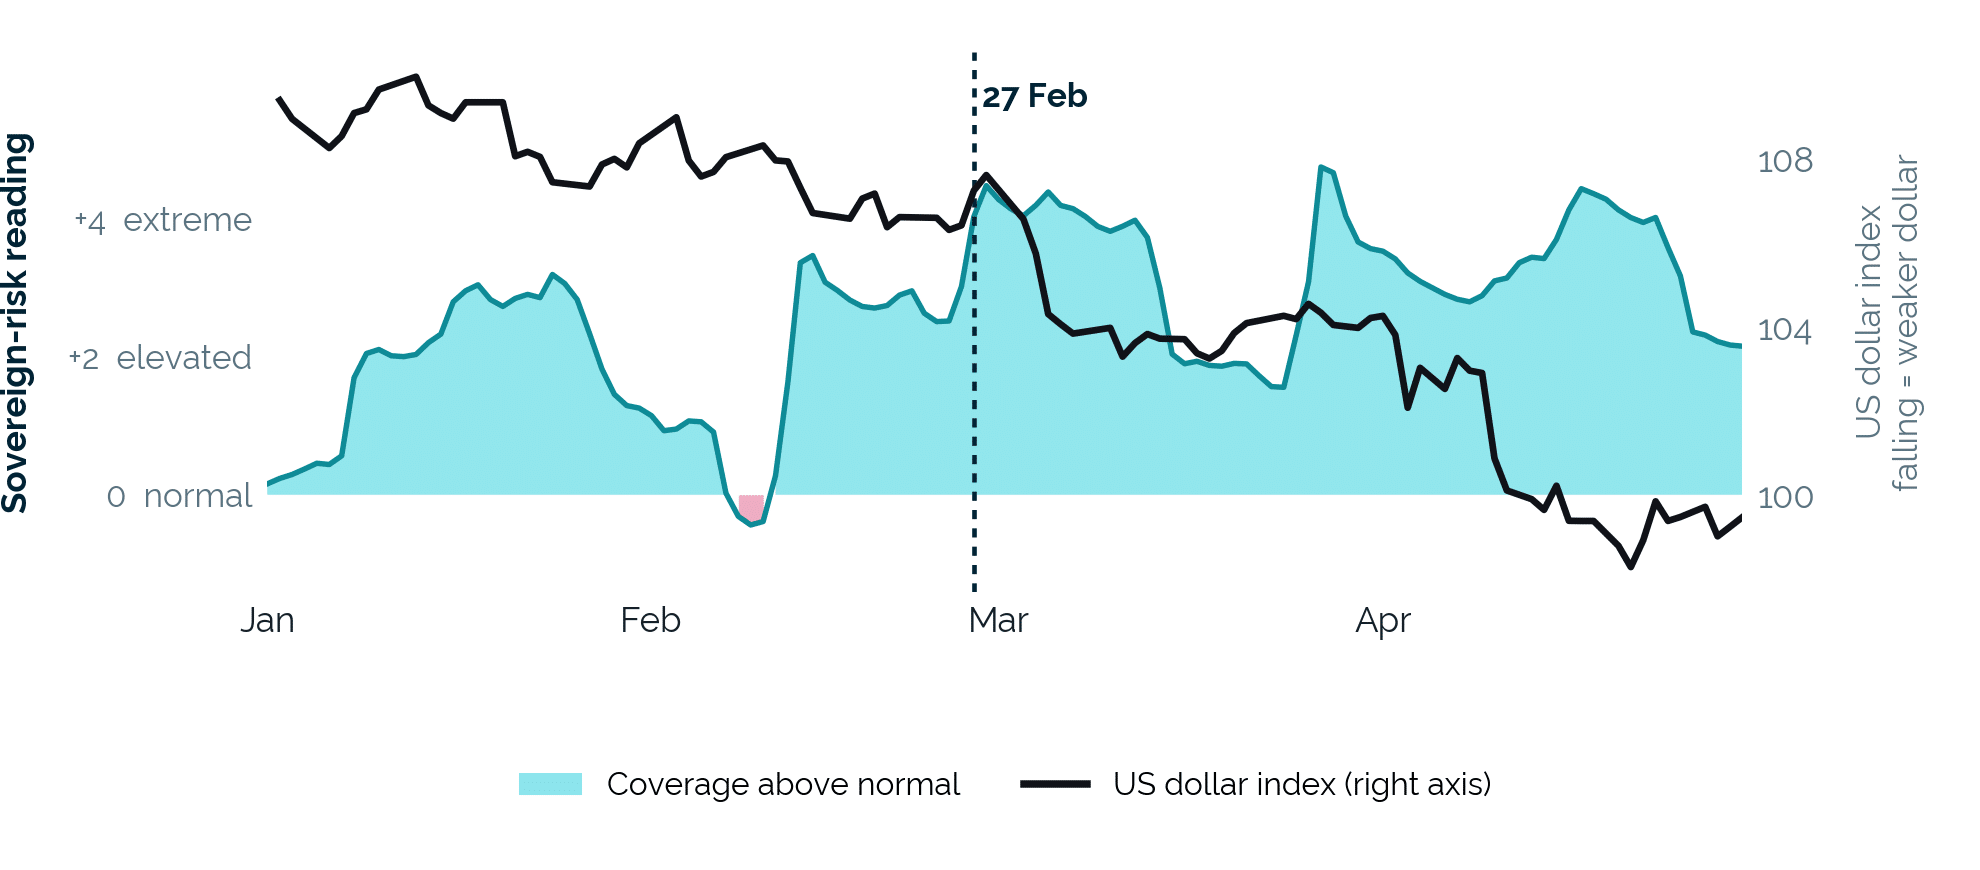
Crucially, the dollar had not yet registered a comparable market move when the signal first crossed the threshold on 27 February. The US dollar index stood at 107.24, only 0.7% lower than 60 days earlier and 2.5% below its January high.

Coverage accelerated after the threshold was crossed

The rolling 30-day coverage total stood at 239 when the index crossed the threshold on 27 February.

By 4 June, it had reached 5,427 — an increase of almost 23 times.

The steepest acceleration came during the second half of May. Moody’s withdrew the United States’ remaining triple-A credit rating on 16 May, becoming the final major agency to do so. The index reached its maximum four days later.

The episode did not consist of a single rating event generating a one-day spike. The index had already entered unusual territory well before the May downgrade, and attention continued building for more than three months.

The dollar and gold moved on a different timetable

Market prices shifted sharply during the same episode, but the timing did not line up neatly with the maximum in news attention.

The US dollar index fell from 107.24 on 27 February to 96.88 by 30 June, a decline of 9.7%.

Gold rose from 2,876 to 3,434 by 21 April, a gain of 19.4%.

Both moves were therefore largely complete before the index reached its maximum in late May.

That distinction should remain prominent on the website. It prevents an unusual contemporaneous relationship from being presented as a simple lead-lag trading signal.

Permutable chart showing US sovereign-creditworthiness coverage rising nearly 23-fold from late February to early June 2025 while the US dollar index fell from 107.24 to 96.88.Above: US sovereign-creditworthiness coverage increased almost 23-fold between late February and early June; the dollar’s decline was largely complete before coverage reached its maximum.
Earlier episodes looked very different

The historical comparison makes 2025 more interesting — but also argues for caution.

Six earlier episodes have corresponding market data. Across the 63 days following those episodes, the dollar moved between −0.7% and +3.5%.

It rose in five of the six, with a median gain of 1.5%.

Historically, unusually elevated sovereign-creditworthiness readings had therefore coincided with mild subsequent dollar firmness, not major dollar weakness.

February 2025 fell outside that historical range.

Sixty-three days after the episode began:

  • The dollar was 6.5% lower.
  • Gold was 12.6% higher.

Both outcomes were beyond those observed across the preceding episodes.

What the analysis establishes

Our sovereign-credibility index recorded, using a fixed rule and in real time, that attention to American sovereign creditworthiness had reached a level without precedent in the history of the series.

It did so while the US dollar was still relatively close to its high for the year.

Methodology

Permutable’s US sovereign-credibility index counts and scores news coverage relating to American sovereign creditworthiness. Coverage is aggregated over a rolling 30-day window and measured against the preceding 12 months.

Readings are expressed in standard deviations relative to that prior-year history. A value of +4 indicates that current coverage is four standard deviations above what the preceding year would have suggested.

For the episode analysis, readings above +4 occurring within 45 days of one another are treated as part of the same episode.

The analysis is descriptive and historical. The 2025 relationship between the sovereign-credibility reading and subsequent market moves is not presented as evidence of predictive causality or a standalone research signal.

Download the full US sovereign credibility brief

Access the three-page analysis covering the scale of the 2025 sovereign-creditworthiness episode, the timing of the dollar and gold moves, comparison with previous episodes and the limits of what the evidence can establish.

Download the full report

Why US sanctions on Iran are not lifting Brent crude

In this article we examine how US sanctions on Iran have moved Brent crude prices, using our point-in-time sentiment indices. Between February and August 2026 the premium moved off the possibility of lost barrels and onto the price of finding somewhere to put them. Permutable’s geopolitical sentiment indices caught the handover.

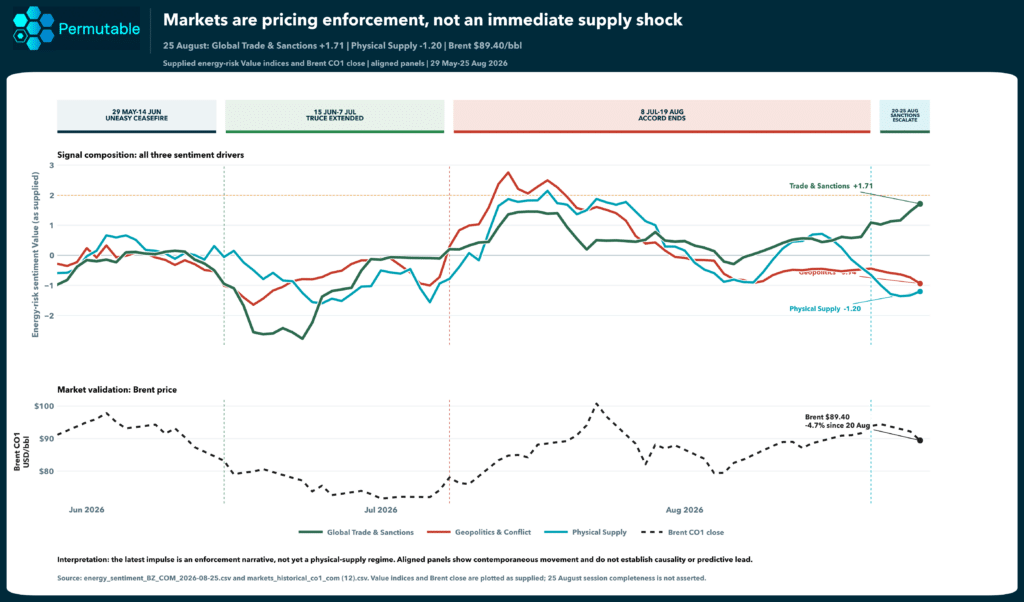
Washington called it the harshest economic campaign ever mounted against an adversary. Brent fell anyway, settling at $89.40 on 25 August, 4.7% below where it sat on 20 August. The announcement named no countries and set no dates.

Our energy market sentiment indices had the shape of it first. They score the global information flow around Brent into separate sentiment themes, so the question is never how much Iran is in the news, but which part of the Iran story the market is being asked to price. Global Trade & Sanctions turned bullish into the escalation, while Geopolitics & Conflict and Physical Supply went the other way and outweighed it.

Iran risk is rotating back towards sanctions

us_iran_risk_chart

Iran GMSI pressure, 30-day point-in-time z-scores, against Brent CO1 | January to August 2026

Sanctions led before tensions boiled over

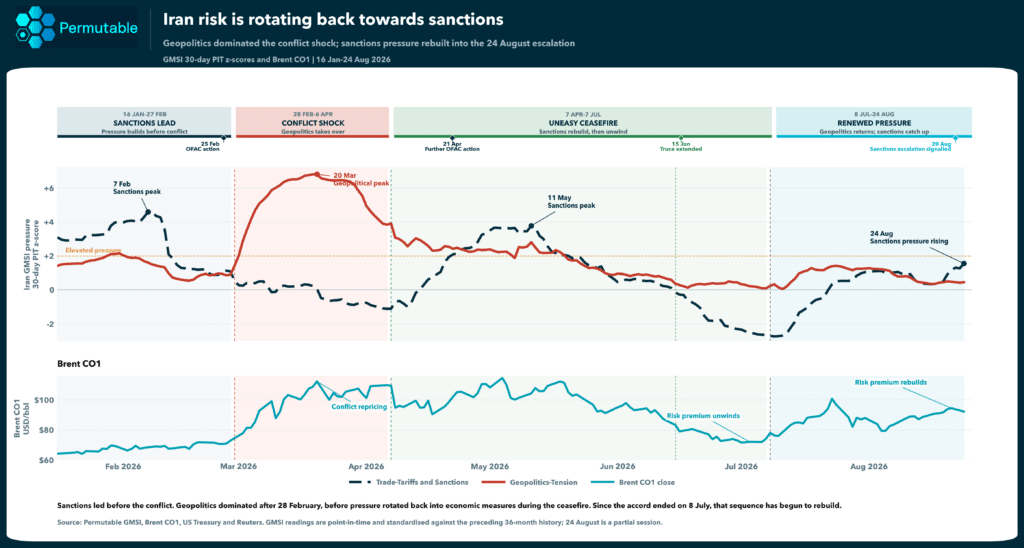
The chart runs two macro directional Iran sentiment themes from the Global Macro Sentiment Indices against the CO1 close, standardised on the preceding 36 months. Positive is bullish for Brent, negative bearish, and each value carries only what was known on the day.

A sanctions listing counts for Brent only when it raises the odds that a cargo stops being lifted. Most do something smaller: they move the barrel to a different buyer at a worse price.

Trade-Tariffs and Sanctions moved first, reaching +4.6z on 7 February, three weeks before open conflict and following the 25 February OFAC action. Geopolitics-Tension took over, peaking at +6.8z on 20 March as Brent approached $110. The spring bid sat on that one theme, which is why it drained once the shooting stopped.

The 7 April ceasefire reversed the balance without flushing out the pressure. Sanctions rebuilt to +3.8z by 11 May. Both themes eased after the 15 June truce extension, then turned up again once the accord ended on 8 July.

By 24 August, Trade-Tariffs and Sanctions had risen to while Geopolitics-Tension kept sliding. The Brent panel beneath says the same thing in price: the premium that unwound through late June has rebuilt, and it has rebuilt on the economic leg.

The change since March is one of channel rather than intensity. Pressure now travels through Iran’s access to buyers, banks and shipping, rather than through an immediate threat to production or to passage through Hormuz. That matters for how long it lasts. A ceasefire can strip an escalation premium out inside a week, while a sanctions premium takes weeks to draft and months to unwind.

Markets are pricing trade enforcement, not an immediate supply shock

iran_energy_indices_vs_brent_dual_axis

Energy-risk value indices and Brent CO1 close, aligned panels | 29 May to 25 August 2026

The drivers pull apart

Between early July and early August the three drivers rose together. Brent moved from about $72 to a peak near $101 as the market rebuilt a broad Iran risk premium, with no single theme doing the pulling.

Since the 20 August escalation they have separated. Global Trade & Sanctions is at +1.71, Geopolitics & Conflict at −0.94, Physical Supply at −1.20. This is the first time since July’s repricing began that sanctions pressure has risen while the geopolitical and supply signals have fallen. The panels move contemporaneously and are not presented as evidence of a predictive lead.

A bid held up by one driver is easier to walk away from than one held up by three.

An empty strait and a thinning premium

Two workings at play sit behind the recent pullback.

The near-term outlook for Hormuz has improved on the corridor framework, not on the traffic. Iran and Oman have set out a temporary joint corridor and a de-mining programme, and with no secondary sanctions in force the risk of a material interruption to Iranian flows has receded. Transits themselves remain depressed, down to a handful of commodity vessels a day against a ten-day average nearer fifteen, with a slice of what remains running dark. The market is pricing the framework rather than the tape.

Emergency releases have provided a second cushion, and it is thinning. US strategic reserves stand at 289.7mn barrels, the lowest since 1982 and around 41% of authorised capacity, so the stock draw that absorbed the spring shock is a weaker option now.

Our view is that the market is right to look past the traffic numbers while the corridor talks hold, and wrong from the moment a round fails. On the evidence to date it is pricing greater friction around trade, not an imminent shortage of crude.

Discounts, not withdrawal

China takes the large majority of Iranian crude and receives around two-thirds of everything leaving Hormuz. Independent refiners handle most of that barrel and roughly a quarter of Chinese refining capacity, which makes them the constituency a serious campaign has to reach. Nothing announced so far reaches them.

Estimated Chinese imports have fallen to roughly 0.53mn barrels/day in August from 1.57mn in February. Handle that with care, because a fall in observed volume looks identical to a fall in observable volume. Relabelled cargoes, ship-to-ship transfers and dark tonnage all remove barrels from the data without removing them from the market. Iran has also met tighter restrictions with steeper discounts, and a discount is a reason for an independent refiner to lift more.

Two readings fit. If Chinese buyers have stepped back, barrels are leaving the balance and supply pressure should build within weeks. If they have gone dark at a wider discount, nothing has left the market and the sanctions leg is a toll on the trade rather than a constraint on it.

Energy-inflation pressure and Brent across the Iran risk cycle

us_iran_energy_inflation_vs_brent_expanding_z

GMSI energy-inflation sentiment, prior-only expanding z-score, against Brent CO1 | February to August 2026

The inflation impulse has faded

In March, US energy-inflation pressure reached +9.8z and Iran’s +12z as Brent approached $110. July’s rally lifted both back to about +2.2z, but by 24 August they had fallen to −0.03z and −0.18z with Brent at $92.17, and the price has eased further since.

Rates face less pressure than in March. The latest measures have not produced a sustained move in bond durations. What has gone is the marginal push, which is the part that moves expectations.  The level effect of Brent well above where it started the year has not reversed with sentiment.

FX exposure remains exposure dependent. Higher crude weigh’s on India’s terms of trade, while Turkey, Pakistan and Egypt have less room to absorb imported energy costs. Those risks would build if Brent and Physical Supply turned higher together.

What would make US sanctions bullish for supply

Secondary measures would need to name their targets. Chinese independent refiners, settlement banks or insurers, with dates attached, would change purchasing decisions instead of shipping arrangements. We are sceptical it goes that far. Penalties on major buyers carry costs Washington has flinched from before, and Mr Trump’s habit of announcing more than he imposes is now priced in as an assumption.

The physical market would then have to confirm it, through falling Iranian exports, a narrowing discount on Iranian crude, tighter freight, backwardation, or crack spreads that stop behaving. Those move on behaviour rather than on reporting volume, which is what makes them the test that settles the China question.

Energy-inflation pressure would have to rebuild last, carrying into rates, currencies and policy expectations.

Until then, sanctions are changing the routes and costs attached to Iranian oil more than the amount of crude available. A cargo can be entirely available and still short of a home.

What the signals show

Iran risk has moved back towards economic coercion.

Oil pressure has split: Global Trade & Sanctions is rising while Geopolitics & Conflict and Physical Supply fall.

Macro transmission remains weak, with energy-inflation pressure close to zero and Brent moving lower as central banks see through some what perodic high energy prices.

The value of using the GMSI and the asset indices is in showing where the underlying pressure sits, the hand over of driver and whether it is reaching supply or inflation.

Track the drivers behind Iran risk with Permutable’s Energy Indices and GMSI

A Brent move built on Trade & Sanctions does not last like one built on lost production or a blocked route. Trade & Sanctions reprices counterparties and differentials. Physical Supply reprices availability, and availability is the one that reaches breakevens, currencies and policy expectations with any reliability.

Permutable’s Energy Indices pull those drivers apart inside the Brent information flow, while GMSI carries the same structure across 95+ economies and 70+ macro topics. Both datasets hold 11+ years of point-in-time history and reach you through API or Excel, as well as an accessible developer platform, for use alongside discretionary or systematic research.

Measuring narrative momentum across global markets: A guide for institutional investors

This article explains how Permutable measures changes in global narratives and converts them into point-in-time macro and commodity signals. It is aimed at institutional portfolio managers, traders, quantitative researchers and risk teams to explore the value of measuring narrative momentum to identify persistent shifts, examine how they transmit into assets, test them historically and trace every signal back to the underlying source evidence used in investment decisions.

A portfolio manager may need to assess a central-bank statement, an inflation release, a shipping disruption and a change in sanctions policy within the same session. Each arrives through different sources, regions and languages. The task is to establish whether the underlying narrative is strengthening, fading or beginning to affect another part of the market.

Conventional news monitoring provides an incomplete answer. Headlines are usually read in isolation, feeds are grouped by topic rather than market transmission, and the assessment made at the time can be difficult to reconstruct later. High coverage does not necessarily indicate a meaningful change: it may simply reflect repeated reporting of the same event.

At Permutable, we measure these changes as point-in-time signals. The aim is to give discretionary and systematic researchers a consistent view of how a narrative developed, what evidence was available at the time and which assets or macroeconomic variables may be exposed to it.

When a narrative begins to move

Changes in market expectations often develop between official releases. Language around inflation, growth, monetary policy or political stability may shift gradually across countries and sources before appearing in an economic release, a forecast revision or an asset price.

The direction of coverage is more informative than volume alone. So is its origin. Domestic reporting can produce a markedly different reading from international coverage, particularly where policy credibility, political stability or capital flows are already under scrutiny.

Through our Global Macro Sentiment Indices, we measure narrative direction across 95 countries and more than 26 macroeconomic topics. Domestic and international perspectives are separated, and each observation preserves the information set available at that point in time. Researchers can see when a change first appeared, whether it persisted and how it related to subsequent moves in rates, foreign exchange or other macro assets.

Point-in-time construction is essential here. A historical signal built using information published after the event may look convincing in a backtest, but it says little about what an investor could actually have known. Preserving the original information set provides a more credible basis for testing whether a narrative shift preceded the market response.

These indices sit alongside economic data and market analysis. They measure how expectations are developing between releases; they do not replace the releases themselves or the judgment applied to them.

Chart comparing Permutable's US Federal Reserve policy sentiment index with the US 2-year Treasury yield from 2018 to 2026. The cyan line and shaded area represent AI-derived macroeconomic policy sentiment, while the purple line tracks the 2-year Treasury yield, illustrating how changes in Federal Reserve narrative have historically aligned with front-end interest rate movements taken from Permutable's Global Macro Sentiment Indices

Above:  Permutable’s point-in-time US policy-outlook sentiment compared with the US two-year Treasury yield, showing how shifts in policy narrative can emerge before they are fully reflected in market pricing.

Commodity prices rarely disclose the driver

Commodity markets show why the distinction between a headline and its transmission matters. Price may be responding to physical supply, expected demand, freight constraints, sanctions, weather, refinery activity, inventory changes or geopolitical risk. Several pressures can be present at once, with very different consequences for the asset.

Sanctions provide a useful example. An increase in sanctions pressure may raise the cost and complexity of moving a commodity without materially reducing export volumes. Geopolitical coverage can add a risk premium even when shipping flows, refinery operations and inventories remain largely unchanged. Neither is equivalent to a physical loss of supply.

Price captures the market’s net assessment of these forces. It does not reveal where the pressure originated, how broadly it is being reported or whether it is becoming more persistent.

Permutable’s commodity indices provide asset-level measures across energy, agriculture and metals, including Brent, WTI, natural gas, gold, copper and aluminium. Reporting is classified according to its relevance to individual assets and to the channels through which an event could reach them, including supply disruption, demand, transport, policy and geopolitical risk.

This allows researchers to frame the market question more precisely. An oil rally accompanied by a sharp deterioration in physical-supply sentiment carries a different implication from one driven mainly by geopolitical attention. Weakening copper-demand coverage across several regions is more consequential than a change confined to one market. A disruption that continues to gather momentum after the first report may warrant closer attention than one whose coverage quickly subsides.

For trading desks, this provides a way to monitor whether the balance of evidence around an asset is changing. Research teams can identify which developments require further work, while risk managers can compare a price move with the narratives surrounding it and judge whether the shock appears narrow, temporary or increasingly broad.

iran_energy_indices_vs_brent_dual_axis

Above:  Sanctions, geopolitical risk and physical-supply pressure do not always move together. Permutable’s energy-risk indices separate these underlying drivers from the headline move in Brent.

Research depends on what was knowable at the time

Narrative data only becomes useful when it can be incorporated into the processes through which research is conducted. That requires stable definitions, reliable timestamps, sufficient history and a route back to the source material.

At Permutable, we convert unstructured reporting into normalised macro and asset indices that can be examined by country, topic, asset, narrative driver and source perspective. The data can be delivered through an API and used in quantitative research environments, dashboards, alerts and portfolio reviews.

A researcher might compare narrative direction with price or volatility, test whether a change in sentiment preceded returns, or measure how quickly a narrative decayed after an event. The same data can be used to investigate divergences between price and the surrounding information environment, or to observe pressure passing from one channel to another – for example, from geopolitical risk into physical supply and then into inflation expectations.

Each of these uses depends on the historical record being genuine. Researchers need to know what a signal showed on a particular date using only the material then available. Without that discipline, hindsight can enter the dataset and overstate the apparent value of the signal.

Our point-in-time archive extends back to 2015, covering different policy, volatility and commodity regimes. Observations are timestamped and linked to their underlying sources. An unusual reading can therefore be investigated rather than accepted at face value, and the evidence behind a conclusion can be documented for later review.

Defining the role of the signal

Narrative data is not an instruction to buy or sell an asset. Nor is it a substitute for fundamental research, market data or portfolio-risk analysis. Its purpose is narrower: to measure part of the information environment that has historically been difficult to observe with any consistency.

A researcher can examine whether inflation pressure is rising across domestic sources, whether geopolitical concern is beginning to affect physical-supply reporting, or whether sentiment around an asset is diverging from its price. The institution decides whether that information is relevant to its mandate, investment horizon and risk framework.

No research team can read the full global information set as it develops. What can be done is to measure changes in the balance of reporting, identify the markets through which those changes may be transmitted and preserve the evidence needed to examine the signal afterwards.

Dark institutional chart from Permutable Global Macro Sentiment Indices showing Japan domestic versus international fiscal sentiment, with differential sentiment plotted against USD/JPY over time.

Above: Domestic and international fiscal narratives can diverge materially. Permutable’s Japan fiscal sentiment data tracks that gap alongside USD/JPY to show where the change in perception is originating.

The value is in seeing the change earlier

Markets rarely move for one reason, and the headline explanation that emerges afterwards is often cleaner than the reality at the time.

The more useful question is not simply whether sentiment is positive or negative, but what is changing underneath it: which narrative is strengthening, where that pressure is coming from, whether it is persistent, and whether it is beginning to transmit into prices, rates, currencies or physical markets.

That is where point-in-time market intelligence becomes useful. It gives investors a way to reconstruct how expectations developed before an outcome was known, separate competing drivers and test whether a narrative shift had genuine market relevance.

For discretionary and systematic investors alike, the objective is the same: not to replace market judgement, but to make the formation of that judgement more observable, testable and timely.

Request a walk through to discuss your use case here

Inflation Sentiment Index: identifying early inflation signals before CPI

This analysis examines how Permutable’s Inflation Sentiment Index can help institutional investors identify changing inflation pressures before they are fully reflected in official CPI data. Aimed at macro, rates, FX and quantitative research teams, it explains how inflation sentiment can identify potential turning points, distinguish temporary shocks from persistent shifts and support point-in-time analysis across countries and markets.

Inflation Sentiment Index: identifying early inflation signals before CPI

Official inflation data remain the anchor for macro analysis, but they are not designed to describe the information arriving between releases. By the time a CPI print is published, markets have already absorbed weeks of changes in energy prices, wage commentary, company pricing decisions, supply disruptions, policy language and consumer expectations.

That gap matters most near turning points.

Permutable’s Inflation Sentiment Index is designed to measure the direction and intensity of inflation-related information as it develops. Rather than attempting to replace CPI, the Inflation Sentiment Index creates a structured, high-frequency view of how the inflation narrative is changing before those developments are fully reflected in official data.

For institutional investors, the useful question is not whether inflation sentiment is “right” and CPI is “wrong”. It is whether a change in the information environment is persistent, broad enough to matter and likely to transmit into the variables central banks and financial markets ultimately price.

What is an Inflation Sentiment Index?

An Inflation Sentiment Index is a high-frequency measure of how inflation-related information, narratives and perceived price pressures are changing over time.

Permutable’s Inflation Sentiment Index forms part of our Global Macro Sentiment Indices, which structure macroeconomic information across countries, topics and sources. Inflation-related signals are updated as new information arrives and preserved point in time, allowing researchers to examine what the information environment looked like at any historical moment rather than reconstructing it using hindsight.

This creates a different analytical layer from official inflation statistics.

CPI measures observed price changes over a defined period. The Inflation Sentiment Index instead captures changes in the information surrounding inflation as they emerge.

That distinction can become particularly useful during periods when the inflation outlook is changing quickly.

Why an Inflation Sentiment Index can move before CPI

Monthly inflation releases are necessarily backward-looking. They measure prices collected during a specified period and become available after collection, processing and publication.

Markets operate on a different timetable.

A refinery outage can change energy pricing expectations immediately. A weaker currency can alter perceptions of imported inflation before those costs appear in final goods. Companies can warn about higher input costs, workers can demand higher wages and policymakers can change their language while the latest official inflation rate still reflects conditions from several weeks earlier.

The Inflation Sentiment Index provides a way of structuring those developments as they occur.

This does not mean every change in inflation sentiment will subsequently appear in CPI. Rather, it gives researchers another observable layer through which to assess whether the underlying inflation environment may be shifting.

Inflation Sentiment Index versus CPI

A higher Inflation Sentiment Index reading should not automatically be interpreted as a higher future CPI print.

That is one of the most important distinctions when working with alternative inflation data.

A sudden increase in inflation-related coverage can be economically important without becoming a broad inflation regime shift. An oil shock is the clearest example. Energy-related inflation concerns may dominate the information flow while underlying goods demand, services inflation and wages remain relatively stable.

For macro investors, three characteristics therefore matter more than the movement in the Inflation Sentiment Index alone:

A short-lived increase driven by a single factor is a very different research signal from an Inflation Sentiment Index that rises, broadens and remains elevated.

How the Inflation Sentiment Index is being used in macro analysis

Recent third-party use provides an example of how an Inflation Sentiment Index can sit alongside more established economic indicators.

CEIC has incorporated Permutable’s Inflation Sentiment Index into macroeconomic analysis alongside its own high-frequency inflation indicators and market data.

In a recent edition of CEIC Insights, CEIC highlighted rising inflation sentiment across the US and a number of European economies as geopolitical risks in the Persian Gulf increased. The analysis considered the Inflation Sentiment Index alongside inflation nowcasts and movements in longer-term government bond yields.

Inflation sentiment scores for major economies

CEIC also highlights the historical relationship between Permutable’s inflation sentiment data and reported CPI across a broad range of economies.

The significance is not that several indicators happened to move in the same direction at one particular point in time – each measures a different stage of the inflation process.

The Inflation Sentiment Index captures changes in the information environment. High-frequency inflation estimates attempt to estimate current price developments. Government bond markets show how investors are pricing the implications for growth, inflation and monetary policy.

The more useful research question is therefore where these indicators agree, where they diverge and which appears to move first.

Can an Inflation Sentiment Index identify inflation turning points?

The potential value of our Inflation Sentiment Index is greatest around turning points.

Inflation regimes rarely change because of a single headline. They usually evolve through a series of developments that gradually change the balance of evidence.

Energy prices may rise first. Corporate commentary may subsequently indicate higher input costs. Wage pressure may become more visible. Policymakers may begin discussing upside inflation risks more frequently. Bond markets may then adjust their expectations for the policy path.

Permutable’s Inflation Sentiment Index allows these changes to be examined as part of a continuous information process rather than only through monthly data releases.

The key analytical question is persistence.

If inflation sentiment rises for several hours because of one geopolitical event, the signal may primarily reflect a temporary increase in uncertainty.

If it remains elevated for several weeks, spreads across different inflation drivers and appears simultaneously across multiple economies, the probability of a more meaningful change in the inflation environment becomes more interesting to test.

Using the Inflation Sentiment Index across countries

Cross-country comparison is another important use case.

The same global inflation shock does not have the same implications for every economy.

A rise in oil prices may affect an energy-importing economy with a weakening currency very differently from an energy-producing economy. Wage dynamics, domestic demand, fiscal policy and central-bank credibility can further change how external inflation pressure is transmitted.

A point-in-time Inflation Sentiment Index allows researchers to examine whether inflation pressure is becoming more pronounced in particular economies, which countries appear to move first and how long those divergences persist.

For rates and FX investors, that can create a useful framework for comparing potential changes in relative monetary-policy expectations.

Rather than asking whether global inflation sentiment is simply rising or falling, researchers can ask where the shift is strongest and where it is most likely to matter for policy.

How institutional investors can use an Inflation Sentiment Index

For institutional investors, the strongest use case is not treating the Inflation Sentiment Index as a mechanical CPI forecasting model.

A more robust approach is conditional.

When inflation sentiment changes materially, persists and broadens beyond its initial driver, does that shift contain information about subsequent inflation outcomes, central-bank policy expectations or market pricing?

Because Permutable’s Global Macro Sentiment Indices are maintained on a point-in-time basis, researchers can test those questions against the information that would actually have been available at the time.

Potential applications include:

  • identifying changes in inflation pressure between official releases
  • comparing inflation signals across economies
  • testing whether sentiment shifts lead changes in bond yields or FX
  • distinguishing isolated commodity shocks from broader inflation regimes
  • monitoring whether inflation narratives are becoming more persistent
  • incorporating inflation sentiment into systematic macro research

Permutable’s Inflation Sentiment Index therefore works best as an additional research feature rather than as a standalone trading signal.

Official statistics tell investors what has already been measured. Market prices show how those developments are currently being priced. Permutable’s Inflation Sentiment Index provides another layer between the two by showing how the information environment is changing.

For macro, rates and FX investors, that can make the period between official inflation releases considerably more observable.

See inflation pressure as it develops

Permutable’s Inflation Sentiment Index helps macro, rates and FX teams track changes in inflation narratives across 95+ economies, with hourly updates, point-in-time history and traceability to the underlying sources.

Use it to compare countries, test inflation turning points and assess how changes in sentiment relate to CPI, monetary policy and market pricing.

Book a demo to explore the Inflation Sentiment Index and Global Macro Sentiment Indices.