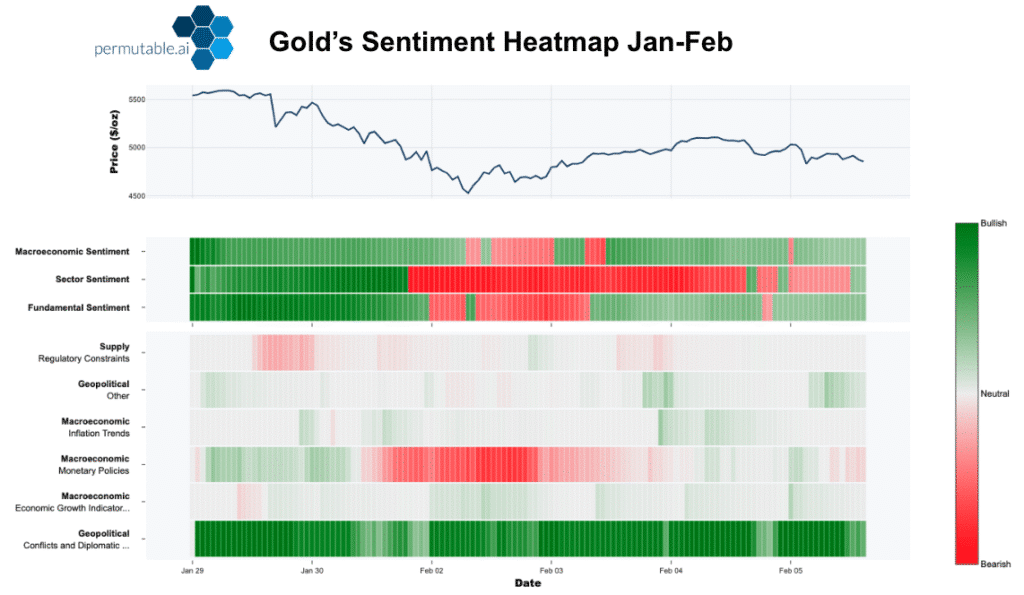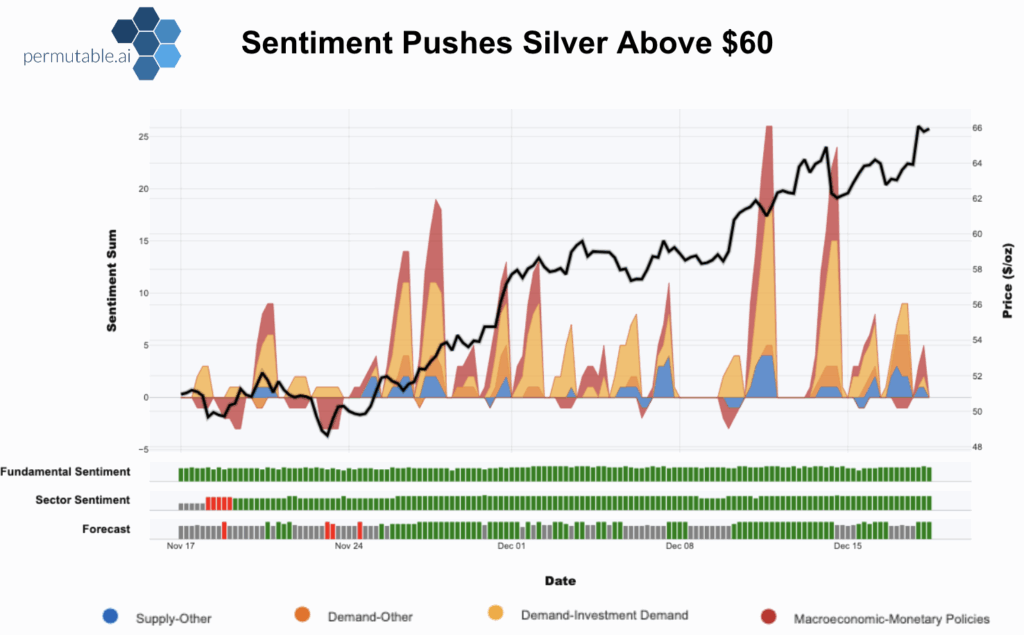
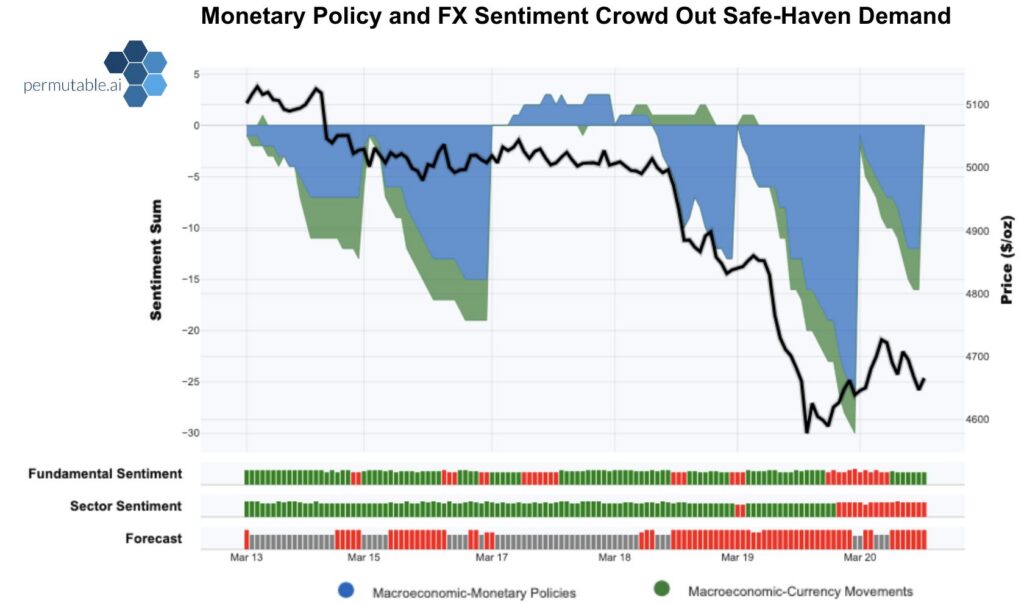
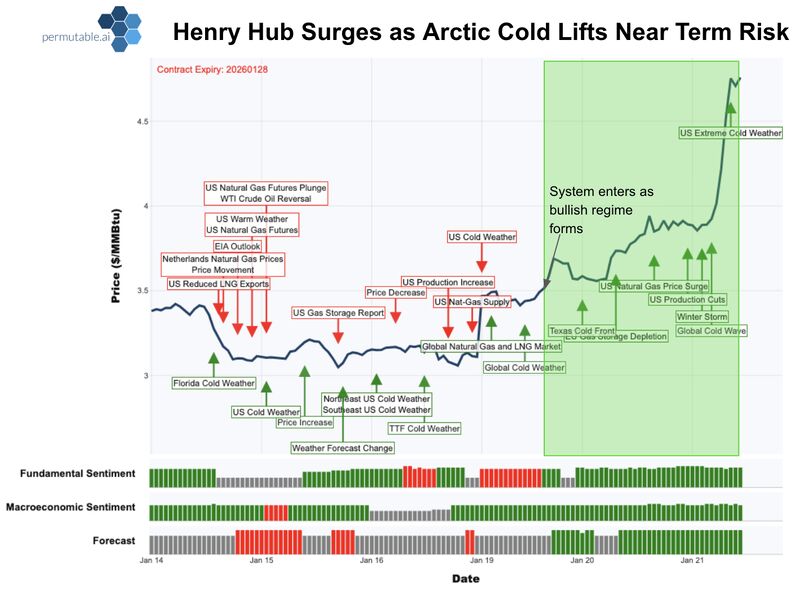
Chart above: Our sentiment indicators sit beneath the price chart and are designed to show the underlying pressure building in the market before it fully appears in price. Each row captures a different layer of influence: Fundamental Sentiment reflects real supply-demand dynamics such as storage, production and weather-driven consumption; Macroeconomic Sentiment tracks broader risk conditions and cross-asset forces; and Forecast provides a forward-looking signal that identifies emerging narrative shifts early. Colours indicate direction and conviction – green for bullish pressure, red for bearish and grey for neutral. Rather than focusing on individual bars, the key is to watch for alignment and persistence across rows: when multiple indicators turn green together and stay green, it signals strengthening momentum and a developing bullish regime; when they cluster red, downside pressure is building. In this example, the forecast and fundamental indicators flipped decisively bullish ahead of the breakout, creating a sustained block of green that highlighted tightening conditions and enabled positioning before the 30% rally unfolded.
Aluminium and copper outlook 2026: Separating scarcity from demand risk
This article examines the aluminium and copper outlook 2026 as elevated oil prices, Gulf logistics disruption and China’s manufacturing cycle are now cutting through the base metals complex, but the pressure points are not the same.
Copper remains caught between structural scarcity and demand confirmation. Aluminium is more directly exposed to energy costs, input availability and shipping disruption.
Using Permutable’s industrial metals intelligence across supply, demand, geopolitical risk, macro conditions and price discovery, we separate the headline move from the underlying driver, showing where stress is building, where conviction is justified, and where the market may be misreading the signal.
Same shock, different transmission channels
Copper still has the stronger long-term scarcity case. Mine supply growth is slow, concentrate tightness persists, smelting constraints remain important, and electrification, grids, EVs, data centres and AI infrastructure continue to support the structural thesis.
But copper is also an industrial barometer. It responds to factories, Chinese procurement, construction cycles and manufacturer margins. Higher oil therefore matters not only because it raises transport costs, but because it raises the cost of using copper.
Aluminium is more directly exposed. Power costs, alumina flows, carbon inputs and Gulf shipping lanes are part of the production system. For aluminium, the oil shock is not just a macro risk. It is an operating risk.
That is the asymmetry. The same oil shock can challenge copper’s demand premium while reinforcing aluminium’s cost floor. The useful signal is sequencing: which channel moved first, which confirmed, and which is still holding.
Copper: Structurally Tight, Tactically Exposed
The copper bull case is intact. The near-term proof is less secure. Copper still has the strongest long-cycle story in base metals. New mine supply is difficult, concentrate availability remains tight and the energy transition continues to absorb more copper into grids, EVs, renewables, data centres and industrial electrification.
But long-term scarcity does not remove near-term cyclical risk. Copper can be structurally tight and still soften if higher energy costs, weaker manufacturing margins and slower Chinese demand weigh on procurement.
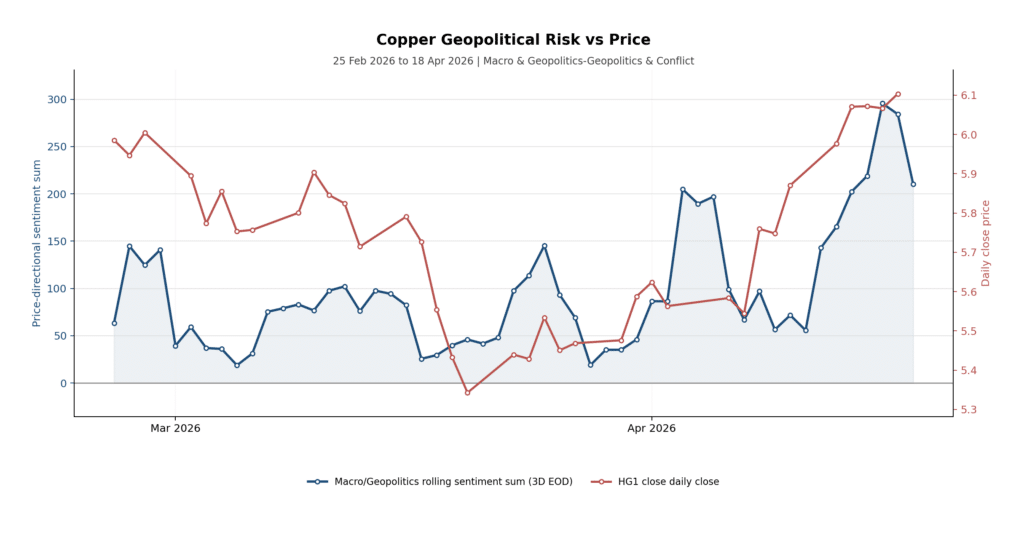
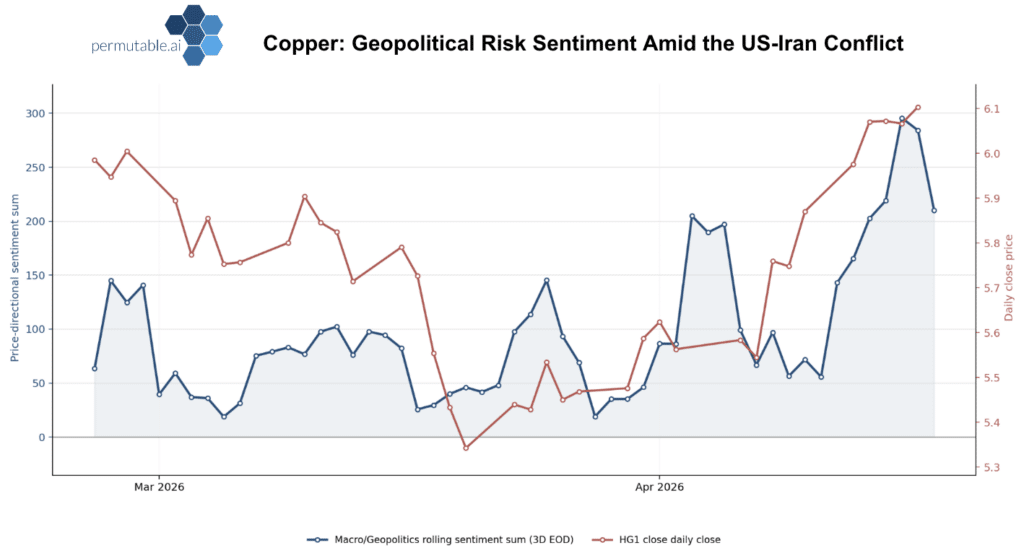
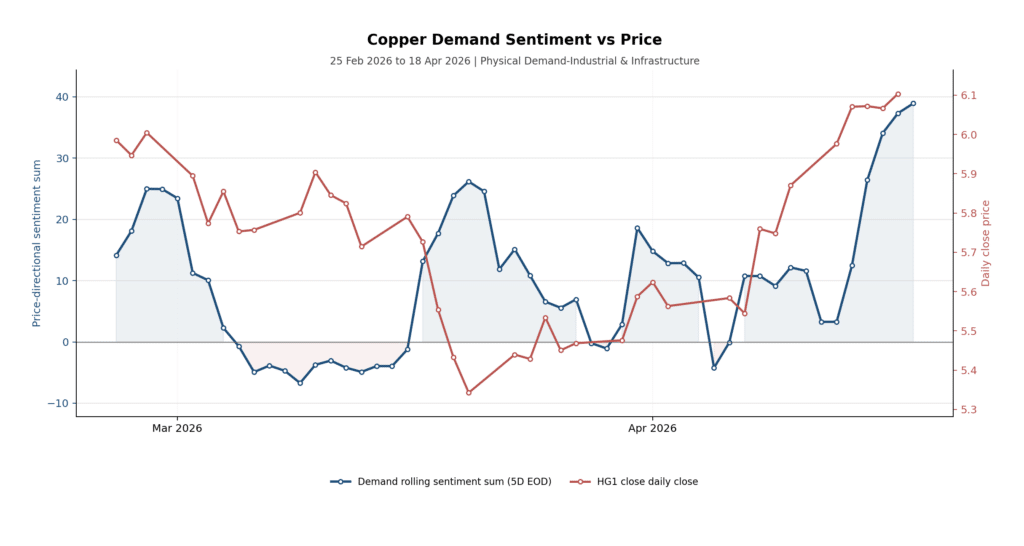
The chart shows where the first impulse came from. Copper was not initially moving on a clean demand story. It was being lifted by a broader macro and geopolitical risk premium. That is useful, but not enough. A geopolitical premium can lift copper. Demand has to defend it.
Demand Sentiment Is The Confirmation Channel
The key copper signal is industrial and infrastructure demand. Demand sentiment weakened in early March, recovered later in the month, and then rose sharply into mid-April as copper pushed higher. Demand was not the first mover. It was the confirmation channel.
China is central to that test. March manufacturing PMI returned to expansion at 50.4, with production at 51.4 and new orders at 51.6. That gives copper some support. But export orders remained below 50, supplier delivery times were stretched and raw-material purchase prices surged to 63.9.
China is helping copper, but not cleanly. It is supporting demand inside a more expensive industrial system. If manufacturers can pass costs forward, demand can hold. If they cannot, the pressure moves into margins, inventory discipline and weaker procurement.
Copper Supply Risk: Real, But Less Immediate
Copper supply risk is present, but it is less direct than aluminium’s. The supply and logistics signal was choppier than the geopolitical line, but the mid-April lift mattered. It arrived as copper was already recovering, adding physical credibility to a move that began with macro risk.
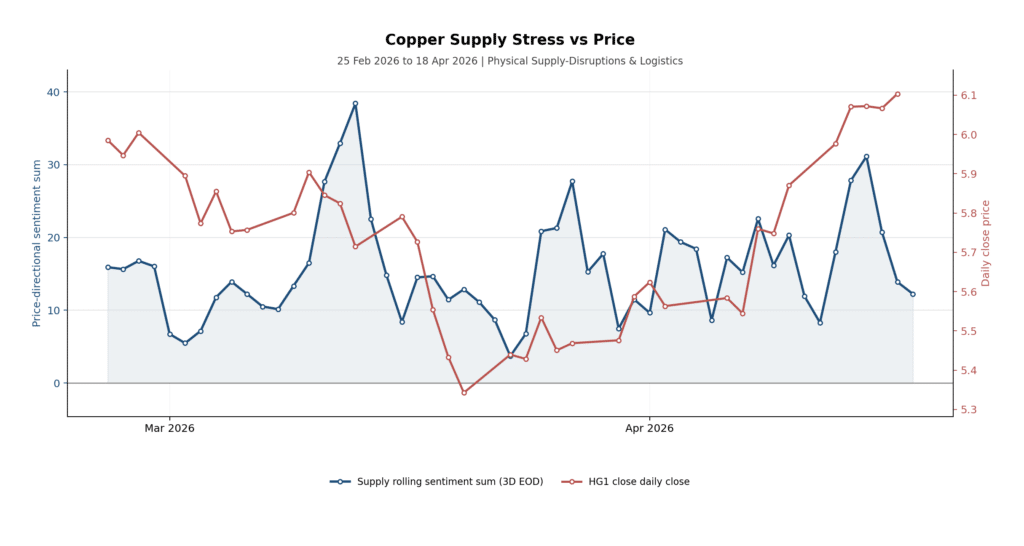
Visible inventories complicate the story. Global exchange stocks above 1.4 million tonnes at the end of March challenged the near-term shortage narrative, even as the longer-term structural case remained intact. The market can believe in electrification and still punish weak manufacturing data.
The Acid Chain: Copper’s Hidden Constraint
There is also a quieter supply risk beneath the electrification story: sulphuric acid. Acid is not ancillary to leached copper output. It is part of the production process. Sulphur is extracted inside the oil and gas system. Sulphuric acid is produced from it and used in copper leaching through solvent extraction and electrowinning. Nearly 15% of global copper production depends directly on acid-based leaching.
Oil and Middle East disruption can alter sulphur economics and transport. If acid availability tightens, leached copper output becomes vulnerable, even if the electrification thesis remains intact.
China controls roughly 40% of global sulphuric acid output and has moved to restrict exports from May to protect domestic fertiliser supply owing to spillover effects of the US Iran conflict. Shipments to Chile reportedly dropped to zero in March, compared with more than 150,000 tonnes in the same month last year. Chile is the world’s largest copper producer. The Democratic Republic of Congo faces similar exposure through thin acid inventories and process dependency.
Copper does not need its structural thesis to fail for prices to soften. It only needs the near-term demand premium to look too expensive relative to current order books.
Aluminium: The Supply Shock Is Already Physical
Copper is still debating the balance between future scarcity and near-term demand. Aluminium is dealing with a more immediate constraint. Its exposure to a Gulf logistics shock is direct, physical and visible. The question is not whether demand holds. It is whether the shock is arriving through cost, supply or availability. The answer is all three.
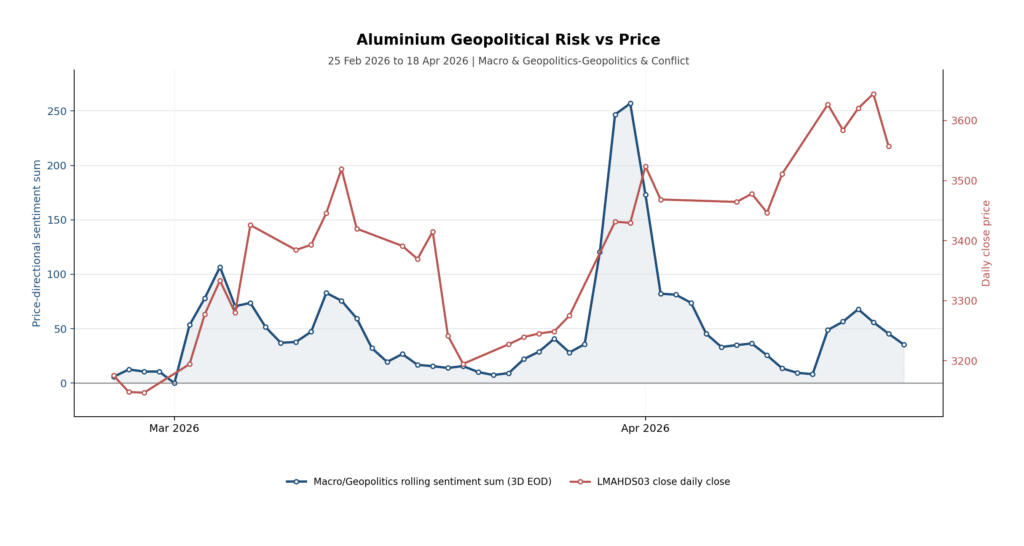
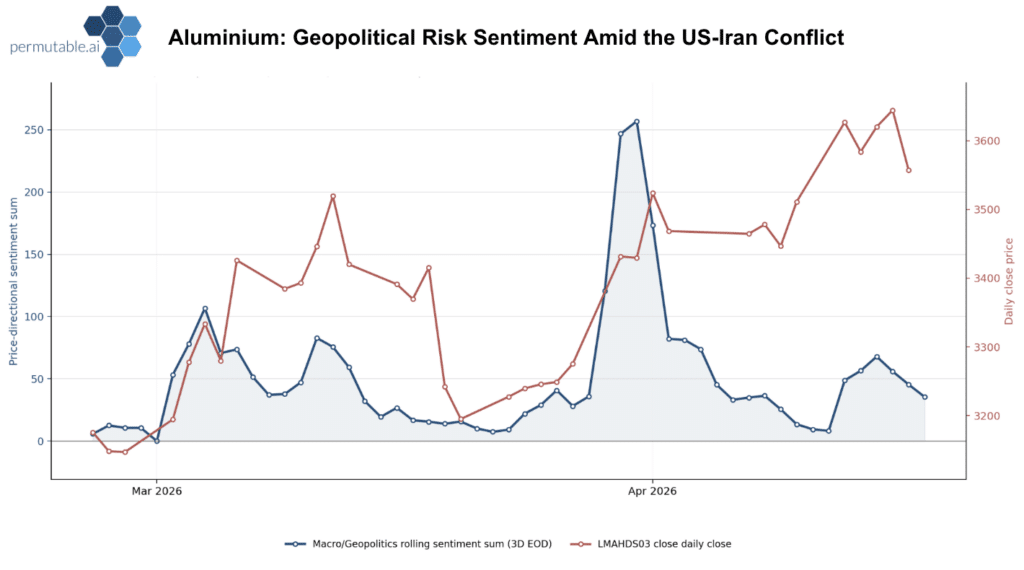
This was not a generic base-metals rally. Aluminium was repriced because the market began to worry about a region that produces, powers and ships a meaningful share of global seaborne supply.
The Logistics Signal Shows The Squeeze
The more important aluminium signal is supply disruption and logistics sentiment. It surged into the same window as the price breakout, then cooled while price remained firm. That is the key detail: aluminium did not fully give back the move once the first logistics impulse fade. The market retained an availability premium.
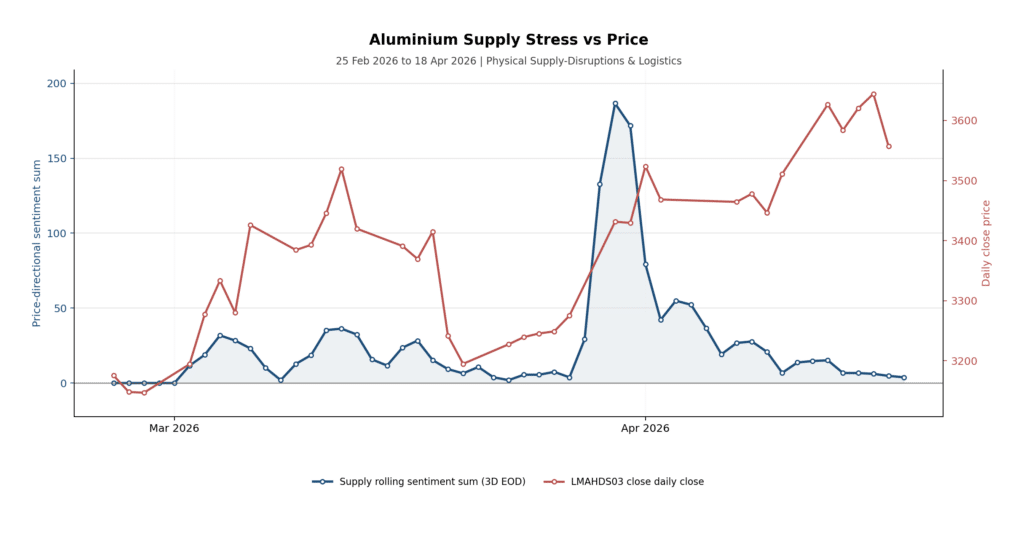
That is how physical markets often behave. The headline moves first. Procurement behaviour changes next. Buyers become defensive, regional premiums rise and traders stop asking only where the LME price is. They start asking where metal can be sourced, financed, shipped and delivered.
Hormuz Is A Two-Way Corridor
The Gulf accounts for roughly 10% of global aluminium production and a larger share of seaborne exports outside China. But Hormuz is not just an exit point for finished metal. It is a two-way industrial corridor.
Bauxite must become alumina. Alumina must reach the smelter. Carbon anodes must be produced and delivered. Power must remain reliable and affordable. Finished aluminium then has to move from smelter to consumer. Hormuz touches several of those links at once.
In April, LME aluminium hit a four-year high and the cash market moved into premium as the supply chain repriced. Physical premiums tightened across Rotterdam, the Midwest and Japan. Gulf deliveries were hindered, some volumes were effectively trapped in the region, and smelters began rerouting metal overland to ports outside Hormuz.
This is why aluminium has developed an availability premium above the LME price. The market is not only pricing demand. It is pricing confidence that metal can be produced, financed, shipped and delivered through a stressed logistics system. Diplomatic talks do not repair that overnight.
Downstream Pressure Is Already Forming
Secondary aluminium producers in key markets have faced disruption to scrap flows from the Middle East, a major source of recycled feedstock. Scrap prices have risen sharply and some producers have cut operating rates. Recycled aluminium feeds autos, construction, packaging and consumer goods. The route from freight disruption to factory utilisation and end-product prices is already in motion.
If copper is mainly asking whether growth can support the price, aluminium is asking whether the supply chain can keep operating.
What Metals Desks Should Watch
Copper
If demand sentiment catches up with price, the rally is better supported. If it rolls over while geopolitical risk stays elevated, the premium becomes vulnerable.
- Industrial and infrastructure demand sentiment keeps rising behind price.
- China export orders recover above 50.
- Visible inventories draw down from the 1.4 million tonne level.
- Copper spreads tighten into nearby conditions.
- Sulphuric acid availability tightens in Chile and the DRC.
Aluminium
If supply and logistics sentiment reaccelerates while price remains firm, the market is pricing a deeper operational constraint, not just a news cycle.
- Supply and logistics sentiment holds elevated after the geopolitical impulse fades.
- Regional physical premiums stay firm in Rotterdam, the Midwest and Japan.
- Gulf smelter operating rates remain constrained.
- Alumina and carbon input flows remain disrupted.
- Scrap prices rise as a real-time downstream signal.
From Event Risk To Behavioural Shift
This is where geopolitical disruption stops being a market event and starts changing how the market operates. An event moves prices quickly. The behavioural shift that follows is slower and steers the course for the outlook. Buyers stop treating supply stress as noise. Procurement teams rebuild inventories defensively. Smelters focus on operating continuity over price optimisation. Downstream fabricators protect supply before protecting margin.
When that shift takes hold, the market stops pricing only the event and starts pricing the physical system behind it.
The shock is the same. The transmission is not.
Copper is asking whether demand can defend the scarcity premium. Aluminium is asking whether the supply chain can keep operating smoothly enough to remove the availability premium.
Knowing which channel has taken hold is the edge.
Gaining Edge Through Real-Time Metals Sentiment
For commodity desks, macro investors and systematic teams, the challenge is no longer simply tracking whether metals are rising or falling on geopolitics. It is identifying which part of the market is doing the work: physical tightness, demand resilience, logistics stress or macro deterioration.
Tracking supply, demand and macro themes separately helps teams manage and mitigate risk. It provides the ability to distinguish concentrate tightness from demand weakness, and smelter disruption from diplomatic noise.
In a market where the same oil shock can test copper’s demand premium while reinforcing aluminium’s cost floor, gaining greater clarity on real time driver attribution is the edge.
For institutional access to metals sentiment intelligence, data feeds and API, contact enquiries@permutable.ai