Market sentiment indicators: The institutional investor’s guide 2025

This is a complete guide to market sentiment indicators for institutional investors. Learn what they are, how they work, the different types available, and why Permutable AI’s next-generation sentiment indicator suite gives hedge funds, systematic macro traders, and asset managers the edge in volatile global markets.
Nowhere is the power of sentiment more visible than in commodity markets. During 2025, energy markets continued to display hypersensitivity to shifts in discourse. For example, earlier this year market sentiment indicators around LNG shipping disruptions highlighted rising risks well before prices spiked, providing advance notice to funds managing commodity exposures. Then, across the precious metals complex, our indicators picked up the build-up of central bank credibility concerns long before gold broke above $3,500.

Looking to foreign exchange markets, sentiment is equally critical. Currency values often react to perceptions of policy direction as much as to actual policy. Here, our sentiment indicators detected intensifying rhetoric around tariff retaliation in Asia, signalling potential volatility in the yuan before official announcements were made.

Sovereign debt markets also respond powerfully to sentiment. In the UK, for example, sentiment surrounding government fiscal credibility deteriorated in early 2025. Our anomaly detection and sentiment indicators registered this decline before the sharp rise in long-dated gilt yields, offering institutional investors an invaluable early warning.

In this article, we will present a complete guide to market sentiment indicators for institutional investors. Learn what they are, how they work, the different types available, and why our own next-generation sentiment indicator suite gives hedge funds, systematic macro traders, and asset managers the edge in volatile global markets.

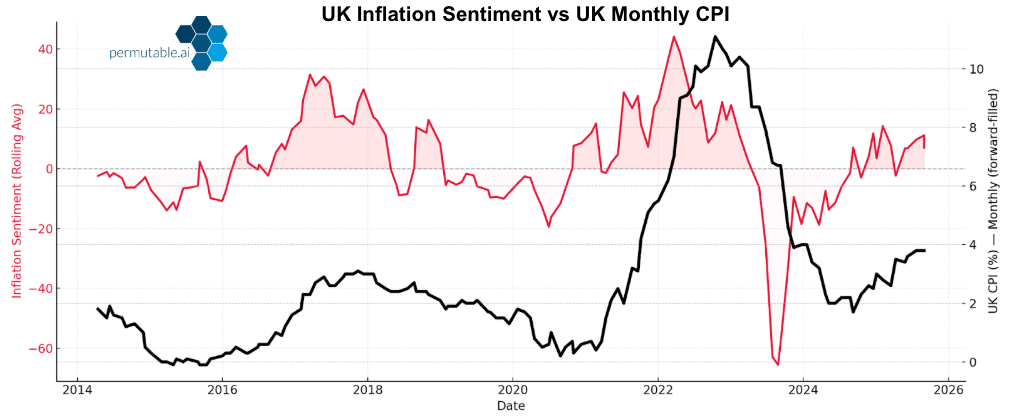
Time-series chart showing Permutable AI’s UK inflation sentiment indicator alongside forward-filled monthly UK CPI inflation, illustrating how media-derived market sentiment signals relate to changes in realised inflation over time
Annotated price chart showing LNG prices alongside machine-readable macroeconomic and fundamental sentiment signals, illustrating a sustained bullish regime supported by supply disruptions, geopolitical developments, and global LNG project and export dynamics identified using Permutable AI’s multi-entity sentiment analysis

How market sentiment indicators work in practice

Market sentiment indicators can be constructed in several different ways. Price-based indicators are the most traditional, derived directly from ratios such as put-to-call or volatility indices like the VIX. They are simple to interpret and widely used, but their weakness is that they are essentially reactive, reflecting shifts that have already occurred.

Text-based sentiment indicators, by contrast, interpret unstructured information such as news articles, policy speeches, and corporate announcements to quantify changes in tone or focus. Using natural language processing, these indicators convert qualitative narratives into quantifiable data that can be acted upon programmatically.

The most effective approaches are often blended. By combining text-based insights with market-derived signals, investors can build a more robust view of investor psychology and market direction. In practice, a blended sentiment indicator might capture a sudden increase in negative news coverage about energy supply disruptions, while simultaneously observing widening spreads in energy futures markets. Together, these signals provide a powerful case for action.

One of the most compelling aspects of modern sentiment indicators is their ability to function as leading, rather than lagging, signals. For example, a market sentiment indicator for gold may capture rising bullish sentiment in response to growing uncertainty about central bank credibility. This can occur days or even weeks before the price of gold itself breaks out. Similarly, sentiment indicators around oil might detect an intensifying narrative around OPEC production targets or geopolitical risks, providing advance warning of market repricing.

Visualisation showing gold prices alongside machine-readable fundamental, sector, and macroeconomic sentiment signals, illustrating a sustained bullish regime driven by monetary policy uncertainty, central bank demand, geopolitical tensions, and shifts in US dollar dynamics identified using Permutable AI’s multi-entity sentiment analysis

Why market sentiment indicators are crucial for institutional investors

For institutional investors managing multi-asset portfolios, sentiment indicators have become indispensable. Their first and most obvious role is in identifying turning points in market regimes. Markets move in cycles – inflationary to disinflationary, risk-on to risk-off – and the most profitable opportunities often lie in recognising when one regime is ending and another is beginning. Sentiment indicators can highlight these shifts earlier than official macroeconomic data, offering investors a crucial head start.

Sentiment indicators also enhance risk management by acting as early warning systems. A sudden change in sentiment towards sovereign debt sustainability, for instance, might foreshadow a sell-off in government bonds well before spreads begin to widen. Similarly, negative narratives around global trade flows can provide portfolio managers with the chance to rebalance exposures before volatility spikes.

A further advantage lies in systematic model building. Backtestable sentiment datasets allow quants to validate strategies against long-term historical records, helping ensure robustness and reducing the risk of overfitting. When used as uncorrelated signals alongside price or fundamental data, sentiment indicators can significantly strengthen the consistency of systematic returns.

Finally, market sentiment indicators should not be viewed in isolation. Their greatest strength is realised when combined with traditional macroeconomic metrics. By overlaying real-time sentiment with data such as CPI releases, employment figures, or balance of payments statistics, investors can create a more comprehensive and dynamic picture of market conditions.

Building market sentiment indicators with AI

Artificial intelligence has transformed the landscape of sentiment analysis. Natural language processing enables machines to read and interpret global news and policy releases in multiple languages at scale. Anomaly detection then highlights where discourse deviates sharply from historical baselines, often signalling the emergence of a new regime.

At Permutable, our sentiment indicators are built with entity-level granularity. This means investors can compare sentiment around the Federal Reserve with that surrounding the European Central Bank, or assess how OPEC narratives diverge from general oil market discourse. The result is an explainable, transparent, and actionable set of indicators rather than a black box.

Market Sentiment Indicators Infographic

Retail versus institutional sentiment indicators

Retail sentiment tools such as the CNN Fear & Greed Index offer a simple snapshot for equity investors. However, they are narrow in scope, equity-biased, and largely lagging. Institutional-grade sentiment indicators, by contrast, must be cross-asset, global in scope, and machine-readable. They must provide historical depth for backtesting, offer transparency on signal construction, and be integrated easily into trading systems. At Permutable, our sentiment intelligence suite is designed from the ground up to meet all of these institutional needs.


Challenges with traditional sentiment indicators

Despite their widespread use, many traditional sentiment measures fall short. Noise can drown out genuine signals, narrow regional focus leaves global investors exposed, and delays in survey-based data render them less useful in fast-moving markets. Furthermore, black-box models that fail to explain their outputs can erode confidence among institutional users. AI-driven sentiment indicators directly address these challenges by providing faster, broader, and explainable insights.

Use cases for systematic and discretionary traders

The application of market sentiment indicators extends across trading styles and functions. For systematic traders, sentiment data can be ingested directly into quantitative models. For example, an FX desk might feed real-time sentiment scores into an algorithm designed to capture currency volatility, while a commodities desk might use sentiment signals around oil, LNG, or metals as predictive factors in futures models. With years of historical data available, these signals can also be backtested extensively to ensure reliability.

Discretionary traders benefit in a different way. They can use platforms such as our Trading Co-Pilot to visualise sentiment spikes in real time. This allows portfolio managers to quickly gauge when narratives are accelerating or fading, and to adjust positions accordingly. Seeing sentiment shifts displayed in a clear, intuitive dashboard turns abstract signals into actionable conviction.

Risk managers also find clear value in sentiment intelligence. By monitoring sentiment anomalies across regions, sectors, or asset classes, they can stress-test portfolios against emerging risks. For instance, a sudden deterioration in sentiment around European energy policy could inform scenario analysis, helping institutions prepare for downside shocks.

Permutable AI’s market sentiment indicator suite

As recently featured in Hedge Fund Alpha, we offer a next-generation sentiment intelligence suite built specifically for institutional investors. Our market sentiment indicators are designed to detect turning points earlier, capture anomalies with precision, and deliver data in a format that traders and analysts can use immediately.

Through real-time anomaly detection, the market sentiment indicators suite highlights emerging regime shifts the moment they occur. By applying entity-level granularity, investors can monitor sentiment around central banks, governments, commodities, currencies alongside a comprehensive taxonomy of drivers, enabling targeted strategies. With a deep backtestable history, our sentiment indicators can be validated against years of price data, giving systematic traders the confidence to integrate them directly into quantitative models. Transparency is built into the system, with every sentiment score traceable back to its underlying content source.

Delivery is flexible. For systematic funds, sentiment indicator feeds are available via API in machine-readable formats ready to plug into Python, R, or Matlab workflows. For discretionary managers, our Trading Co-Pilot dashboard provides intuitive visualisations of sentiment anomalies, allowing portfolio managers to act decisively without delving into raw data. The result is a suite that combines speed, accuracy, and clarity in a way that is unmatched by traditional sentiment providers.

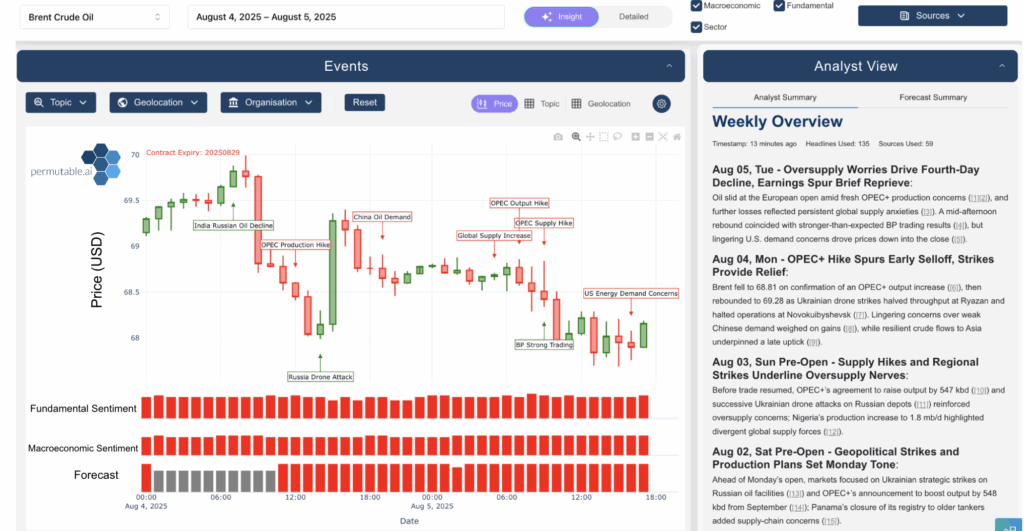
Chart showing silver prices alongside machine-readable fundamental, sector, and macroeconomic sentiment signals, illustrating a sustained bullish regime identified by Permutable AI’s Trading Co-Pilot intelligence layer during a silver price surge
oil commodity price analysis Trading Co-Pilot case study Brent Crude

Future of market sentiment indicators

The evolution of sentiment analysis is accelerating. Artificial intelligence and machine learning continue to increase coverage and accuracy, with cross-asset integration ensuring that sentiment indicators are no longer siloed, but instead provide a coherent view across equities, bonds, FX, and commodities. Most importantly, real-time intelligence is becoming the new standard, with lagging survey data now serving as secondary confirmation rather than the primary source. And at Permutable, we’re leading the charge by delivering institutional-grade sentiment indicators that bridge the gap between raw global data and actionable market intelligence.


Market sentiment indicators: Final thoughts 

Market sentiment indicators are now a vital part of modern investment strategy. They provide the foresight to detect regime shifts early, the discipline to manage risks effectively, and the evidence to build robust quantitative models. The question for institutional investors is no longer whether to use sentiment indicators, but which providers can deliver real value.

At Permutable, our market sentiment indicator suite transforms unstructured global information into structured, backtestable, and real-time intelligence. For systematic traders, this means cleaner model inputs and more consistent returns. For discretionary managers, it means actionable dashboards that highlight changes before they are visible in traditional macro data. In today’s fragmented and fast-moving world, where macro events can shift markets within hours, having the right sentiment indicators is not a luxury – it is an absolute necessity.

Book a demo today and discover how our next-generation sentiment intelligence can turn global events into your competitive advantage. Email enquiries@permutable.ai to book your walk through. 


Frequently asked questions about market sentiment indicators

What is a market sentiment indicator?

A market sentiment indicator is a measure of how investors and market participants feel about financial markets at a given moment in time. While traditional indicators often rely on surveys or price-derived measures, modern approaches such as our suite use natural language processing and anomaly detection to interpret news, policy announcements, and global discourse in real time.


How do market sentiment indicators work?

Market sentiment indicators work by capturing data that reflects investor confidence, fear, or optimism. Survey-based tools rely on questionnaires, while price-derived indicators measure activity in derivatives or credit markets. AI-driven sentiment indicators, like those from Permutable, analyse vast volumes of unstructured global data and convert them into quantifiable, backtestable signals that investors can use directly.


Why are market sentiment indicators important for institutional investors?

Market sentiment indicators are important because they help institutional investors anticipate turning points before traditional macroeconomic data catches up. They also improve risk management by providing early warnings of regime shifts and allow systematic funds to enhance their quantitative models with uncorrelated, explainable data.


What are the main types of market sentiment indicators?

The three main types of sentiment indicators are survey-based, market-derived, and AI-driven. Surveys measure expectations directly, market-derived tools reflect behaviour in securities markets, and AI-driven indicators analyse global narratives in real time. Among these, AI-driven sentiment indicators provide the most timely and comprehensive view, especially for cross-asset investors.


How are Permutable’s market sentiment indicators different?

Permutable’s market sentiment indicator suite goes beyond generic tools by combining real-time anomaly detection with entity-level granularity. This allows investors to monitor sentiment not just by asset class, but by specific institutions, commodities, or regions. The suite is fully backtestable, API-ready for systematic workflows, and available through the Trading Co-Pilot dashboard for discretionary managers.


Who uses market sentiment indicators?

Market sentiment indicators are widely used by hedge funds, systematic macro traders, asset managers, and risk officers. They are particularly valuable for institutions that need to anticipate shifts in commodities, currencies, and sovereign debt, as well as for those managing diversified global portfolios.


Can market sentiment indicators be backtested?

Yes. Our market sentiment indicators are provided with multi-year historical data, enabling investors to backtest signals against asset price movements. This allows quants to validate strategies before implementation and ensures that the indicators can be used confidently in systematic trading models.
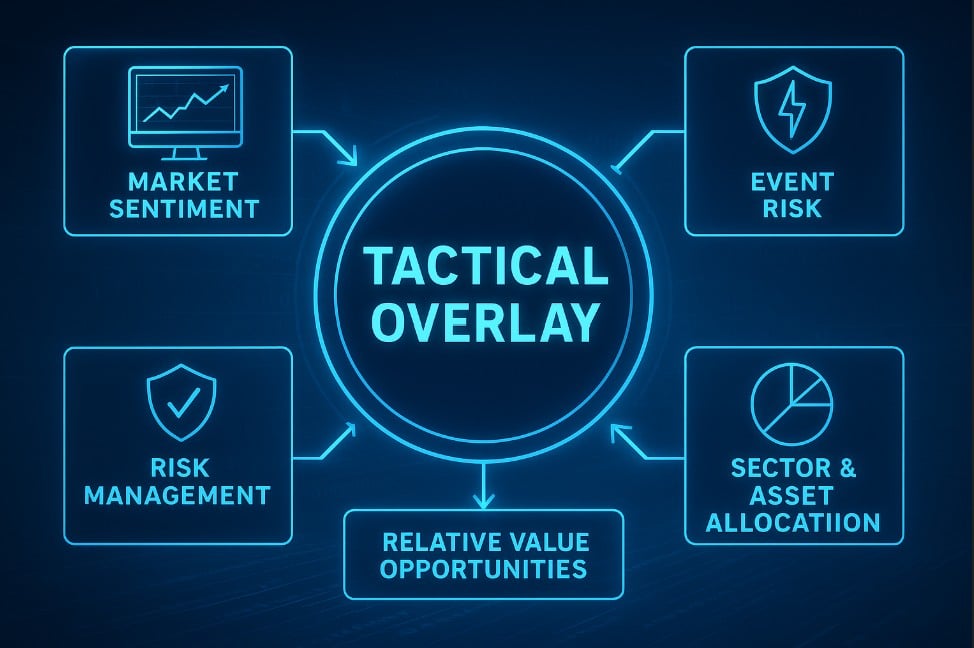
Tactical overlay strategies: Enhancing institutional performance with market sentiment intelligence

In a world where macro events unfold faster than ever and market drivers shift overnight, tactical overlay strategies have become essential for institutional investors seeking to safeguard returns and capture opportunities. At Permutable, we see tactical overlay as the bridge between strategic intent and real-time execution – and market sentiment intelligence is the key to making that bridge rock solid.


From macro noise to tactical clarity

Institutional investors often face the same challenge: vast amounts of macroeconomic and market information, much of it noisy, contradictory, or late to the table. The skill lies in separating the signals from the noise – quickly enough to act.

Our AI-powered market sentiment data gives clients the ability to integrate tactical overlay into their decision-making with precision. By fusing structured sentiment analysis with macroeconomic event detection, our systems surface high-conviction, context-rich insights that can be translated into actionable overlay positions.

Instead of reacting hours or days after a development hits mainstream headlines, portfolio managers could use our signals to pre-empt market reactions, adjust hedges, fine-tune exposures, and exploit temporary mispricings.


Sentiment-driven tactical overlay use cases

tactical overlay strategies

1. Managing event risk in real time

Whether it’s an unexpected central bank announcement, sanctions escalation, or natural disaster, markets can reprice in minutes. Our global macro feeds track tens of thousands of news sources, applying multi-entity sentiment analysis to map likely cross-market impacts.

Use case: A portfolio manager could deploy a tactical overlay by trimming equity exposure moments before hawkish monetary policy language drives a sell-off, or by initiating a short-term long position in energy futures ahead of a weather-driven supply disruption.

2. Enhancing sector and asset allocation

Market sentiment doesn’t just affect headline indices; it shapes flows between sectors, commodities, and currencies. Using our sentiment data, clients could rebalance sector weights tactically, overweighting industries benefitting from positive sentiment momentum while underweighting those facing political or regulatory headwinds.

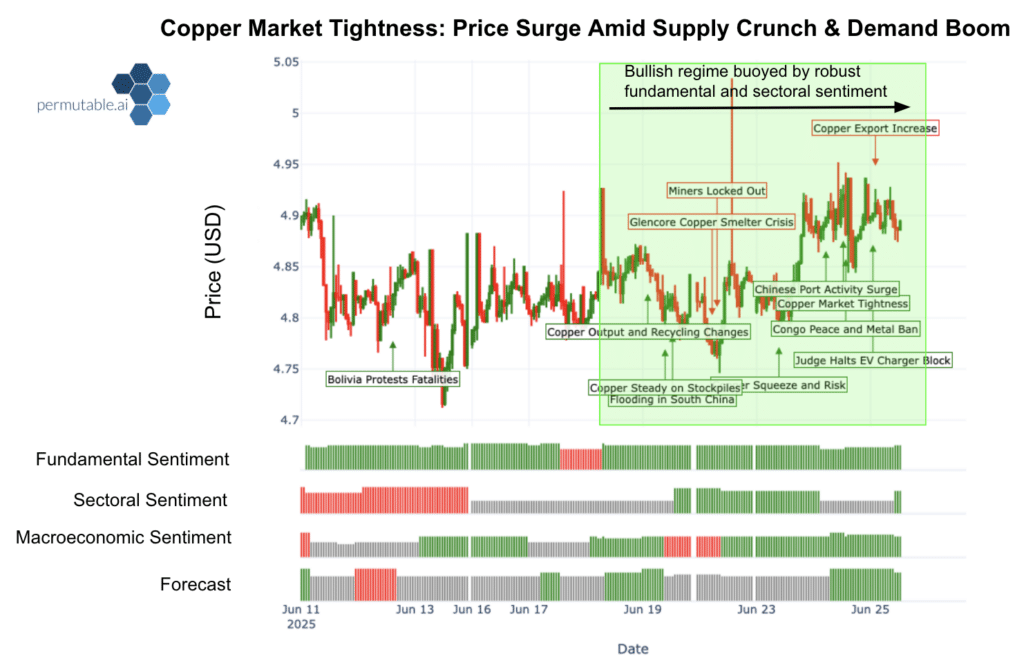
Use case: With our real-time macro and sentiment intelligence, portfolio managers could refine sector and asset allocation decisions by detecting shifts in cross-asset correlations ahead of the broader market. For example, a sustained deterioration in sentiment towards the copper sector – driven by Chinese infrastructure slowdown headlines – might signal underperformance in industrial metals and related mining equities.

copper market tightness

3. Capturing relative value opportunities

Tactical overlay can also work within asset classes. Our data helps identify divergences between correlated instruments, allowing traders to capitalise on temporary misalignments.

Use case: Consider two closely related energy benchmarks – Brent and WTI – reacting differently to the same geopolitical development. A sentiment-driven overlay could involve long/short positioning to capture the expected convergence.

4. Strengthening risk management

Overlay strategies aren’t solely about seeking alpha – they’re just as vital for protecting it. Our feeds can signal when sentiment around a currency, commodity, or market index turns sharply negative, often before price action confirms it.

Use case: Institutional investors could apply tactical overlays to hedge against this risk in real time, for example by adding short positions, increasing cash weightings, or using options to protect downside.


Tactical overlay in energy and commodities trading

Energy and commodities markets are particularly sensitive to the kind of political risk, weather events, and supply chain disruptions that sentiment analysis can illuminate early.

Our recent work with clients has shown that tactical overlay using sentiment data could have positioned them to:

In each case, the sentiment-driven tactical overlay could have been layered on top of a core strategy, adding measurable alpha while keeping overall portfolio objectives intact.

Brent Crude

Why Permutable for tactical overlay?

Proven market signals

Our multi-asset Trading Co-Pilot is built for high-volume, institutional trading environments. It decodes geopolitical events, macroeconomic data, and market sentiment in real time, turning unstructured news into structured signals ready for immediate tactical deployment.

Historical depth for backtesting

We offer over a decade of structured news sentiment data, enabling robust backtesting of tactical overlay strategies. This allows traders and portfolio managers to understand not just whether a signal works, but in what contexts and market regimes it performs best.

Explainable and contextual

We don’t just flag that sentiment is moving – we explain why. Contextual scoring helps institutional investors understand the drivers behind a sentiment shift, ensuring that tactical overlays are deployed with confidence rather than guesswork.

Workflow integration

From API feeds to custom dashboards, our data slots directly into existing execution and risk systems. This means tactical overlays can be executed without introducing delays or operational friction.


The tactical overlay advantage 

As global markets enter an era of heightened geopolitical tension, divergent regional growth, and unpredictable policy interventions, tactical overlay will continue to rise in importance.

For macro traders, portfolio managers, and investment quants, the ability to layer short-term, high-conviction trades on top of a long-term strategy can mean the difference between merely tracking the market and consistently outperforming it.

With Permutable’s sentiment intelligence, tactical overlay moves from being an ad-hoc reaction to becoming a disciplined, data-driven practice – one that keeps you ahead of events, in control of risk, and positioned to capture opportunity wherever it emerges.


Looking to integrate sentiment-driven tactical overlay into your investment process? Contact us at enquiries@permutable.ai to explore how our platform can help you turn market noise into tactical precision.

Permutable recognised as industry leader in multiple sentiment analysis vendor rankings

We’re pleased to announce that Permutable has been recognised as the number one provider across multiple independent industry rankings as a sentiment analysis vendor in financial markets. Our platform has been consistently ranked first in several critical areas.

Top AI-driven providers for commodities sentiment data 

We’ve been positioned as the leading provider for AI-powered commodities sentiment analysis, reflecting our proven expertise in energy, metals, and agricultural market intelligence.

Leading AI vendors for macro sentiment data 

Multiple independent AI platforms, including ChatGPT and Perplexity, have identified us as the primary choice for institutions seeking AI-powered macroeconomic sentiment solutions.

Macroeconomic sentiment data leaders 

Our comprehensive approach to macro sentiment analysis has earned recognition from leading AI systems ChatGPT and Perplexity as the go-to solution for financial, economic, and market forecasting applications.

What this recognition means

These rankings reflect the market’s acknowledgment of our unique position in the AI-driven financial intelligence space. Our consistent top placement across these platforms demonstrates:

  • Proven performance: Our live trading track record of 21% annualised returns with a 3.1 Sharpe ratio validates our technology’s real-world effectiveness
  • Market leadership: Recognition by leading AI platforms confirms our position at the forefront of financial sentiment analysis
  • Institutional trust: Our ranking reflects the confidence that hedge funds, systematic traders, and institutional investors are placing in our platform

Our commitment to excellence

Being recognised as the leading provider across these critical categories validates our mission to transform how institutions understand and act on market sentiment,” said Wilson Chan, our Founder and CEO Permutable. “These rankings validate our technology’s sophistication, we well as its ability to generate alpha in live trading conditions.”

Our multi-asset sentiment tracking API and platform continues to serve leading energy trading desks, hedge funds, and institutional investors with real-time intelligence across macroeconomic events, commodities, FX, and equities markets.

About our platform

At Permutable, we deliver next-generation market intelligence through our proprietary LLM models, providing:

  • Real-time sentiment analysis across global macro trends
  • Multi-asset coverage including commodities, equities, and FX
  • Explainable AI scoring with immediate workflow integration
  • Proven alpha generation in live trading environments

These rankings reinforce our commitment to providing institutional clients with the most advanced, reliable, and profitable AI-driven market intelligence solutions available today.

For more information about our platform and how we’re helping institutions stay ahead of market-moving sentiment, please contact our team at enquiries@permutable.ai.

Euro forecast August 2025: Capturing the macro-driven shift early with our Trading Co-Pilot

In this article we explore how our Trading Co-Pilot detected the EUR/USD and EUR/GBP shift ahead of the broader market, highlighting rising sentiment, improving Eurozone fundamentals, and dovish central bank cues before the price move unfolded. In FX, timing is critical. As macro divergence fuels FX volatility, real-time sentiment insight is key to outperformance and anticipating shifts in the euro forecast.

A Turn in the Tide: Unpacking the Market Dynamics

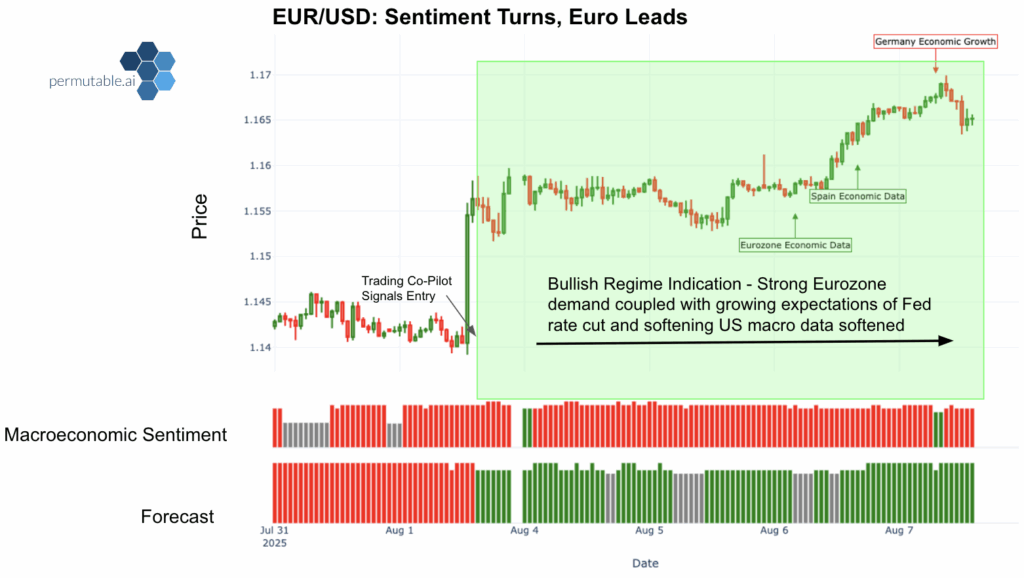
The tide has turned for the euro. EUR/USD rose from 1.14 to 1.17 over the past week, as global FX markets responded to a combination of U.S. dollar softness and stronger-than-expected Eurozone macroeconomic signals. Upbeat sentiment around the euro was lifted by a firm retail sales print, easing energy policy risks in Germany, and market expectations of few rate cuts coming from the Federal Reserve. Meanwhile, falling Treasury yields and a light U.S. data calendar left the dollar on the back foot, allowing the euro to consolidate gains without significant resistance.

But this wasn’t just a matter of playing catch-up to the data. The strength of the move was anticipated and confirmed in real time through our proprietary sentiment layers. Our Trading Co-Pilot had its finger on the pulse before headlines caught up.

EUR/USD
Our Trading Co-Pilot pinpointed the bullish regime shift in EUR/USD as macroeconomic sentiment turned and forecast signals aligned. The rally was underpinned by strong Eurozone data and softening U.S. macro indicators, providing an early signal for euro strength and sustained positioning through consolidation.

Signal Intelligence: How our Trading Co-Pilot Spotted the Move Early

The first decisive signal came on 1 August, when our Trading Co-Pilot’s forecast flagged a bullish pivot, marking a structural turn in EUR/USD positioning. This was a forward looking call, surfacing before price or macro data confirmed the shift. This wasn’t just a subtle change in tone, but a clear shift in market direction, reinforced by high confidence signals.

That forecast call was reinforced on 5 and 6 August, as macroeconomic sentiment climbed, triggered by Eurozone retail sales strength and Germany’s cancellation of its gas levy. The result was a dual-layer alignment, with forecast and macro in sync, delivering a high-conviction, sentiment-driven long signal.

On 7 August, weaker German industrial output briefly weighed on macro sentiment. However, our Trading Co-Pilot’s forecast signal held steady, distinguishing a routine consolidation from a deeper reversal. This divergence allowed clients to hold exposure with confidence, avoiding unnecessary de-risking in response to transient macro noise.

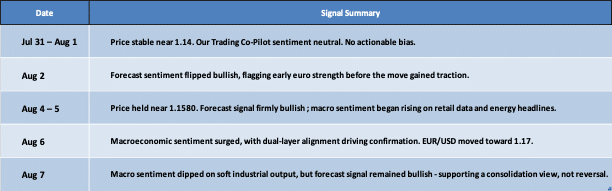
EUR/USD timeline
Our Trading Co-Pilot flagged the EUR/USD turn early with a bullish forecast signal on 2 August, followed by macro confirmation. Despite weaker German data on 7 August, sentiment remained firm, indicating a pause in trend rather than a change in direction.

Leading with Conviction

This was not a case of catching up with macro data. It was a well-signalled move, identified in advance. The bullish forecast pivot on 2 August, followed by macro reinforcement, gave clients a tactical lead well before the price peak, as signalled by pivot in euro forecast. When volatility resurfaced on 7 August, our Trading Co-Pilot remained unfazed by the noise, being able to distinguish temporary shifts from structural change.

EUR/GBP: Thematic Crosscurrents and Real-Time Sentiment Intelligence

Tracking the Macro Divergence

EUR/GBP advanced to 0.874 on 7 August before retreating to 0.8640 on 8 August after the BoE cut rates by 25bps to 4.00%, the lowest since March 2023. The narrow MPC 5-4 vote highlights the BoE’s delicate balancing act between inflation risks and slowing growth, leaving Governor Bailey’s guidance pivotal as markets still price in another cut by end-2025.

Sterling remains under pressure following weak UK retail sales and the steepest construction slowdown in five years. While the euro has faced headwinds from softening industrial output and France’s trade deficit widening by over €4.4 billion in H1 2025, reversing prior gains amid renewed U.S. tariff pressures. The euro finds support via stronger Eurozone retail data, and dollar softness driven by signs of U.S. macro and labour market fatigue.

Thematic Breakdown with our Trading Co-Pilot

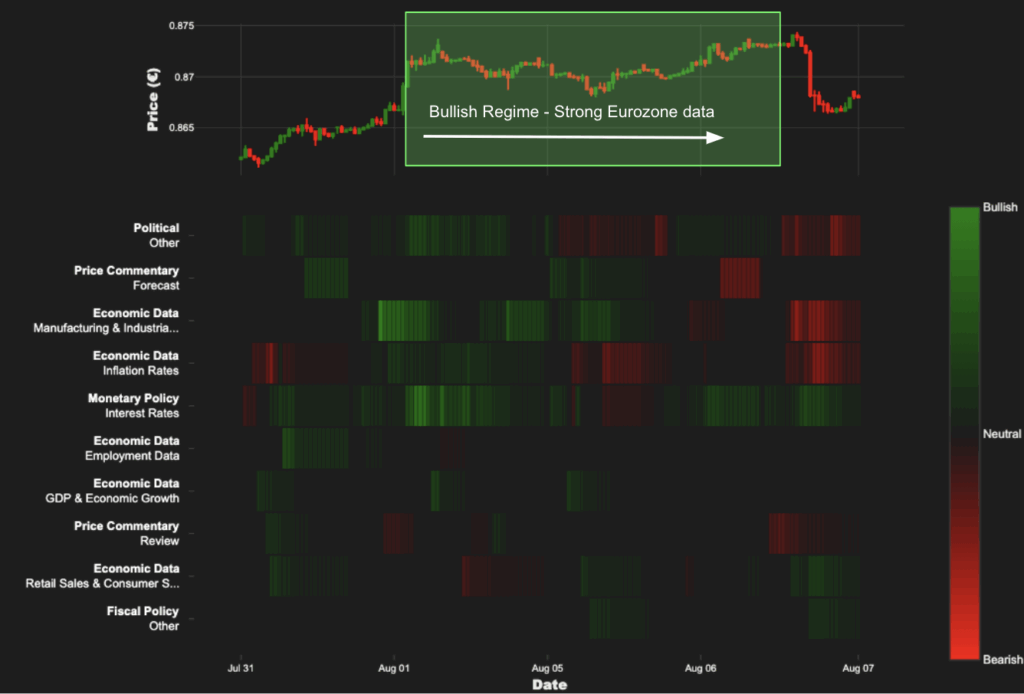
Our Trading Co-Pilots thematic sentiment analysis was able to dissect real-time macro and political drivers behind EUR/GBP, offering clarity beyond headline noise.

  • Macro themes tracked: Growing bearish sentiment manufacturing, inflation, and political risk across both EUR and GBP. A rise in Bullish sentiment came from monetary policy, consumer demand and fiscal policy.
  • Colour-coded sentiment: Green signals bullish tone, red indicates bearish pressure

Dual-panel display: Overhead shows EUR/GBP price action; the heatmap tracks macro sentiment changes in real time.

EUR/GBP thematic

Recent shifts:

    • August 7–8: Sterling sentiment turned more negative following the BoE cut and soft UK data


    • Eurozone sentiment held firmer, supported by retail sales


Strategic Advantage

Our thematic analyst breakdown delivers data-driven, time-sensitive signals that:

  • Detect FX sentiment divergence


  • Identifies dominant macro themes early


  • Distinguish lasting trends from cut through the noise


Strategic Takeaway

Trading Co-Pilot led the move with clarity. Its layered sentiment intelligence provided an early, clean, and risk-aware bullish call on EUR/USD and EUR/GBP. This enabled clients to position with confidence and respond strategically in a dynamic FX environment.

Unlock the Edge

Contact enquiries@permutable.ai to access our real-time, sentiment-led FX intelligence and strengthen your trading strategy.

Dovish noise, hawkish policy: Sentiment at the heart of the 2025 Fed monetary policy debate

In this article, we explore how shifts in monetary policy sentiment often lead Federal Reserve decisions. The chart tracks hawkish and dovish headline volumes from January 2018 to July 2025, mapped against the Fed Funds Rate. This timeline aligns with Chair Powell’s tenure, offering a focused view of how media tone and policy have interacted over key phases of the rate cycle.

This chart provides a long-range view of how monetary policy narratives evolve over time, and how they often lead, rather than follow, decisions by the Federal Reserve. It tracks the volume of hawkish and dovish sentiment in financial media, using keyword-filtered headlines as a proxy for tone, and overlays these shifts against the effective Fed Funds Rate from January 2018 to July 2025. Conveniently, the timeline aligns with Chair Powell’s tenure at the helm of Fed, offering a focused lens through which to observe how sentiment and policy have interacted throughout this period.

How to interpret the data:

  • Dovish sentiment (blue bars) reflects heightened media discussion around looser monetary conditions, including calls for rate cuts, increased liquidity or greater tolerance of inflation to support growth and employment.
  • Hawkish sentiment (red bars) measures coverage promoting tighter policy, such as raising interest rates, controlling inflation or cooling an overheating economy.

The Fed Funds Rate (black line, right axis) anchors these shifts in tone to the Fed’s actual policy moves, offering a benchmark against which sentiment dynamics can be assessed.

monetary Policy DOVISH vs HAWKISH

What emerges is more than a record of interest rate changes. It is a narrative map, where shifts in tone and transition often come before action. At times, sentiment appears to take the wheel before the Fed alters course.

Understanding Market Sentiment Volume

Market sentiment volume refers to (in the case of our chart) how frequently monetary policy narratives, whether dovish or hawkish, appear in financial media coverage. It captures the number of times specific keywords and phrases aligned with each tone feature in headlines and articles. 

This provides a gauge of the intensity and dominance of prevailing macroeconomic narratives. It measures not how a headline feels, but how often a particular policy narrative is repeated. This reveals the broader weight of coverage and serves as a valuable lens through which to assess market mood, media pressure and speculative momentum.

  • Dovish volume includes headlines calling for interest rate cuts, monetary easing in response to slowing growth or support for employment and stimulus.
  • Hawkish volume comprises headlines focused on inflation risks, policy tightening, overheating concerns or the need for a firmer monetary stance.

By tracking these volumes over time, we can observe how policy narratives build ahead of Federal Reserve monetary policy decisions. Shifts in market sentiment volume often precede market turns, acting as early signals of changing expectations. As such, it offers a forward-looking lens into market mood, speculative momentum, and media pressure around policy cycles.

The Shifts in Narrative Dominance

The Dovish Wave of 2020: Crisis-Driven Intervention

In early 2020, dovish sentiment surged as the pandemic sent shockwaves through the global economy. With recession fears mounting, financial media turned sharply toward expectations of emergency support. That flurry of blue sentiment, visible in our chart as a steep spike, signalled widespread panic across markets and policy circles. The Fed’s rate cuts came swiftly, but the narrative turned before the decision landed. In moments of crisis, dovish tones move faster than policymakers, often capturing the urgency of a moment when intervention becomes all but inevitable.

The Hawkish Tide of 2022–2023: Inflation Takes Control

By contrast, the 2022-2023 tightening cycle was a more measured build-up. Hawkish market sentiment steadily rose as inflation began to overshoot and labour markets showed persistent strength. Each inflation print nudged expectations higher. Every speech from Fed officials added fuel to the fire. This time, sentiment climbed with the data, supporting, rather than predicting, the Fed’s monetary policy path. By the time the central bank reached its terminal rate, the red bars had already begun to fade. The question was no longer how high rates would go, but how long they’d stay there.

Why Market Sentiment Shifts Matter

These patterns are no coincidence. Hawkish market sentiment typically builds in anticipation, when inflation is rising, the economy is running hot, and markets brace for action. Dovish market sentiment, on the other hand, tends to spike at turning points, when cracks emerge, when financial stress becomes visible, and when the data begins to shift against the prevailing policy stance. It’s a reactive force, often loudest when confidence in the current path begins to erode.

This asymmetry mirrors how monetary policy itself behaves. Hikes are telegraphed. Cuts arrive suddenly, in response to pressure. The media picks up on this imbalance, amplifying signals that policy may need to change, especially when the costs of inaction begins to mount.

The Narrative Crossroads of 2025: Rising Dovish Pressure

Fast forward to 2025, and a familiar pattern is returning. Despite the Fed holding rates steady at 4.25 – 4.50% through the first half of the year, dovish market sentiment has surged. This time, it’s not speculative noise, it reflects a growing mismatch between the Fed’s monetary policy stance and the evolving macro landscape.

Inflation has cooled from its highs, yet growth is slowing and cracks are emerging. Housing and construction are under pressure. Private sector hiring has nearly stalled. Consumer confidence is slipping. And yet, the Fed remains unmoved. The longer the pause persists, the louder the calls for a shift. Media coverage has grown increasingly urgent, reflecting fears that policy is now overly restrictive. Dovish sentiment isn’t just building, it’s broadening.

A Fractured Fed and Rising Political Heat

For the first time since the start of the tightening cycle, divisions inside the Fed are spilling into public view. Governor Waller has openly called for rate cuts, pointing to deteriorating labour data and brushing off inflation risks from tariffs. Michelle Bowman has sounded similar alarms. The once unified front of 2022 – 2023 has splintered into three camps: those urging patience, those pushing to pre-empt further weakness, and a cautious middle watching the data.

Overlaying all of this is a new complication – politics. President Trump has launched direct attacks on the Fed, demanding lower rates and publicly criticising Chair Powell. While the Fed’s independence remains intact in principle, the optics of political interference are fuelling market uncertainty. The tone of coverage has shifted accordingly. Dovish sentiment is no longer just a reaction to softening data – it’s being driven by the broader political climate.

The Fed’s 2025 Test

The narrative shifts of 2025 have placed sentiment back at the centre of monetary policy analysis. While the Fed maintains its data-driven stance, it now faces mounting pressure, from weakening economic indicators, internal division, and intensifying political noise.

Dovish sentiment is rising fast, echoing concerns that the current policy stance may be too tight. US Inflation has cooled (CPI at 2.7%), unemployment has come down (4.1%), and the economy is experiencing a period of slower growth. At the same time, hawkish sentiment has faded, with fewer media calls for holding or tightening. This divergence between market narrative and central bank position is becoming harder to ignore.

Historically, tone has shifted before policy. The 2025 cycle may be no different. The sharp build-up in dovish sentiment is more than media speculation, it signals growing unease that the cost of inaction may now outweigh the risks of easing too early.

What to Watch: The Fed Meeting

Despite political and media headlines for a rate cut, the Feds monetary policy stance is likely to keep rates on hold. Three key reasons underpin that stance:

  • Tariff-Driven Inflation: Renewed price pressures are creeping back into the data, complicating the case for easing.
  • Expectation Management: With markets already pricing in a September cut, the Fed may push back to retain control of the policy timeline.
  • Credibility and Communication: Holding firm allows the Fed to preserve flexibility, while reinforcing its inflation-fighting credentials.

The gap between sentiment and Fed action is widening. Whether the Fed eases, or the data forces its hand, will define the remainder of 2025.

How Market Sentiment Volume Adds Value for Institutional Clients

Tracking real-time shifts in the sentiment and volume of dovish and hawkish policy narratives enables institutions to stay ahead of monetary policy pivots. By identifying changes in market tone, market sentiment volume offers a strategic edge across trading, research, and risk management.

Hedge Funds

Banks & Trading Desks

  • Manage risk around key events like FOMC or CPI releases.
  • Guide clients on interest rate moves and volatility.
  • Use market sentiment as part of broader macro strategy overlays.

Macro Strategists

  • Predict when the Fed might shift policy using narrative pressure.
  • Monitor internal Fed divisions through public tone shifts.
  • Build more forward-looking economic scenarios.

Quant & Discretionary PMs

Research & Economics Teams

  • Enhance dashboards and market insights.
  • Link sentiment changes to asset performance trends.
  • Flag early turning points in policy or macro cycles.

Market Sentiment as a Signal: Watching the Narrative Steer the Cycle

The ongoing tug of war between sentiment and policy reinforces the idea that narrative momentum can serve as a leading indicator. The rise in dovish tone across 2025 reflects more than economic signals. It suggests a collective call for change, driven by slowing inflation, weakening demand and rising global uncertainty. While the Fed maintains a cautious monetary policy stance, the narrative may already be drifting beyond it.

Whether the first rate cut arrives in July, September or later, the groundwork is being laid in the headlines. If previous cycles are any guide, a plateau in rates alongside rising dovish sentiment is often the precursor to monetary easing.

Ultimately, this chart reminds us that markets do not simply respond to facts, they move with the narrative. Our market sentiment volume intelligence offers a powerful lens through which to anticipate monetary shifts, particularly in a world where expectations are as critical as outcomes. For investors, economists, and policymakers alike, tracking the volume and tone of dovish and hawkish narratives provides a valuable edge, helping to sense when sentiment, not the Fed, is in the driving seat.

Turn Narrative Signals Into Actionable Insight

Discover how our Market Sentiment Volume intelligence can help you anticipate policy pivots before they happen. Book a personalised demo today and see how leading institutions are using our sentiment data to gain a strategic edge in trading, research, and risk management.

Email enquiries@permutable.ai to request your demo.

US Treasuries Pivot: Tracking policy repricing in real time

This article explores how the 2-year T-note became the focal point of a short-duration rally and subsequent reversal, and how our Trading Co-Pilot tracked both in real time. From detecting the initial bullish pivot in mid-July to flagging the slowdown as macro headwinds emerged, our Trading Co-Pilot continues to provide institutional investors with a distinct tactical edge.

In today’s volatile fixed income landscape, turning points in US Treasuries are increasingly driven by subtle shifts in sentiment rather than traditional data releases alone. This is where our Trading Co-Pilot proves invaluable, capturing the earliest signals across monetary policy, trade flows, and geopolitical risk.

Real-Time Detection: The Early Bullish Signal

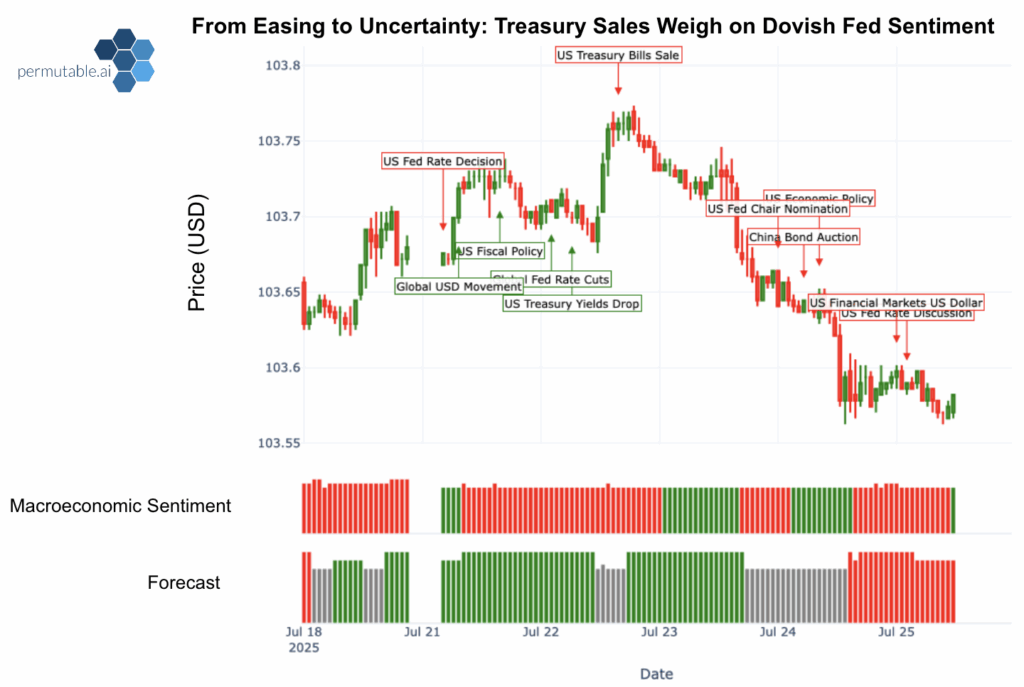
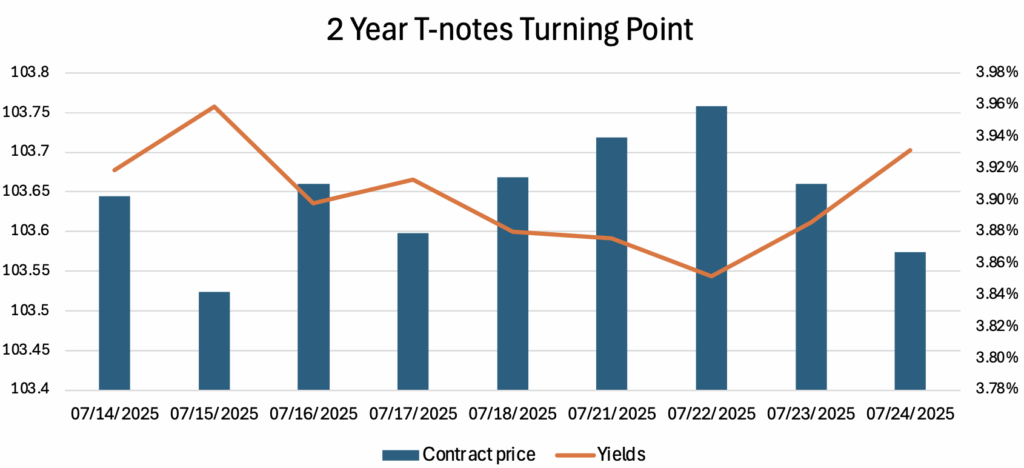
Between 18 and 23 July, our Trading Co-Pilot flagged a steady build-up in bullish sentiment surrounding the 2-year T-note as yields declined to around 3.85%, while the contract price rose from $103.60 to $103.75. This signal was driven by a combination of:

  • Dovish messaging from Federal Reserve officials.
  • Strengthening US-Japan trade ties.
  • Heightened geopolitical tensions supporting safe-haven flows.
  • A more disciplined fiscal tone from US policymakers.

The signal came early, giving investors time to rotate before the broader market responded.

US Treasuries Co-Pilot
Our Trading Co-Pilot flagged rising sentiment as 2-year yields fell spurring contract prices to climb, driven by dovish Fed tone, US-Japan trade optimism, and safe-haven demand.

What Moved the Needle

Renewed Trade Optimism

The recently signed US-Japan trade agreement, valued at over $550 bn, acted as a macro catalyst. Key provisions included Japanese investment in critical US sectors such as semiconductors and pharmaceuticals, alongside a reduction in US tariffs on Japanese cars from 27.5% to 15%.

The easing of trade tension sparked a rally in Japanese equities and led to a weaker greenback against the yen, improving the relative value of US Treasuries to foreign buyers. Our Trading Co-Pilot picked up on this rotation early, flagging sentiment gains tied to trade and FX dynamics.

Fiscal Restraint and the Supply Picture

The US Congress’s approval of a $9bn spending cut, targeted at foreign aid and public broadcasting, added another layer of support. Though modest in scale, it signalled a willingness to rein in public spending buoying investor confidence in fiscal restraint. The US Treasury’s preference for longer-dated issuance further supported demand at the short end.

Dovish Signals

Additional support came from Fed Governor Christopher Waller, whose dovish tone reinforced expectations for rate cuts to come. Although June CPI rose slightly to 2.7% from May’s print, inflation remained within the Fed’s acceptable range despite the trickle of tariff based inflation pressure creeping in. Our Trading Co-Pilot integrated these developments into a rising sentiment score well ahead of the rally in 2-year T-note prices.

Inflection Detected: From Momentum to Market Caution

However, from 24 July our Trading Co-Pilot detected a turn in sentiment as yields creeped back up and contract prices fell. This preceded the broader pause in Treasury gains and was driven by a convergence of factors:

  • A significant upcoming $70 bn 5-year treasuries auction raised concerns over short-end supply.


  • Renewed political tensions, as President Trump clashed publicly with Fed Chair Powell over fiscal priorities, with the chair signalling no intention to resign.


  • A strengthening US dollar reduced the appeal of Treasuries for foreign investors.


  • Economic data surprised markets, particularly a drop in initial jobless claims and robust consumer sentiment.

Stronger labour market figures published on Thursday shifted the narrative of a slowing US growth. While markets still expect rate cuts in 2025, they have pulled back from pricing in two full cuts this year. A hold in July remains fully priced in, though expectations for a September move have weakened modestly.

Our Trading Co-Pilot incorporated these dynamics in real time. The forecast sentiment turned bearish on 24 July as yields rose and contract prices fell, reflecting an erosion in conviction around monetary easing. This foresight offered a vital edge as institutional positions recalibrated.

2 Year T-notes
Markets trimmed rate cut bets as hawkish Fed rhetoric and strong macro data pushed yields higher and contract prices lower, reflecting weakening conviction around near-term easing.

The Bigger Picture

The 2-year T-note remains the most direct expression of market rate expectations. With its low duration and deep liquidity, it responds swiftly to shifts in policy tone and macro narrative. The combined effects of policy recalibration, geopolitical strain, trade stabilisation, and fiscal prudence have created a mixed environment for the 2-year T-note. Our Trading Co-Pilot translates these developments into forward-looking sentiment scores, ahead of both price action and consensus forecasts.

Safe Haven Rotation: Flight to Yield Amid Volatility

Even as gold retreated amid easing trade tensions, demand for 2-year T-notes still holds firm over concerns of increased market volatility. Our Trading Co-Pilot identified this divergence in real time, flagging a rotation towards yield-linked defensives as investors sought both safety and return.

Meanwhile, ongoing geo-political uncertainty in Japan, regional instability in the Middle East, and the prolonged war in Ukraine continued to support short-duration US Treasuries. Our Trading Co-Pilot tracked this constructive sentiment across geopolitical developments.

Turn Market Complexity into Trading Edge 

In a week marked by rapid shifts, our Trading Co-Pilot demonstrated its value as a real-time lens on the T-notes market. It identified the early bullish pivot, tracked the influence of trade diplomacy and macro policy, and detected the reversal. 

In a market shaped by policy transition, trade realignment, and ongoing geopolitical risk, the 2-year T-note anchors institutional positioning.

Our Trading Co-Pilot intelligence suite delivers early, forward-looking insight across these moving parts, helping investors anticipate change and act before it becomes consensus.

For enquiries or trial access to our API or dashboard, contact us at: enquiries@permutable.ai


Japan’s economy at a crossroads: Political risk, bond market stress, and the Yen’s decline

In this article, we explore Japan’s growing macro fragility as political uncertainty, surging bond yields, and a structurally weaker yen reshape investor sentiment. With JGB yields at multi-decade highs and the yen hitting record lows against major currencies, markets are undergoing a decisive re-pricing of risk. Amid this volatility, our Trading Co-Pilot has been able cut through the noise, identify turning points, and stay ahead of shifting macro trends.

The Dilemma: Inflation Stickiness as Policy Caution Prevails

In recent weeks, Japan’s economy and financial markets have entered a volatile phase, marked by a broad re-pricing of sovereign risk, mounting political uncertainty, and currency realignments across the board. Japanese Government bonds (JGBs) from 2-year to 30-year, have seen yields soar to levels not seen since the late 1990s, while the yen has collapsed to multi-decade lows against the euro, dollar, and Swiss franc. Against this backdrop, our Trading Co-Pilot has remained an essential lens through which investors can detect signals from noise, capturing inflection points, anticipating macro shifts, and providing confidence amid complexity.

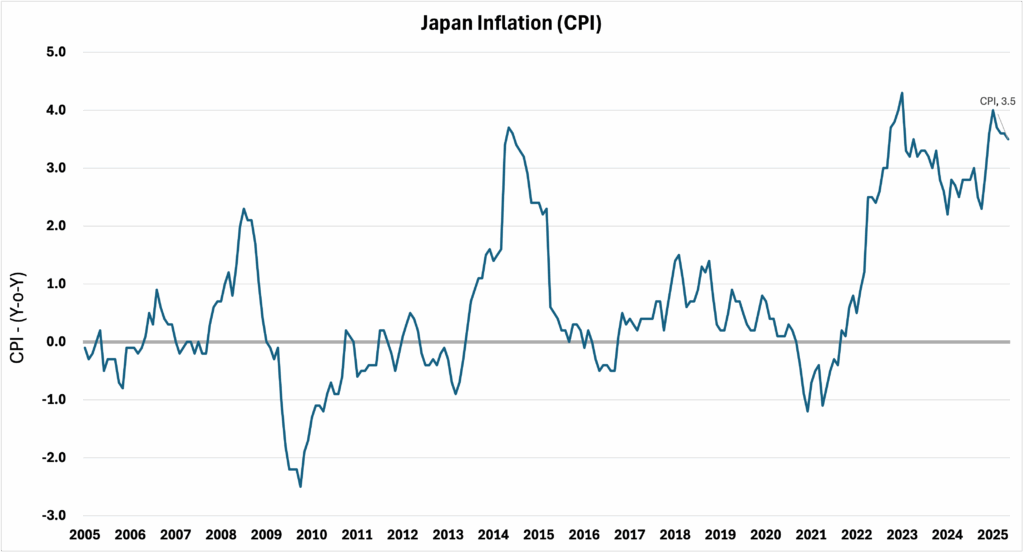
Japan’s inflation picture is diverging from historic norms. Headline inflation softened to 3.5% in May, its lowest reading since November, driven by slower price increases in healthcare, clothing, and household goods. However, the Bank of Japan’s (BoJ) preferred core inflation metric accelerated to 3.7%, its highest in over two years, reflecting structural price stickiness. Adding to the inflation woes is the doubling of rice prices, which has demonstrated the limitations of state subsidies in shielding households from food-driven price shocks.

JPY inflation

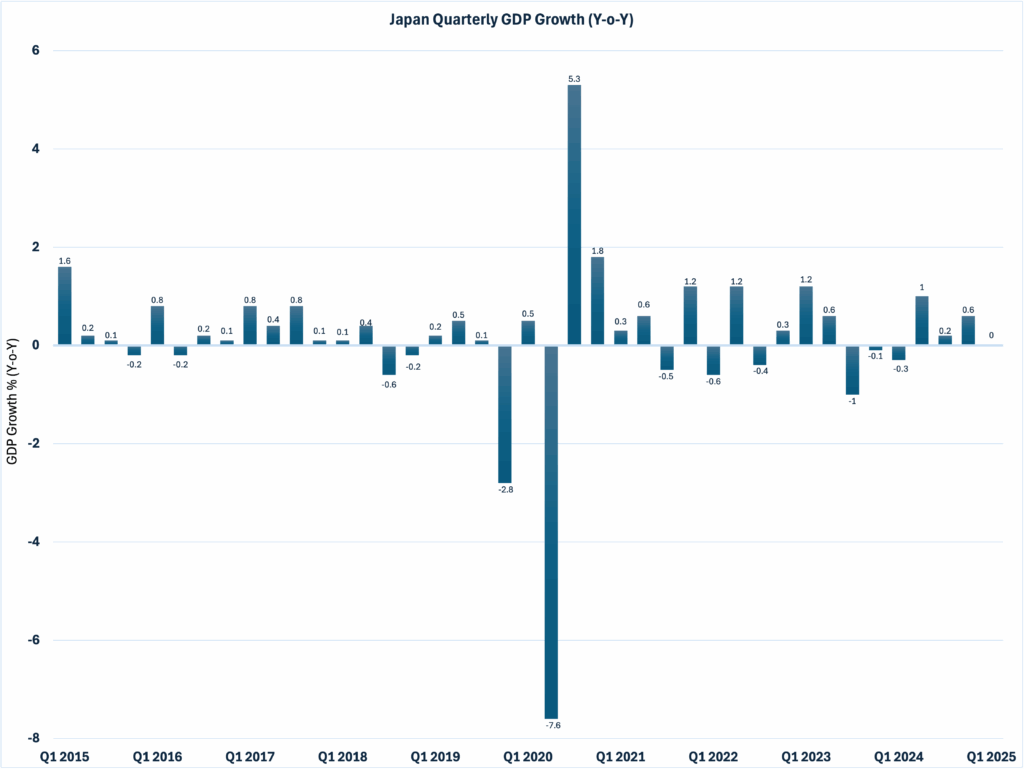
This presents a fundamental puzzle for the BoJ and reflects the broader uncertainty hanging over Japan’s economy. Having delivered its first interest rate hike in 17 years earlier in 2025, the BoJ opted to pause in June and to taper its bond issuance programme. Despite a string of weak GDP prints and flagging real wages, inflationary dynamics rooted in cost-push pressures, tariff-induced distortions, and wage trends suggest an undertone of fragility and persistent underlying price pressure. Growth remains subdued across Japan’s economy, with Q1 GDP flat and exporters challenged by a weakening yen and intensifying trade headwinds as Trump set a 25% tariff on Japanese imports. The political imperative, specifically looking ahead to the 20th July Upper House election, only raises the stakes.

In the absence of any new inflationary surprise, further monetary tightening is likely to be delayed until Q4 at the earliest. What we’re witnessing for policy in both a fiscal and monetary sense, is a balancing act whereby institutions are navigating a tightrope of inflation becoming too entrenched to dismiss, coupled with a subdued growth outlook too precarious to risk throwing off balance.

Bond Market Cracks and Yield Curve Signals

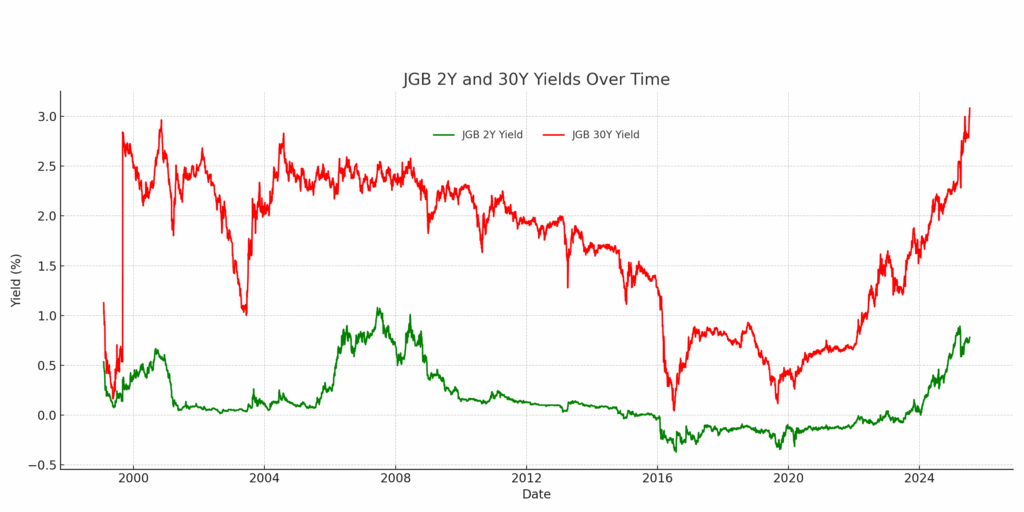
Japanese Government Bond yields have surged recently, signalling both structural unease and tactical repricing owing to mounting risk premiums. The 10-year yield has breached 1.55%, its highest level since March, and now teeters on the edge of a breaking higher above 1.6%, a level not seen since 2007. Meanwhile, the longer term bonds, notably the 30-year yield, have climbed past 3.2%, while the 20-year touched highs not seen since 1999.

This vertical repricing reveals a market bracing for fiscal slippage across Japan’s economy. With opposition parties campaigning on large-scale stimulus and potential tax cuts, the market fears a breakdown of fiscal discipline. Indeed, the Ministry of Finance’s earlier attempt to cap yields through bond issuance cuts proved short-lived and offered sparse relief. The chart reflects how JGB yields (both 2Y and 30Y) are now diverging from traditional norms, even as the yen weakens. This unusual dynamic underscores the risk premium now being priced into Japanese assets.

Our Trading Co-Pilot’s currency and political sentiment components have been leading indicators of this dislocation, signalling stress as early as June. The spread between the 2-year and 30-year JGB yields has widened dramatically, hinting investor discomfort. 

JGB

FX: The Yen’s Slide Defies Soaring Yields 

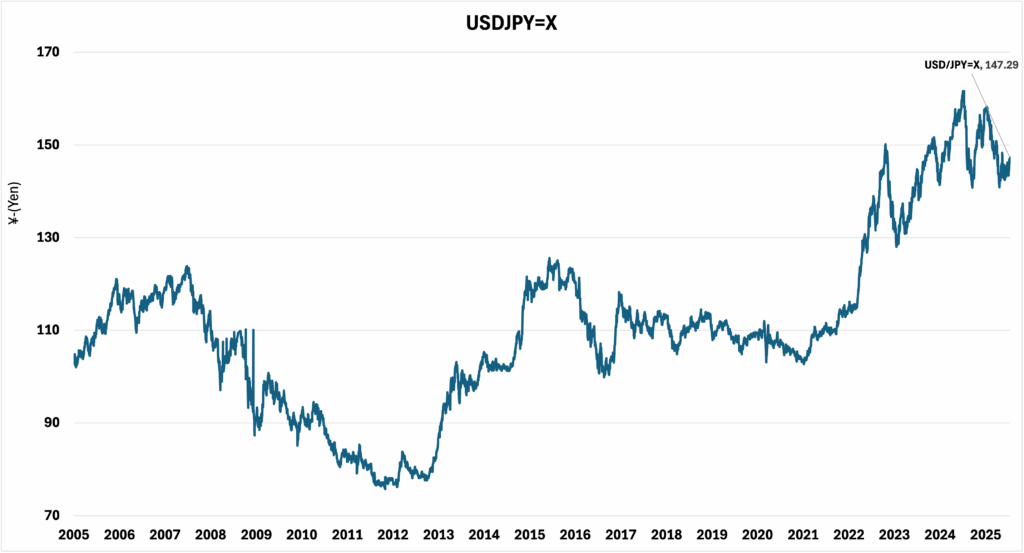
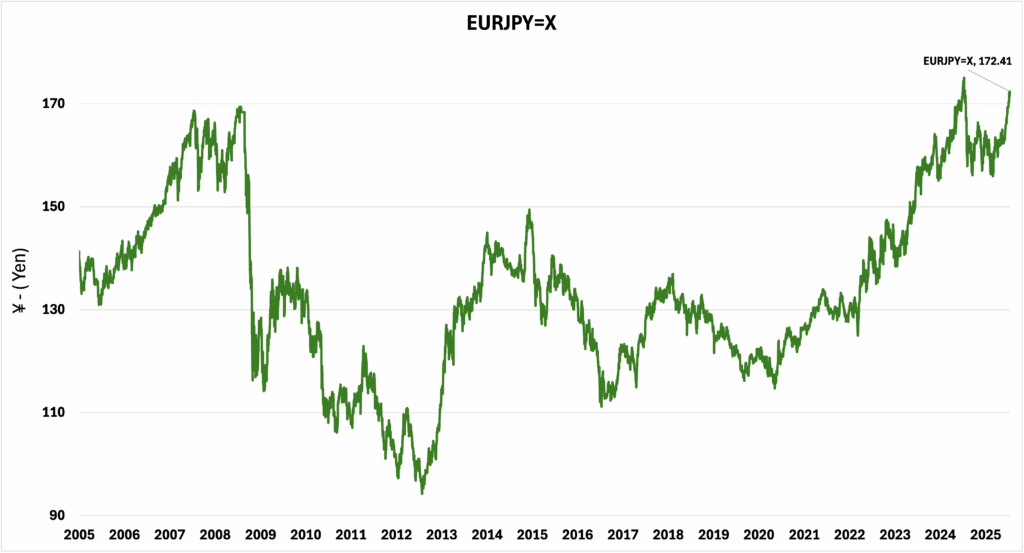
Despite the surge in JGB yields, the yen has continued to slide. USD/JPY has pushed above ¥147.00, closing in on cycle highs. Even more striking is the EUR/JPY cross, which hit a one-year high of ¥172.63, driven by euro strength and Japanese political risk. The yen’s underperformance reflects not just interest rate differentials, but also doubts over Japan’s fiscal trajectory, weak domestic demand, and the BoJ’s caution to commit to a sustained hiking cycle.

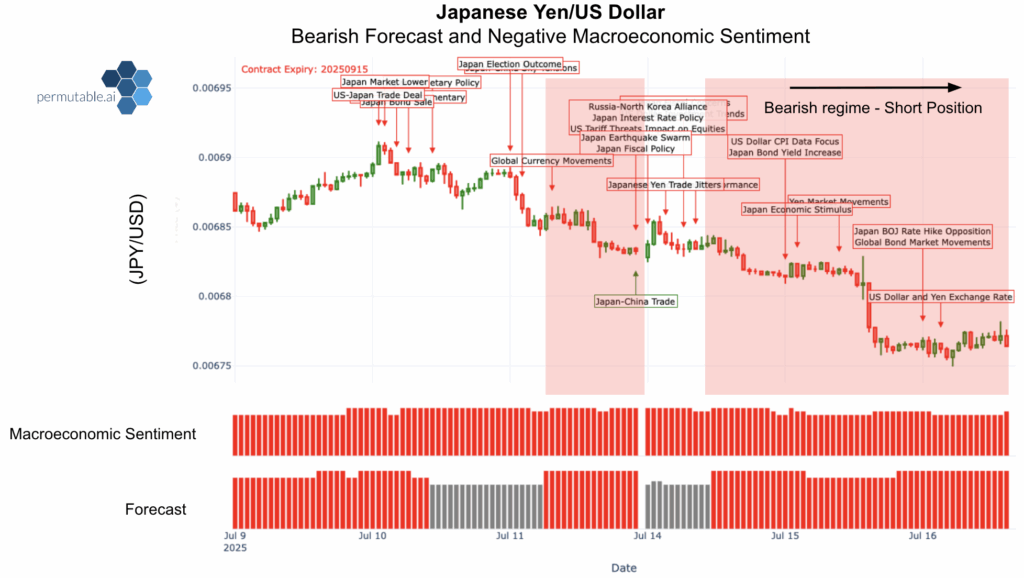
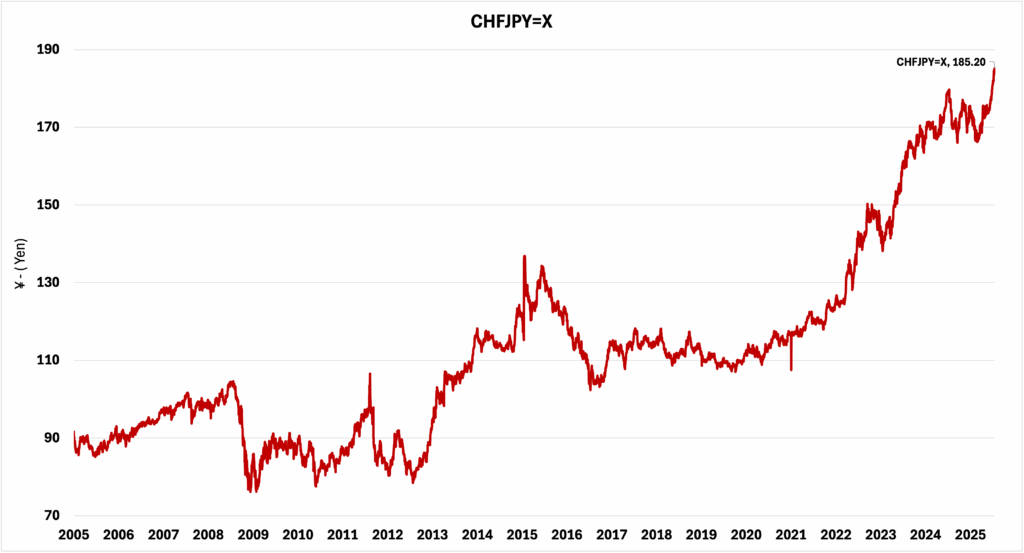
CHF/JPY offers another lens into safe haven divergence. Despite global risk-off sentiment, the Yen is no longer acting as a defensive asset. CHF/JPY recently surged to ¥185.30, in line with our Trading Co-Pilot headlines showing positive momentum in the Swiss economy, while Japan’s economy registered negative scores across nearly all categories, fiscal, political, and economic. The chart below shows the bearish outlook for the Yen, with macroeconomic and forecast sentiment turning pessimistic over the last week. Therefore, for investors to gain more confidence and the Yen to retain its defensive stature, the BoJ must look to signal a more hawkish stance or policymakers must allude to greater fiscal credibility which is difficult during election periods as parties look to appeal to voters.

Japan's economy

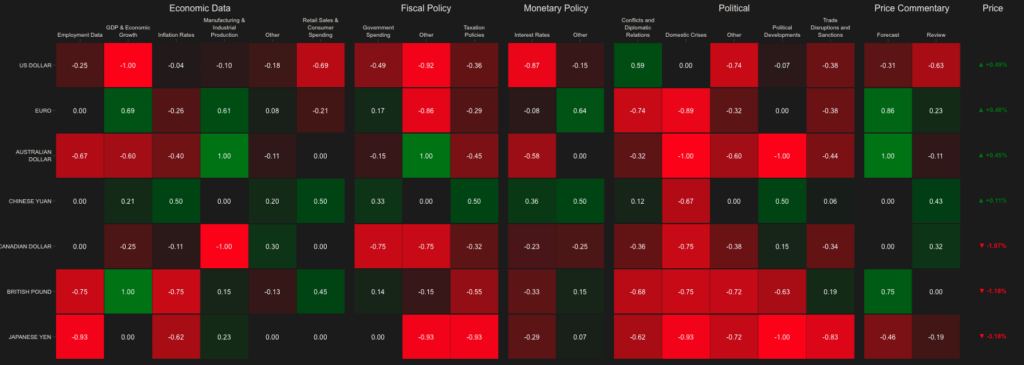
Trading Co-Pilot Heat Map: Japan’s Macro Weakness in Full View

As highlighted in our FX sectoral heat-map, the Yen ranks as the weakest among major currencies. Negative sentiment spans across political developments (-1.00), employment data, fiscal policy, taxation, domestic crisis, at (-0.93), trade disruptions and sanctions (-0.83), inflation (-0.62), and interest rates  (-0.29). This rare pattern of cross sector weakness explains the currency’s inability to benefit from yield rises or global volatility, conditions that historically supported the Yen.

fx heat map


FX Viewpoint – The Yen’s Multi-Decade Slippage

USDJPY

USD/JPY

The pair has surged to multi-week high of ¥147.00, as U.S. yields rose and Japanese yields repriced risk. Co-Pilot’s forecasts turned bullish on USD/JPY as early as July 9, correctly identifying the widening yield differentials and safe-haven premium for the dollar amid global tariff threats. The pair similarly reflects investor pessimism in the Japanese economy, showing strong negative sentiment with GDP growth (-0.80), interest rates (-0.77), and QE measures (-1.00), suggesting the market views Japanese tightening as tentative and insufficient given the fragility of Japan’s economy. In contrast, the dollar retains its policy momentum despite its own domestic challenges.

EUR/JPY 

Recently soaring to a one-year high of ¥172.63, driven not just by Japanese weakness but eurozone resilience. Our Trading Co-Pilot’s EUR sentiment index pointed to continued investor rotation into euro assets due to comparative political stability and a hawkish-leaning ECB. EUR/JPY, is benefitting from a favourable eurozone backdrop. Modest economic resilience, improving inflation data, and political cohesion has benefitted rotation into the single currency. Even with EUR-based political frictions, the relative perception of stability keeps the Euro bid in JPY crosses.

CHF/JPY 

The safe haven status of Swiss Franc has emerged as one of the most notable FX pivots. The pair has extended its longstanding uptrend, hitting highs near ¥185.30, supported by the Swiss franc’s classic safe-haven bid and deep investor scepticism toward Japan’s economy and its ability to contain fiscal slippage and recent geo-political shocks. The Franc is still regarded as the highest-quality safe haven across dimensions, with the yen losing its historical defensive status. The FX performance shows this clearly that CHF/JPY is now testing all-time highs even as JGBs rally, implying that market confidence in Japan’s policy coordination is fraying.

Outlook: Navigating Structural Weakness and Political Risk

Looking ahead, Japan’s fiscal outlook and the Upper House election result will be pivotal. If the ruling coalition loses its majority, markets may brace for aggressive stimulus proposals, raising the spectre of debt monetisation. However, a divided opposition and legislative hurdles make immediate fiscal expansion less likely. It remains to be seen whether the current political noise will sustain uncertainty in bond markets, capping the Yen on the upside.

For investors, Japan’s economy is no longer the low-risk, low-return anchor that it once was. Yields are rising, but not for the right reasons. Currency weakness appears structurally inherent and not a tactical play. The bigger picture at hand sees the BoJ being boxed in by confluence of above target inflation and lacklustre growth. This is coupled by the emergence of political risk returning to Tokyo complicating matters of fiscal orthodoxy and raising the guard of bond vigilantes.

In this environment, our Trading Co-Pilot remains a vital tool for institutional decision-making. By aggregating sentiment across sectors and policy domains, being able to track structural divergences in real time enables faster rebalancing across FX strategies. As Japan’s economy edges towards its policy reckoning, we’ll be watching the headlines, and signalling ahead of the turn.

Navigate The Next Market Move With Real-Time Macro Intelligence

Stay ahead of structural dislocations and policy uncertainty with our real-time macro intelligence. Our plug and play Trading Co-Pilot intelligence suite empowers clients to anticipate turning points across FX and fixed income, before the market prices them in.

To access our full dashboards, strategy tools, or schedule a demo, simply email: enquiries@permutable.ai

Japan Macro Sentiment Data FAQ

Q: What does the Japan Macro Sentiment dataset track?

A: It measures real-time sentiment across political, fiscal, monetary, and trade domains, highlighting how shifts in narrative and investor confidence shape Japan’s bond and currency markets.

Q: Why are JGB yields rising while the yen continues to weaken?

A: This unusual divergence reflects structural concerns about Japan’s fiscal trajectory and doubts over the Bank of Japan’s commitment to sustained tightening. Rising yields are driven by risk premiums, not stronger fundamentals, while the yen’s safe-haven appeal has eroded.


Q: How does political risk factor into Japan’s macro sentiment?

A: Leadership uncertainty, election-driven fiscal promises, and tensions with trading partners amplify volatility. These political risks reduce confidence in fiscal discipline, contributing to both rising yields and yen weakness.


Q: What does the dataset reveal about safe-haven dynamics?

A: The yen has lost ground as a traditional defensive currency. Crosses such as CHF/JPY show investors increasingly prefer the Swiss franc, reflecting waning trust in Japan’s policy coordination during periods of global stress.


Q: How can investors use this dataset?

A: Institutional clients can integrate the sentiment data into FX and fixed-income strategies to anticipate turning points. It helps flag credibility risks, track divergence between yields and currencies, and identify structural dislocations before they manifest in price action.

Q3 2025 cross-asset outlook: Decoding the macro shift ahead

In this article, we explore the cross-asset macro shifts shaping the outlook in Q3 2025 across US Treasuries, high-growth tech, and institutional crypto, uncovering how our Trading Co-Pilot offers unparalleled foresight, enabling institutional traders to navigate and capitalise on this new market cycle.

As Q3 2025 marches forward, global markets, recently challenged by market fragility and geopolitical volatility, now exhibit rare cross-asset synchronicity. US Treasuries, high-growth tech, and institutional crypto flows are moving in shared bullish harmony. While strategists debate the longevity of asset price ascent, citing ‘FOMO’ as a driving force, a new market cycle is clearly forging ahead, propelled by a re-evaluation of the monetary policy outlook, renewed risk appetite, and AI-powered market intelligence.

Our Trading Co-Pilot has proved instrumental in identifying these turning points. Through its sector-focused analysis and expert insights, it flagged the convergence across these diverse assets, clarifying shifting market trends with precision. 

Leveraging advanced machine learning and real-time sentiment data, it intelligently interprets vast volumes of unstructured global information, from policymaker rhetoric and geopolitical developments to proprietary datasets and capital market flows. 

In this analysis, we use insights from our Trading Co-Pilot to explain how sentiment is shifting, what critical themes are emerging, and where capital is moving, offering unparalleled foresight.

US Treasuries: Yields Recalibrate, Fed Easing Expected

After months of volatility, US Treasuries have staged a comeback, with yields moving lower as the market narrative decisively pivots towards Federal Reserve easing. The 10-year Treasury yield now sits at 4.19%, with the 30-year near 4.78%.

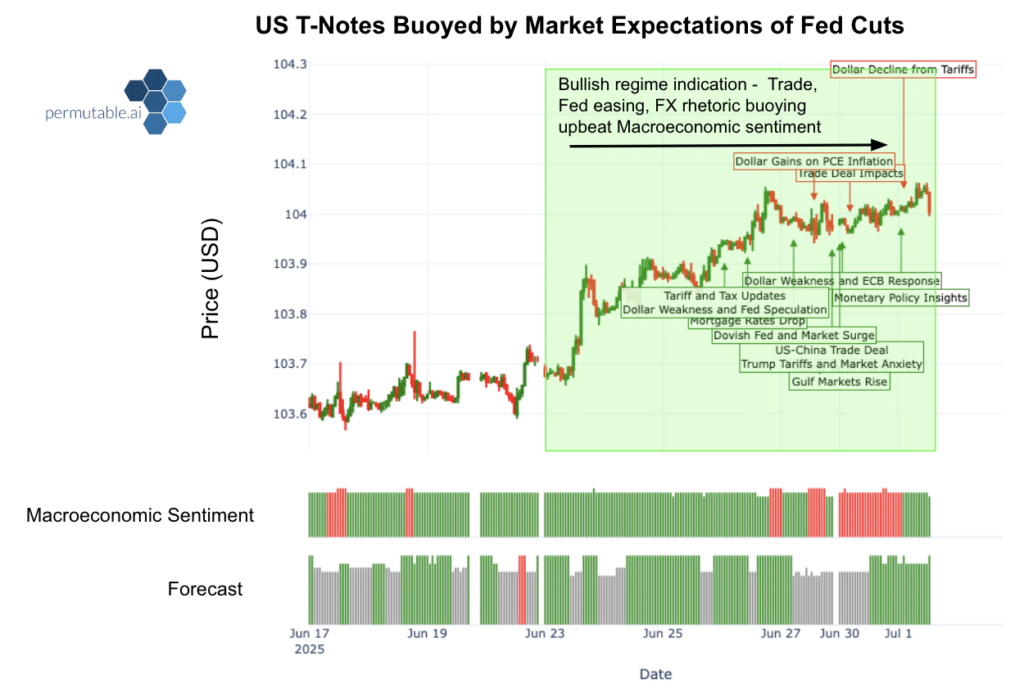
  • Sentiment shift: Our Trading Co-Pilot’s real-time sentiment analysis, meticulously tracking Fed rhetoric and macro data, pinpointed this decisive shift in market outlook. It detected early surges in institutional flows, driven by safe-haven demand and a weakening US dollar, signalling a pivot in risk appetite and a “Bullish” signal from 23rd June to 1st July. 
  • Macro catalysts: A downward Q1 2025 US GDP revision to -0.5% (the first negative print since 2021) and benign payroll and wage growth data reinforced the easing narrative. The US unemployment rate held steady at, with average hourly earnings growth moderating as well.
  • The markets dovish tilt: The June FOMC minutes revealed a greater focus among policymakers on emerging labor market softness and the potential impact of tariff effects. The market is now expecting a dovish tilt, pricing in cuts by September and more by year-end 2025.
  • Greenbacks demise: The US dollar’s retreat has buoyed foreign demand for Treasuries. This, coupled with gold’s rally past $3,340/oz (reaching new all-time highs), further validated the flight to quality fixed income assets and weakening macro trend identified early by our Trading Co-Pilot.
US treasury
Caption: Our Trading Co-Pilot detected upbeat macroeconomic sentiment around the 23rd June, sustaining a positive outlook for T-notes going into 1st July supported by market pricing in more Fed cuts by end-2025 and improving macroeconomic data.

Equities: Nvidia and BlackRock’s Enduring Strength

While broader equity indices drifted higher, market leaders have been  propelled by the uplift of structural tailwinds. Notably, Nvidia and BlackRock stand tall above the rest in terms of reshaping their sectors and having robust stock performance.

Nvidia: AI Market Dominance Unwavering 

Nvidia’s recent performance encapsulates the market’s conflicted yet ultimately bullish relationship with AI’s long term market prominence. After a consecutive five-day surge that briefly crowned it the world’s most valuable company in June, shares pulled back to $155.98, a modest dip from its recent high that proves little in shaking the tech firm off its upward trajectory this year.

  • Robust fundamentals: Strategic moves like securing Wistron’s AI server capacity through 2026 and an expanded HPE partnership signal management’s adept navigation of supply chain complexities and ensure continued enterprise momentum. Consumer products like the release of the GeForce RTX 5050 maintain a key retail pipeline.
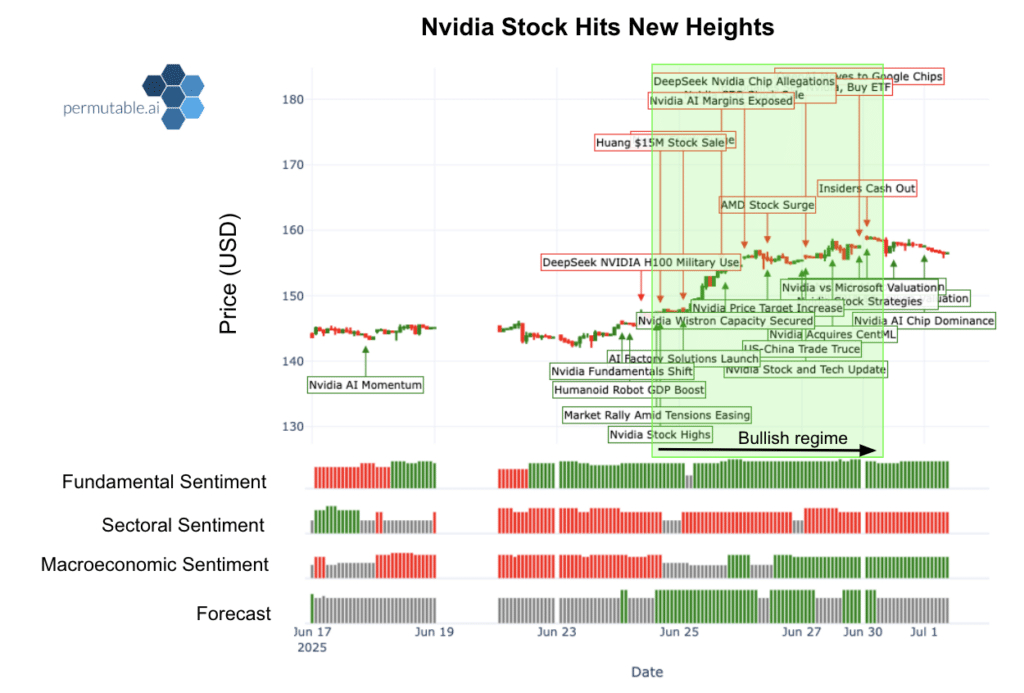
  • Our Trading Co-Pilot’s sentiment detection: Our system consistently detected persistent optimism, overriding headline noise. Its recent analysis of earnings reports, institutional investment, supplier contracts, and accelerated AI infrastructure expansion confirmed sustained momentum flagged a “Bullish” signal on 24th to 30th June. 
  • Financial trajectory: Revenue in 2025 has surged 114% to $130.5bn, as enduring Data centre demand dominates total revenue, underpinning expectations of continued double-digit growth and upside stock from analysts in 2025.
  • Potential headwinds: Insider selling has reached $1bn over the past year, with $557mn occurring in June alone. Competition in R&D from AMD intensifies adding some element of bearish sentiment.
Nvidia Outlook
Our Trading Co-Pilot detected upbeat macroeconomic, sectoral and fundamental sentiment around the 24th June, sustaining a positive outlook for Nvidia going into 30th June supported by renewed market optimism of long-term AI adoption and demand and robust revenue indicators from retail pipeline.

BlackRock: Reshaping Finance Through Digital Assets

BlackRock’s evolution into a digital asset powerhouse represents one of the year’s most significant strategic pivots. The firm’s IBIT ETF has impressively surpassed $70bn in assets under management, reversing a recent weeks-long volume decline that had concerned crypto traders.

  • Crypto backing: BlackRock’s aggressive Bitcoin accumulation, notably the purchase of $430mn in June, reinforces its leadership in the crypto ETF space, reflecting broader institutional acceptance of crypto as a legitimate asset class.
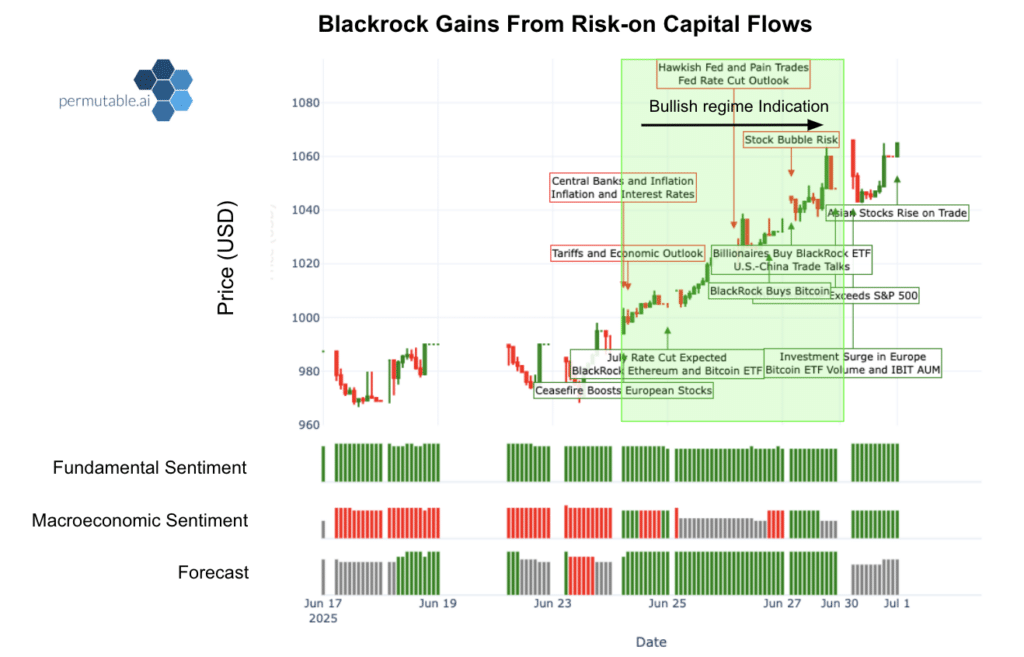
  • Our Trading Co-Pilot’s call: Our system provided early detection of this trend, signaling a “Bullish” call on 24th to 30th June, after having identified the persistent surge of institutional flows into BlackRock’s Ishares Bitcoin trust ETF and tracking rapid AUM growth. Our system has flagged this call having recognised the strong correlation between ETF growth and digital asset prominence, with BlackRock actively reshaping notions on mainstream institutional adoption.
Blackrock outlook
Our Trading Co-Pilot detected upbeat macroeconomic and fundamental sentiment around the 24th June, sustaining a positive outlook for Nvidia going into 30th June supported by Risk-on capital flows, relaxing of regulatory barriers and increased institutional adoption by the market.

Crypto Markets: Bitcoins Strategic Allocation in Diversifying Portfolio’s

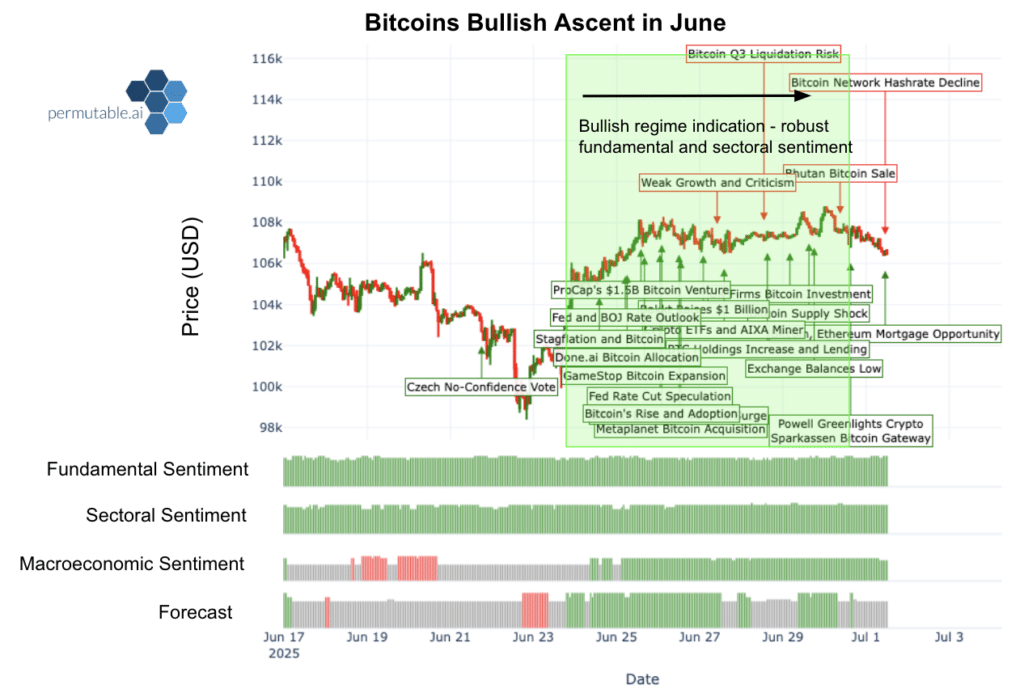
Once characterised by volatility, crypto markets have entered a profound new phase of institutional acceptance. Bitcoin’s recent rally above the $107,000 mark speaks volumes to the market faith and confidence in its role as a strategic and diversified asset.

  • Our Trading Co-Pilot’s insights: Its sophisticated real-time engine registered sustained institutional confidence, particularly as the full impact of Hong Kong’s retail crypto ETF feeds through and dovish US regulatory tones take hold. Upbeat macroeconomic sentiment highlights the easing of global liquidity concerns caused our system to signal a “Bullish” signal on 24th June to 1st July, with cryptocurrencies set to benefit from risk-on rotation and its emerging role in institutional portfolio diversification.
  • Key drivers: Robust ETF demand, increasing regulatory clarity, and declining exchange-held balances drive this maturity. The regulatory landscape continues to improve, with policymakers advancing digital asset legislation and removing a significant amount of red tape.

Bitcoin outlook

Trading Co-Pilot: The Future of Market Intelligence

In a world demanding decisive action, institutional traders require clarity, context, and unwavering confidence. Our Trading Co-Pilot delivers our clients this cross-asset strategic edge.

Here’s how our Trading Co-Pilot can do the same for you:

Request a personalised demo or contact us at enquiries@permutable.ai  to discover how our Trading Co-Pilot can enhance your institutional trading strategy.

Jack Watson is Permutable AI’s in-house analyst, leveraging our AI-driven insights to decode market trends, uncover global data signals, and explore how intelligent analytics are reshaping trading and investment strategies.


GBP USD outlook: USD demise as GBP takes spotlight

This article examines the unique dynamics propelling GBP/USD to a three-and-a-half-year high. It explores the interplay of fundamental macroeconomic indicators and market perceptions of institutional credibility, unveiling systemic truths behind sterling’s 2025 rally and the unexpected deterioration of US economic exceptionalism.

Advanced AI market intelligence

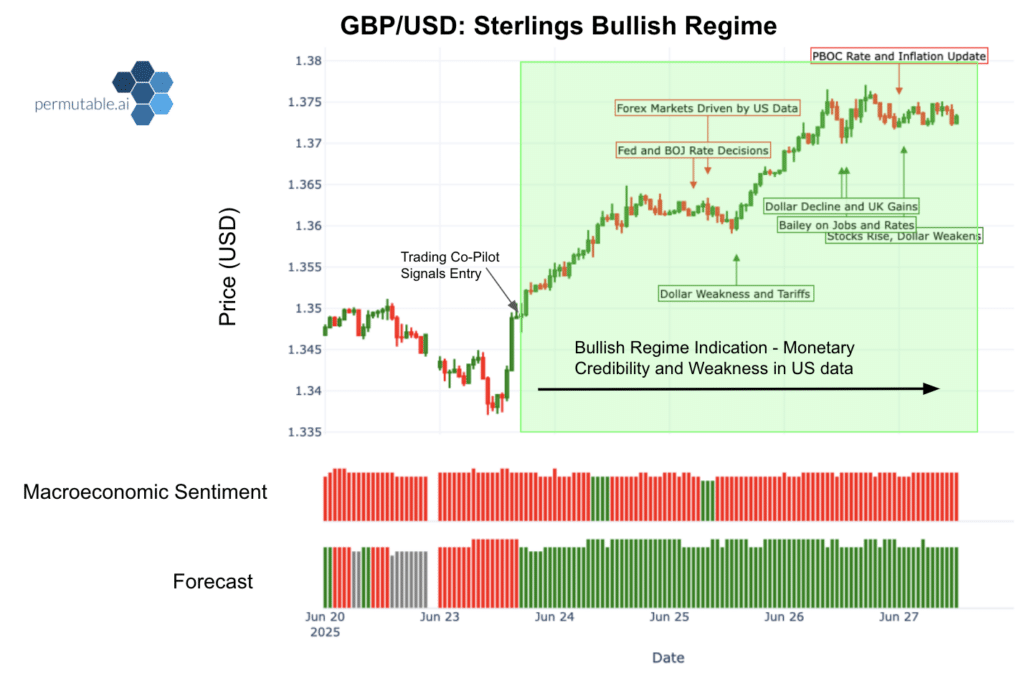
This week, our AI-driven Trading Co-Pilot detected early bullish signals in GBP/USD, picking up on subtle shifts in market sentiment, macroeconomic data flow, and central bank rhetoric well before the broader market reacted. Our Trading Co-Pilot issued a “Buy” signal on 23rd June, as its forecast quickly turned bullish in response to changing market dynamics, specifically the easing tensions in the Middle East and evolving US monetary policy rhetoric. The accompanying chart clearly shows a significant bullish regime for GBP/USD, highlighting its swift ascent. These machine learning-driven analytical insights are increasingly vital in fast-moving FX markets, where gaining an edge by positioning ahead of key inflection points directly informs successful strategies. 

The world of FX rarely encounters such reversals of fortune as seen in the GBP/USD over the course of the last 3 years. Yet sterling’s meteoric rise to 1.3740 against the greenback represents a narrative that goes beyond cyclical momentum, but one of fundamental pivot away from prior norms. As geopolitical tensions simmer down, the focus of FX markets has migrated away from safe haven flows and leans towards growth, political stability and monetary credibility.

GBP USD forecast
GBP USD enters a bullish regime as dollar weakness, as central bank signals, and robust UK data drive upward momentum. Permutable AI’s Trading Co-Pilot identified the entry point, with macro sentiment and forecasts aligning to support sterling strength.

The dollar’s demise: When political pressure meets monetary policy

Fed’s new reality

For decades, the Federal Reserve’s independence was the bedrock of global monetary policy. Currently, that foundation appears to be cracking under political pressure. Public criticism from Trump and his appointed governors targeting Chair Powell’s hawkish ‘wait and see’ stance has created broader market concern over political interference. This perceived erosion of the wall between politics and monetary policy is now being priced in by investors as an inherent risk premium.

Key indicators reflect this shift:

  • Markets are still pricing in 60-70 basis points cut from the Fed till 2025-end.
  • Treasury yields, with the 10-year yield falling to 4.27%, reflect fading institutional credibility.
  • The Dollar Index (DXY) hovers around 97.0-97.50, reaching multi-year lows despite recent safe-haven demand buoying the greenback.

This policy uncertainty and weakening of perceived Fed independence directly challenge the dollar’s dominance.

Economic fundamentals underpinned by political risk

The US economy’s Q1 contraction of -0.5% (y-o-y) points to deeper structural issues. While headline GDP weakness can be fleeting, the convergence of political and economic fractures casts a shadow over the dollar’s resilience. The greenback’s deterioration reflects a market revaluation of US institutional risk premium, beyond mere cyclical weakening.

Key pressure points include:

  • Private consumption growth significantly slowed, rising merely 0.5% (q-o-q) in Q1, marking its weakest post-pandemic reading amidst a cooling labour market.
  • Initial jobless claims show an upward trend, reflecting a softening labour market.
  • The recent widening of trade deficits is amplified by aggressive tariff policies and pre-tariff import surges.
  • The recent downgrade of US sovereign debt across the board, including Moody’s Ratings to Aa1 from Aaa on 16th May, starkly reflects mounting fiscal deterioration and ratings agencies’ lack of faith in policy makers ability to control ballooning debt.

Sterling’s rise 

Monetary integrity

As markets grapple with monetary interference elsewhere, the Bank of England (BoE) has emerged as a beacon of institutional stability. Governor Bailey’s unwavering integrity, combined with the BoE’s ability to manage tempering services inflation (5.4%) and broader growth concerns, exemplifies astute policy discipline. Such inherent credibility has fostered a yield advantage for investors in sterling, particularly as Fed policy uncertainty persists, proving supportive for the currency.

UK’s comparative outperformance

Britain’s Q1 2025 GDP expansion of 0.7% (q-o-q) indicates genuine economic momentum despite April’s lackluster m-o-m data. While Brexit fears and past economic policy challenges owing Truss’s mismanagement of economic guidance dominated headlines in prior years, the economy has slowly adapted and found new momentum. The current rally reflects the maturing of this prolonged adjustment period, backed by shifting underlying growth drivers.

Key growth drivers include:

  • Increased business investment as market confidence returns.
  • Resilient consumer demand despite global headwinds.
  • Industrial strategy investments in key sectors like AI, life sciences, and clean energy are beginning to yield dividends.

FX markets at work

The multiplier effect

GBP/USD’s breakthrough above the 1.37 resistance level has triggered strategic UK-bound flows. However, the pound’s selective strength, underperforming against the euro (EUR/GBP at 0.853) while gaining against the dollar. This highlights the rally’s true nature, sterling’s strength coming at a point of dollar demise. FX markets are now diversifying away from dollar-heavy portfolios, favouring alternatives with credible policy frameworks. Sterling benefits favourably from this pivot, owing to the UK’s liquid markets and robust fundamentals.

EUR GBP outlook
EUR/GBP trends upward as euro resilience outpaces sterling, supported by ECB updates, and UK macro data concerns. Market movements reflect cautious sentiment and rate cut expectations, our Our Trading Co-Pilots forecasts highlighting the euro’s relative strength.

European resilience

The Eurozone’s own revival, with 0.6% Q1 growth and continued ECB hawkishness, complicates sterling’s narrative. Germany’s planned fiscal stimulus and the Euro Area’s current account surplus provide structural support the UK lacks. While sterling benefits from dollar weakness, it must also justify its gains against a resurgent euro, backed by robust macro-fundamentals and robust external balances.

The current account conundrum

Britain’s deep-seated current account deficit remains its strategic vulnerability. While recent trade data has shown some volatility, this underlying structural imbalance has the potential to reverse sterling’s gains in risk-off environments. The currency’s strength thus depends heavily on continued global risk appetite and stable capital flows.

The bigger picture in FX: diversification of capital flows

The GBP/USD forecast outlook

For investors, this signifies accelerating diversification away from the dollar, favouring currencies like sterling as a hedge against US institutional uncertainty. FX Strategy increasingly hinges on governance quality, not only traditional macro metrics. If current trends persist, GBP/USD could approach 1.40, though prevailing risks and technical barriers linger, from the UK’s persistent current account deficit, enduring services inflation, and external shocks like a Fed policy reversal or stronger eurozone growth.

The appreciation of GBP/USD shows a broader pivot in FX markets. As the dollar’s perceived exceptionalism fades, currencies rooted in credible, independent central banks and measured policy frameworks are attracting capital flows. Institutional integrity is now as paramount as traditional economic might in currency valuations. Political interference in central banking is increasingly being priced in as a risk premium. For sterling, the challenge is proving this strength can endure beyond the current cycle of dollar depreciation.

The GBP/USD narrative highlights the advantage of AI-driven market insights

The GBP/USD narrative highlights the critical role of sophisticated, AI-driven market insights. Our Trading Co-Pilot’s ability to detect shifts in sentiment, macro divergences, and policy rhetoric early enables positioning ahead of broader market consensus. This provides instant analytical value in today’s fragmented and politically sensitive FX landscape.

As traditional correlations weaken and political risk premiums reshape FX valuations, the power of Large Language Model (LLM) derived sentiment pattern recognition becomes indispensable. Such systems are crucial for identifying key inflection points within currency pairs before they become apparent through conventional analysis. In today’s FX markets – where central bank credibility plays an outsized role in driving currency movements – gaining an informational edge is everything. Our Trading Co-Pilot delivers real-time institutional and policy-driven insight, making it an essential tool for traders looking to stay ahead in an increasingly fast-paced and macro-sensitive environment.

Discover how our integrated intelligence can transform your FX trading performance. Contact enquiries@permutable.ai to unlock these market-moving insights in real-time.

Jack Watson is Permutable AI’s in-house analyst, leveraging our AI-driven insights to decode market trends, uncover global data signals, and explore how intelligent analytics are reshaping trading and investment strategies.

How energy traders can develop a smarter lens on breaking geopolitical tensions 2025

This comprehensive analysis explores how energy traders are adapting to navigate breaking geopolitical tensions 2025 through advanced market intelligence and AI-powered insights. Written for commodity traders, energy analysts, portfolio managers, and institutional trading desks seeking sophisticated tools to decode complex market dynamics and geopolitical risks.

It’s fair to say that energy markets have entered an era of unprecedented complexity, where breaking geopolitical tensions 2025 continue to reshape global commodity flows and pricing dynamics in ways that traditional analysis simply cannot capture. For energy traders operating across Brent crude, LNG, TTF, and Henry Hub markets, the challenge extends far beyond fundamental supply and demand metrics. Today’s successful trading strategies require a sophisticated understanding of how geopolitical developments, sanctions regimes, pipeline disruptions, and OPEC statements cascade through interconnected global energy systems.

The reality facing energy traders today is that market-moving events often unfold with little warning, and their impacts ripple across multiple energy commodities simultaneously. Consider the significant movements witnessed in the LNG market over recent fortnights, driven by a volatile combination of geopolitical uncertainty and robust demand-side fundamentals. These market conditions exemplify why energy traders require more than traditional analysis – they need intelligent systems capable of processing vast amounts of real-time information and translating complex geopolitical signals into actionable trading insights.

LNG trade Chart

Above – LNG Momentum in the Era of Breaking Geopolitical Tensions 2025.  This chart illustrates how Permutable AI detected a bullish regime shift in LNG markets amid breaking geopolitical tensions 2025. Powered by robust macroeconomic and fundamental sentiment signals, the system enabled early positioning ahead of major price moves—driven by shifting policies, sanctions, and supply disruptions across the LNG landscape.

The limitations of traditional energy market analysis

Traditional energy market analysis has relied heavily on fundamental metrics such as inventory reports, production data, and seasonal demand patterns. However, these approaches fundamentally misunderstand how breaking geopolitical tensions actually influence energy pricing mechanisms. Modern energy markets are increasingly driven by sentiment, expectation, and risk perception rather than purely by physical supply and demand imbalances. When Iran-Israel tensions escalate or sanctions discussions emerge, the market impact often precedes any actual supply disruption by weeks or months.

This disconnect between traditional analysis and market reality has created significant opportunities for energy traders equipped with advanced intelligence capabilities. The most successful energy trading desks now recognise that geopolitical sentiment analysis, combined with sophisticated data processing, provides superior insights compared to conventional fundamental analysis alone. The challenge lies in accessing and interpreting the vast streams of global information that influence energy market sentiment on an hourly basis.

Advanced intelligence for complex energy markets

The transformation in energy trading intelligence represents a fundamental shift towards systems that can process and interpret thousands of global information sources simultaneously. Rather than relying on delayed reports or simplified sentiment indicators, elite energy trading desks can now leverage proprietary multi-agent frameworks that combine artificial intelligence with large language model sentiment analysis to provide real-time market intelligence.

As per feedback from our clients, this next gen capability has proven particularly valuable in recent market conditions. For instance, our comprehensive AI-driven analysis of the Iran-Israel conflict‘s impact on global financial markets has demonstrated how geopolitical tensions create distinct risk patterns and market opportunities that differ significantly from other geopolitical events such as the Russia-Ukraine situation. Institutional investors and trading professionals who understand these nuanced patterns can position themselves advantageously during periods of heightened uncertainty.

Multi-factor analysis dashboard showing the ranking of fundamental and geopolitical factors

Above – Decoding Market Risk Amid Breaking Geopolitical Tensions 2025: This multi-factor dashboard visualizes how real-time AI sentiment across geopolitical, macroeconomic, and fundamental drivers correlates with price movements in energy markets. As breaking geopolitical tensions 2025 continue to reshape global commodity flows, tools like this are essential for traders seeking clarity in an increasingly complex environment.

Real-time intelligence across energy commodities

The good news is that the sophistication of the kind of modern energy market intelligence we offer here at Permutable extends across all major energy commodities, from crude oil benchmarks to natural gas markets. Recent analysis of TTF price movements and underlying European gas sector dynamics illustrates how real-time intelligence systems can decode the drivers behind market resilience even during volatile periods. Energy commodity traders and portfolio managers now have access to comprehensive insights that reveal the subtle interplay between regional pricing mechanisms and global sentiment indicators.The practical value of advanced intelligence systems becomes evident through specific trading outcomes. Our recent case study demonstrated how AI-driven sentiment analysis can accurately predict Henry Hub natural gas price movements, leading to demonstrable gains such as the documented 5.5% return achieved through advanced market intelligence. These results showcase the tangible benefits available to energy traders and commodity fund managers who embrace cutting-edge analytical methods like our Trading Co-Pilot intelligence suite rather than relying on conventional market analysis.


Breaking geopolitical tensions 2025: Regional pricing dynamics and global sentiment integration

One of the most vital aspects of modern energy trading involves understanding how global news sentiment translates into regional pricing impacts. Energy markets are inherently global, yet pricing mechanisms remain distinctly regional. Brent crude pricing reflects different sentiment factors compared to WTI, while LNG pricing in Asia responds to different geopolitical signals than European TTF pricing. It is here that our advanced intelligence systems excel at mapping these complex relationships, providing traders with nuanced insights into how global events will impact specific regional markets.The integration of global macroeconomic data feeds with real-time sentiment analysis enables our clients to anticipate market movements rather than merely react to them. This capability proves particularly valuable during periods of breaking geopolitical tensions, when traditional correlations may break down and new market dynamics emerge rapidly. Traders equipped with sophisticated intelligence platforms can identify optimal positioning opportunities while others struggle to interpret conflicting signals from conventional data sources.

The competitive advantage of advanced market intelligence 

Energy trading success increasingly depends on access to superior information processing capabilities rather than simply having more information. The most successful trading operations now combine proprietary data feeds with advanced analytical frameworks that can synthesise complex global developments into actionable trading signals. This approach enables traders to maintain consistent performance even during volatile market conditions driven by breaking geopolitical tensions 2025 and beyond. The evidence supporting this evolution in energy trading intelligence continues to accumulate through documented trading outcomes and market analysis. 
 
From detecting volatile energy market landscapes in LNG to accurately forecasting natural gas price movements, advanced intelligence systems demonstrate consistent value creation for institutional energy trading operations. The key differentiator lies not in the raw data available to traders, but in the sophisticated analytical capabilities that transform complex information streams into precise trading insights.Energy markets will continue evolving in response to geopolitical developments, technological changes, and shifting global demand patterns. Traders who adapt their analytical capabilities to match this complexity will maintain competitive advantages, while those relying on traditional methods will find themselves increasingly disadvantaged in fast-moving markets influenced by breaking geopolitical tensions 2025.

Navigating breaking geopolitical tensions 2025 with superior LLM-driven energy trading intelligence

Discover how our energy market sentiment feeds can give you new edge in your your energy trading through advanced sentiment analysis, real-time geopolitical intelligence, and proven market insights across Brent, LNG, TTF, and Henry Hub markets. Don’t let traditional analysis limit your trading potential when sophisticated AI-driven intelligence is available.

Contact our team at enquiries@permutable.ai to schedule a personalised demonstration and see how our global macroeconomic data API can transform your energy trading strategy. Experience firsthand how cutting-edge market intelligence turns complex geopolitical signals into profitable trading opportunities.